15TH INTERNATIONAL CONFERENCE ON QUALITY IN RESEARCH (QIR 2017)
SERVICE DELIVERED ON NEW TRANSIT SYSTEM FROM USERS VIEWPOINT (CASE STUDIES: TRANSJOGJA AND TRANSMUSI-INDONESIA)
Aleksander Purbaa*, Fumihiko Nakamurab, Dwi Heriantoc
acCivil Engineering Department, the University of Lampung, Bandar Lampung, 35145, Indonesia bGraduate School of Urban Innovation, Yokohama National University, 79-5 Tokiwadai, Hodogaya-ku,
Yokohama, 240-8501, Japan
Abstract
Aiming to tackle the increased motorization in Indonesian cities, particularly motorcycles phenomenon, the Ministry of Transportation (MoT) of Indonesia enacted decree No. 51 of 2007, promoting pilot cities for land transport improvement. From the target of thirty pilot cities by 2014, to date, twenty-seven cities have signed a memorandum of understanding with MoT and launched more than twenty new urban bus systems, including TransJogja of Jogjakarta and TransMusi of Palembang. The aim of this study is to explore user perceptions of new urban bus service, regarding quality of service, subsidy and fare, satisfaction, and loyalty. The structural equation modeling is applied to examine user’s satisfaction by testing some hypotheses. According to the level of significance and regression weight, the safety and security (0.784/0.834), and customer service and information availability (0.764/0.514) are the two most important attributes for improving the quality of service of TransJogja as well as TransMusi models, in addition to the subsidy and fare (0.881) attribute in TransJogja model alone. In regards to subsidy and fare policy, the distribution of subsidies (0.833), and effect of subsidization (0.708) attributes are the two most willing to pay attention the local government in the TransJogja model, while the effect of subsidization (0.641) attribute is the one with the highest priority in the TransMusi model which could lead to increase the effectiveness of transport subsidies. In terms of satisfaction, the satisfaction with comfort (0.873), and satisfaction with helpfulness of personnel (0.816) attributes are the two most recommended aspects for the improvement of customer satisfaction in the TransJogja model, as well as loyalty to use if the fare is affordable (0.779), and loyalty to use if the services is satisfactory (0.695) attributes, which are necessary elements for maintaining customer loyalty. Additionally, loyalty to use if the service is satisfactory (0.725) attribute is the one with the highest priority element for maintaining customer loyalty in the TransMusi model.
Keywords: New urban bus; service quality; SEM; attribute; Indonesia
1. INTRODUCTION
Trying to suppress the increased motorization in Indonesian cities, particularly motorcycles, the Ministry of Transportation (MoT) enacted a decree No 51 of 2007 promoting pilot cities for land transport improvement. The decree mandates the pilot city candidates to reflect their commitments by providing documents declaring their preparedness in terms of institutional capacity, funding capacity, human resource availability and urban transportation master plan. Moreover, the initiatives gained stronger regulatory support by the enactment of the new Traffic Law No 22 of 2009. The law specifically promotes pro-public
transport policy development in the cities. In Article 158, it’s explicitly states that the government must
ensure the availability of land-based mass transit system to meet urban mobility needs. As the implementation of the law, MoT provides technical assistance to promote new urban transit system in order
* Corresponding author.
to gradually replace the old buses and restructure the existing bus routes to create a more efficient urban bus networks.
The MoT funds several fleets, supports some of the infrastructures and the local government is required
to allocate resources and subsidies simultaneously to ensure the sustainability of new urban bus system’s
operation. From the target of twenty pilot cities by 2013, to date, fourteen cities have signed memorandum of understanding with MoT and launched such transit systems, including TransJakarta (the pioneer of the urban bus reform in Indonesia), TransJogja of Jogjakarta and TransMusi of Palembang are included in it. Fostering public transportation is usually one of the key elements in any such strategy. Urban buses and related road-based public transport play the most important role in most developing world, especially beyond the main corridor which may be served by light rail and suburban trains (GIZ, 2011).
The new bus systems are planned to operate on dedicated lanes. However, to date, only TransJakarta does so, while the others including TransJogja and TransMusi run in mixed traffic due to, among others, technical barriers, such as narrow streets in Jogjakarta and Palembang. The new vehicles are air-conditioned and more fuel-efficient (Euro-II compliant diesel-powered bus) compared to most existing buses. Some fleets use environmentally friendly fuel such as CNG in Palembang. The availability of city gas networks and CNG stations remains the major limitation in expanding the deployment of CNG buses.
It is inevitable that one important aspect influencing the sustainability of new urban buses is service quality performance. Therefore, referring to Kersten (2010), it is necessary to determine whether their customers were satisfied. Information gathered from the user is important in evaluating service performance, as the exclusion of customers from improvement efforts to date has created difficulties (Schaffer, 1995). Hence, the measurement of customer perceptions of urban bus performance and policy can reveal problems and priorities and how the urban population actually perceives the issues (Winder, 2005). Moreover, the notion of customer satisfaction is important because satisfying current users is a way to retain them and to attract potential customers. Fornell (1992) found that improving market share and improving customer satisfaction individually results in higher profitability.
Unfortunately, most of studies measuring customer satisfaction of urban bus performance have been conducted using data from developed countries, while relevant studies in developing countries are limited (Jen and Hu, 2003; Kim et al., 2005; Zhang et al., 2005; Joewono and Kubota, 2007a, 2007b for
exceptions). The aim of this research is to examine user’s satisfaction by testing some hypotheses related
to the quality of service, subsidy and fare, satisfaction, and loyalty. A structural equation –the structural equation modeling (SEM)– model is proposed. SEM is useful to researchers as a multivariate technique combining regression, factor analysis, and analysis of variance to estimate interrelated dependence relationships simultaneously.
This article begins with introduction to a brief highlight of two case study cities. Next, a theoretical framework of structural equation models is described. Next section will explain an account of data collection and characteristics of respondents, followed by study’s attributes and hypotheses and explore a factor analysis and structural model. The final section will present a discussion of the results.
2. OUTLINE OF JOGJAKARTA AND PALEMBANG
registered number as there are many students living in the city who are still registered at their parents’
address.
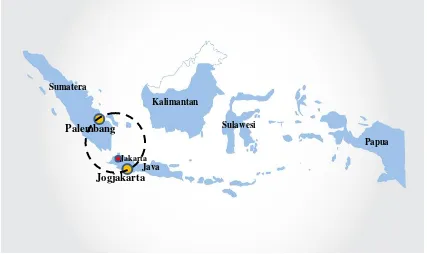
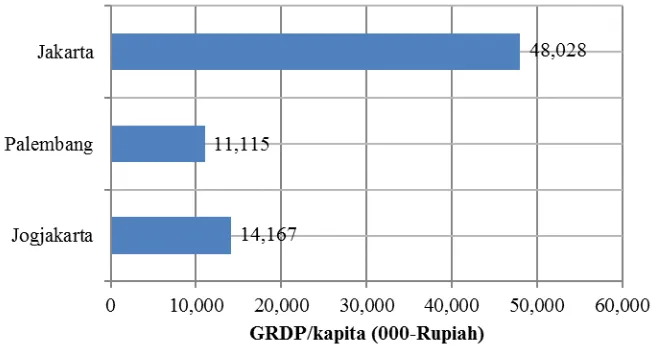
The gross regional domestic product per capita shows both cities are much smaller than Jakarta as the capital of Indonesia during the period of 2011 to 2012 (Figure 2). It is inevitable that the high gap of incomes among regions is the cause of continuing massive urbanization to Jakarta from surroundings provinces, municipalities and regencies in addition to the matter of availability of employment. The Gross Regional Domestic Product (GRDP) or gross domestic product of region is a sub-national gross domestic product for measuring the size of that region's economy. It is the aggregate of gross value added of all resident producer units in the region. The GRDP includes regional estimates on the three major sectors including their sub-sectors namely:
Agriculture, fishery and forestry (primary)
Industrial sector, including mining and quarrying, manufacturing, construction, electricity and water (secondary)
Service sector, including transport, communication and storage, trade, finance, renting and business services and other private services (tertiary).
Figure 1 Jogjakarta and Palembang on Indonesia map 3
Sumatera
Java
Kalimantan
Sulawesi
Papua Palembang
Jakarta
Figure 2 GRDP/capita of selected cities and Jakarta
During 2011-2012, the driving force of cities’ economics is totally structured by both secondary and tertiary sectors (Figure 3); in Jogjakarta the secondary and tertiary sectors contributed with 31% and 68%, respectively, and in Palembang the contribution was 44% and 55%, respectively. The lesser presence of the primary sector means agriculture is no longer attractive to most urban communities.
Figure 3 Forming of structure economic, by sector
3. STRUCTURAL EQUATION MODELS Structural equation modeling
• is a comprehensive statistical approach to testing hypotheses about relations among observed and latent variables.
• is a methodology for representing, estimating, and testing a theoretical network of (mostly) linear relations between variables.
• tests hypothesized patterns of directional and non-directional relationships among a set of observed (measured) and unobserved (latent) variables (MacCallum & Austin, 2000).
Two goalsin SEM are (1) to understand the patterns of correlation/covariance among a set of variables and (2) to explain as much of their variance as possible with the model specified (Kline, 2005).
0.4%
31.4%
68.2%
It is inevitable, the SEM methodology spread quick as a consequence of the rapid development of specific packages, like LISREL (Jereskog and Sorbom, 1988; 1989; 1995) and AMOS (Arbuckle and Wothke, 1999). The presence of these packages has encouraged some applications in different contexts. This approach enables the modelling of a phenomenon by considering both the unobserved latent construct and the observed indicators that describe the phenomenon.
Originally, SEM are made up of two components, i.e. the first describes the relationship between endogenous and exogenous latent variables, and permits the evaluations of both direction and strength of the causal effects among these variables (latent variable model); the second component describes the relationship between latent and observed variables (measurement model).
Generally, the structural equation modelling is estimated by using the maximum likelihood method (ML). In other cases, the structural equation model parameters can be estimated by using other estimation methods, such as unweighted least squares (ULS), weighted least squares (WLS), and generalized least squares (GLS), and so on. These estimation methods are described in Bollen (1989) and Washington, et al. (2003).
Path analysis with SEM is similar to traditional methods like correlation and regression in many ways. First, both regression and path analysis are based on linear statistical models. Second, statistical tests associated with both methods are valid if certain assumptions are met. Regression methods assume a normal distribution and path analysis assumes multivariate normality. Third, neither approach offers a test of causality.
Regression analysis differs from path analysis in several areas. First, path analysis is a highly flexible and comprehensive methodology. Second, regression methods specify a default model whereas path analysis with SEM requires formal specification of a model to be estimated and tested. SEM offers no default model and places few limitations on what types of relations can be specified. SEM model specification requires researchers to support hypothesis with theory or research and specify relations a priori. Third, path analysis is a multivariate technique specifying relationships between observed (measured) variables. Multiple, related equations are solved simultaneously to determine parameter estimates. Variables in path analysis could be independent and dependent whereas variables in Regression Analysis are either independent or dependent. Fourth, path analysis allows researchers to recognize the imperfect nature of their measures. SEM explicitly specifies error or unexplained variance while regression analysis assumes measurement occurs without error.
Fifth, traditional analysis provides straightforward significance tests to determine group differences, relationships between variables, or the amount of variance explained. Path analysis provides no straightforward tests to determine model fit. Instead, the best strategy for evaluating model fit is to examine multiple tests. Finally, a graphical language provides a convenient and powerful way to present complex relationships in path analysis. Model specification involves formulating statements about a set of variables. A diagram, a pictorial representation of a model, is transformed into a set of equations. The set of equations are solved simultaneously to test model fit and estimate parameters.
4. DATA COLLECTION
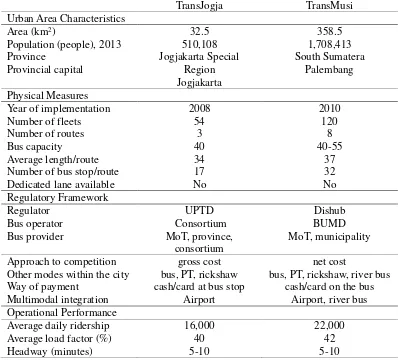
A single transit agency manages the urban bus in each city. They are the Jogja Tugu Trans Limited in Jogjakarta and the Sarana Pembangunan Palembang Jaya Limited in Palembang. Generally, the service is available from 6 am to 21 or 22 pm but a service frequency is delivering without timetable. Buses operate on the same street network as other traffic; frequency depends on the level of congestion on a specific route. Buses can operate as frequently as every 10 minutes during peak hours to once an hour, and vary by time of day. During off-peak times, there is less frequency than during peak hours.
The field surveys, conducted in June to July 2014, were addressed to Trans bus passengers who use the
Jogjakarta’s TransJogja and Palembang’s TransMusi services. A team of surveyors distributed
questionnaire on-board and then surveyors approach passengers personally to ask them to fill the questionnaire. The personal approaches in the survey process could be shown by the willingness of surveyors to guide respondents when completing the questionnaires, up to explaining questions to them in cases where respondents could not understand the meaning of certain words, particularly subsidy and fare aspects.
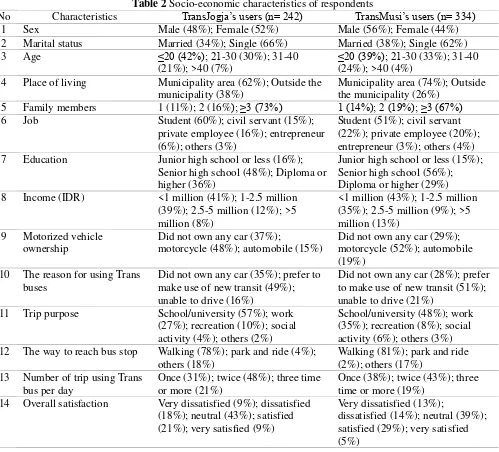
Average speed (km/h) further analysis, while of the 370 questionnaires returned by TransMusi users, only 334 questionnaires could be used in the next stages of the model analysis. The descriptive statistics of the respondents are reported in Table 2. As shown in the table below, more than a half of Trans users of both Jogjakarta and Palembang cities are students. Another striking characteristic of respondent is the age of the majority of users is under 40 years old and single status. The possible impact of this high percentage of the subsample is that perception of students and young users possibly dominates the perception of the users as a whole.
Table 2 Socio-economic characteristics of respondents
No Characteristics TransJogja’s users (n= 242) TransMusi’s users (n= 334)
1 Sex Male (48%); Female (52%) Male (56%); Female (44%)
2 Marital status Married (34%); Single (66%) Married (38%); Single (62%)
3 Age ≤20 (42%); 21-30 (30%); 31-40
(21%); >40 (7%)
≤20 (39%); 21-30 (33%); 31-40
(24%); >40 (4%)
4 Place of living Municipality area (62%); Outside the
municipality (38%)
7 Education Junior high school or less (16%);
Senior high school (48%); Diploma or
10 The reason for using Trans buses
11 Trip purpose School/university (57%); work
(27%); recreation (10%); social
13 Number of trip using Trans bus per day
Once (31%); twice (48%); three time or more (21%)
Once (38%); twice (43%); three time or more (19%)
is increasing. In terms of income, about 80 percent of Trans users are from lower-class households and about 10 percent are from the wealthiest class.
6. ATTRIBUTE AND HYPOTHESES
Based on the literature review, the attributes of service quality were selected and formulated for exploring user satisfaction, categorizing quality of service into four factors with each factor having three attributes. Table 3 presents the factors and their attributes which are probably similar to any other measurement conducted by other researchers. However, this research argues that a specific attribute formulated for measuring the performance of new urban bus service in developing countries such as Indonesia exists, particularly subsidy related attributes. In order to make transport more affordable, subsidies are implemented by the local governments of Jogjakarta and Palembang. If more people use urban bus service and become comfortable with that service, then they will be more loyalty to use it to go destinations where other modes do not go. This would benefit the city, and community in many ways.
Table 3 Factors and attributes of Trans bus
Factors Attributes
1. Service quality (Q)
• Frequency and reliability (X1) • Safety and security (X2)
• Customer service and information availability (X3) 2. Subsidy and
• Satisfaction with overall services (Y4) • Satisfaction with comfort (Y5)
• Satisfaction with helpfulness of personnel (Y6)
4. Loyalty (L)
• Loyalty to use if service quality improved (Y1) • Loyalty to use if the overall services satisfy (Y2) • Consider/return to use if the fares affordable (Y3)
Hence, we can deduce some hypotheses to test using structural equation modeling, e.g.: H1: service quality is positively correlated to fare subsidy
H2: service quality is positively related to future loyalty H3: service quality is positively related to satisfaction H4: satisfaction is positively related to future loyalty
It is also seeming logical to test the relationship between sustainable source of subsidy and affordable fare which hypothetically influence the characteristics of the service quality by explaining their dependence on the mode:
H5: subsidy and affordable fare are positively related to satisfaction H6: subsidy and affordable fare are positively related to future loyalty.
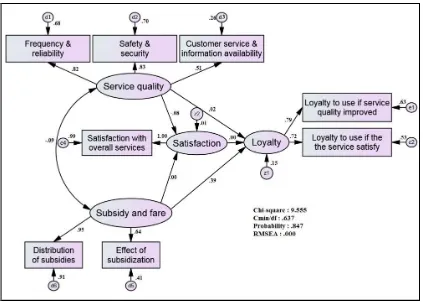
7. FACTOR LOADING
In this paper, path analysis was employed to reveal the relationship among variables. The model was calibrated using AMOS 22 package from SmallWaters Corporation (Arbuckle and Wothke, 1995). Model results of TransJogja users and TransMusi users are shown in Table 4 and Figures 4 and 5. More specifically, the standardized factor loading estimates, some tests on the goodness of fit and the level of statistical significance of each variable are reported in Table 4.
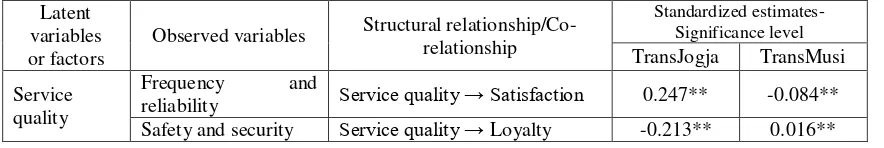
Table 4 Standardized factor loading estimates Latent
reliability Service quality → Satisfaction 0.247** -0.084**
Customer service &
Affordability of fare Subsidy and fare → Satisfaction 0.651*** 0.004**
Effect of
subsidization Subsidy and fare → loyalty 0.930*** 0.392***
Distribution of
overall services Satisfaction → Loyalty 0.226** 0.002**
Satisfaction with
helpfulness of personnel 0.816*** --
Satisfaction→ Satisfaction with
service quality improved 0.799* 0.793*
Loyalty to use if the service satisfy
Loyalty → Loyalty to use if the
services satisfy 0.695*** 0.725***
Loyalty to use if the fare is affordable
Loyalty → Loyalty to use if the
Figure 4 Relationship among variables of TransJogja model
Figure 5 Relationship among variables of TransMusi model
On the other hand, the values of GFI, AGFI, NFI, IFI, and CFI for the TransMusi model are 0.993, 0.983, 0.985, 1.009, and 1.000, respectively. Some of the parameter fit values of the TransMusi model exceed one, implying a marginal fit model.
As can be seen in Table 4, only two from six determinants of service quality and none from five determinants of subsidy and fare, are significant at 5 percent in the TransJogja model, while three from six determinants of service quality and one from five determinants of subsidy and fare, are significant at 5 percent in the TransMusi model. Further, only one from four determinants of satisfaction is significant at 5 percent in the TransJogja model as well as in TransMusi model. Three from six determinants of service quality and four from five determinants of subsidy and fare, are significant at 1 percent in the TransJogja model, while two from six determinants of service quality and two from five determinants of subsidy and fare, are significant at1 percent in the TransMusi model.
Moreover, two from four determinants of satisfaction and two from three determinants of loyalty, are significant at 1 percent in the TransJogja model, while none from four determinants of satisfaction and one from three determinants of loyalty, is significant at 1 percent in the TransMusi model. Referring to the standardized regression weights in Table 4, it is clear that all latent variables of service quality, subsidy and fare, satisfaction, and loyalty are valid (values greater than 0.5) in the TransJogja model. Meanwhile in the TransMusi model, a number of observed latent variable except in service quality had to be removed since their regression weight values are less than 0.5.
According to the level of significance and regression weight, the safety and security (0.784/0.834), and customer service and information availability (0.764/0.514) are the two most important attributes for improving the quality of service of TransJogja as well as TransMusi models, in addition to the subsidy and fare (0.881) attribute in TransJogja model alone. In regards to subsidy and fare policy, the distribution of subsidies (0.833), and effect of subsidization (0.708) attributes are the two most willing to pay attention the local government in the TransJogja model, while the effect of subsidization (0.641) attribute is the one with the highest priority in the TransMusi model which could lead to increase the effectiveness of transport subsidies.
In terms of satisfaction, the satisfaction with comfort (0.873), and satisfaction with helpfulness of personnel (0.816) attributes are the two most recommended aspects for the improvement of customer satisfaction in the TransJogja model, as well as loyalty to use if the fare is affordable (0.779), and loyalty to use if the services is satisfactory (0.695) attributes, which are necessary elements for maintaining customer loyalty. Additionally, loyalty to use if the service is satisfactory (0.725) attribute is the one with the highest priority element for maintaining customer loyalty in the TransMusi model. As shown in Table 4, the estimated coefficient of satisfaction from service quality is smaller than that of satisfaction from subsidy and fare as well as coefficient of loyalty from satisfaction than that of loyalty from subsidy and fare. These results indicate that the transport subsidies and permanently available in case study cities are the most important measures for maintaining customer satisfaction and loyalty rather than efforts to improve the quality of service and satisfaction as well. Since the funding for urban bus subsidies are provided from a public budget, bus subsidy and it political support plays a crucial role in supporting new urban bus services.
There are three hypotheses in TransJogja model and one hypothesis in TransMusi model with all regression weights significant at 1 percent. Other hypotheses are less statistically significant (level of significance 5%). The first hypothesis, which positively correlates quality of service with subsidy and fare, is statistically significant, supported by the positive value (TransJogja model). This implies that the higher the quality of service, more subsidy is required, or vice versa, the higher the subsidy level, higher quality of service could be provided. This result looks natural and reasonable.
statistically supported (TransJogja and TransMusi models). It stands to reason that the higher the subsidy, the more loyal the users are likely to be. The third hypothesis, the relationship between subsidy and fare, and satisfaction, is also statistically supported (TransJogja model). This implies that higher amount of
subsidy shall also increase TransJogja users’ satisfaction.
The fourth hypothesis, the relationship between service quality and satisfaction (TransJogja model), the fifth, the relationship between service quality and loyalty (TransMusi model), and the sixth, the relationship between satisfaction and loyalty (TransJogja and TransMusi models) all have positive values but are statistically less significant. These show that the higher the quality of service provided does not directly increase user satisfaction and loyalty, as well as the increase users’ satisfaction does not directly increase user loyalty, since both satisfaction and loyalty are influenced by other aspects and possibly causing valuable information to be left out. The seventh hypothesis, the co-relationship between service quality and subsidy and fare (TransMusi model), the eighth, the relationship between service quality and satisfaction (TransMusi model), and the ninth, the relationship between service quality and loyalty (TransJogja model) were confirmed by less significant negative values. Additionally, the models show that the service quality construct influences loyalty 0.213) more strongly than it does to subsidy and fare (-0.091), and also satisfaction (-0.084).
The last three hypotheses support the finding that Trans bus users do not perceive loyalty, subsidy and
fare, and satisfaction independently. In facts, dependence on Trans bus influences users’ perceptions of
loyalty, subsidy and fare, and satisfaction to the mode. In this study the service quality delivered represents the dependence on Trans bus. It is understandable that even with low quality of service provided and distribution of transport subsidies is not well-targeted, the users tend more readily to perceive the available service as satisfactory and to show more loyalty to it, as long as it is able to fulfill their mobility needs. These last three hypotheses differentiate user characteristics in developed countries from those in developing countries.
8. DISCUSSION AND CONCLUSIONS
In this paper, authors examine passenger perception which was expressed by Trans bus user
participation in rating the new mode’s condition, including service quality, satisfaction and loyalty. Authors
try to explore more deeply with regard to the effects of subsidy and fare of latent variable, since both operators of TransJogja and TransMusi receive a direct transfer from the local government to keep fares low. The distribution of questionnaire to TransJogja and TransMusi passengers took places in Jogjakarta and Palembang, Indonesia. These cities have been chosen because these are the most populated areas and the most rapid growth of Trans bus systems, respectively. They are also of comparable size in terms of urban bus system operations and data is available on the local level in both selected cities.
This research employs the path analysis to reveal the relationship between customer loyalty on new urban bus services and variables of the services quality. Even when SEM methodology is well known and widely applied in several fields of research, currently there are not so many practical applications in urban public transport, especially for measuring customer satisfaction and loyalty. In this research authors have applied this methodology on the basis of levels of service, levels of satisfaction, and affordability expressed by customers of the Trans bus services. The model results identify service quality, subsidy and fare, and satisfaction attributes to improve, with the aim of offering new urban bus services characterized by higher levels of service delivered.
and cultural characteristics, lessons learned or model developed from one community in one region/city are not transferable to the other. Success in implementation of any measure depends on local circumstances.
9. REFERENCES
1) Arbuckle, J.L., and Worthke, W. (1999). Amos 4.0 User’s Guide, SmallWater Corporation, Chicago,
IL.
2) Bamberg, S., and P. Schmidt (1998). Changing travel-mode choice as a rational choice: Results from a longitudinal intervention study. Rationality and Society, Vol. 10(2), 223-252.
3) Bollen, K. A. (1989). Structural equations with latent variables. New York: Wiley.
4) Dirgahayani, P. (2012) Policy elements to upscale the contribution of urban transit initiative on sustainable urban transport: the case of bus improvement initiatives in Indonesia. UNU-IAS Working Paper No. 168, 23pp.
5) Eboli, L., & Mazzula, G. (2007). Service Quality Attributes Affecting Customer Satisfaction for Bus Transit. Journal of Public Transportation, Vol.10, No.3, 21-34.
6) Eboli, L., and Mazzulla, G. (2009) A new customer satisfaction index for evaluating transit service quality, Journal of Public Transportation, Vol. 12(3), pp. 21-37.
7) Fillone, A. M., C. M. Montalbo, and N. C. Tiglao (2005). Assessing urban travel: A structural equations modeling (SEM) approach. Proceedings of the Eastern Asia Society for Transportation Studies, Vol. 5, 1050-1064.
8) Fornell, C. (1992), A national customer satisfaction barometer: the Swedish 33 experience, Journal of Marketing, Vol. 56, 6-21.
9) GIZ, (2011) Environmental Report 2011, Published by Deutsche Gesellschaft für Internationale Zusammenarbeit (GIZ) GmbH.
10)Hensher, D.A. (1998). The imbalance between car and public transport use in urban Australia: why does it exist? Transport Policy, Vol. 5, 193-204
11)International Energy Agency –IEA (2002). Bus Systems for the Future: Achieving Sustainable Transport Worldwide
12)Jen, W., and Hu, K-C. (2003). Application of perceived value model to identify factors affecting
passenger’s repurchase intentions on city bus: a case study of the Taipei metropolitan area. Transportation, Vol. 30, 307–327.
13)Joewono, T.B., Kubota, H. (2007a). Users’ satisfaction of paratransit in Indonesia: Anticipation for the Future Implications. Transportation, Vol. 34, 337 - 354.
14)Joewono, T.B., Kubota, H. (2007b). Exploring negative experience and user loyalty in para transit. Transportation Research Record, No. 2034, 134 - 142.
15)Joewono, T.B., and Kubota, H. (2007c) The multi group analysis regarding user perception of paratransit service. Journal of the Eastern Asia Society for Transportation Studies, Vol. 6
16)Joreskog, K. G., and D. Sorbom (1988). PRELIS: A program for multivariate data screening and data summarization. A preprocessor for LISREL. Chicago: SSI, Inc.
17)Joreskog, K. G., and D. Sorbom (1989). LISREL 7: A guide to the program and application. Chicago: SPSS, Inc.
18)Joreskog, K. G., and D. Sorbom (1995). LISREL 8: Scientific Software International. Chicago: SPSS, Inc.
19)Kersten, W., and Koch, J. (2010) The effect of quality management on the service quality and business success of logistics service providers. Int. J. Qual. Reliab. Manage., 27(2), pp. 185-200.
21)Kline, R.B. (2005) Principles and Practice of Structural Equation Modeling, Second Edition, The Guilford Press, New York.
22)MacCallum, R. C., and J. T. Austin (2000). Application of structural equation modeling in psychological research. Annual Review of Psychology 51,201-226
23)Ministry of Transport of Indonesia (2007) Decree No. 51 of 2007: Land Transport Pilot Implementation Guidelines (Pedoman Penyelenggaraan Percontohan Transportasi Darat), September 2007.
24)Sekaran, U. (1992). Research methods for business, a skill building approach 2nd edition. New York: John Wiley & Sons, Inc.
25)Schaffer, D. (1995). Competing based on the customer’s hierarchy of needs. Natl. Product. Rev., pp. 9– 15.
26)Susilo et al., (2009). An exploration of public transport users’ attitudes and preferences towards various policies in Indonesia: some preliminary results. Journal of EASTS, Vol. 8
27)Tam, Mei Ling, Mei Lang Tam, and W. H. K. Lam (2005). Analysis of airport access mode choice: A case study in Hong Kong. Journal of the Eastern Asia Society for Transportation Studies, Vol. 6, 708-723.
28)TCRP (2003). Kittelson & Associates, Inc., LKC Consulting Services, Inc., Morpace International, Inc., Queensland University of Technology and Nakanishi, Y., “A Guidebook for Developing a Transit Performance-Measurement System” TCRP Report 88. Transportation Research Board, Washington, D.C. 2003
29)Washington, S.P., M. G. Karlaftis, and F.L. Mannering (2003). Statistical and econometric methods for transportation data analysis. Florida: Chapman & Hall/CRC Press.
30)Winder, A., ed. (2005). Public perception of urban transport performance and policy. Survey Report for the EU-15, National Policy Frameworks (NPF) Urban Transport, Lyon.