The University of Lampung Internet Traffic
Measurement: Trends and Impact in Campus
Network
Gigih Forda Nama, Yessi Mulyani, Mardiana, R. Arum Setia Priadi, Hery Dian Septama, Meizano Ardhi Muhammad, Titin Yulianti
Department of Informatics Engineering, University of Lampung, Indonesia.
(E-mail: [email protected], [email protected], [email protected], [email protected], [email protected], [email protected], [email protected])
Abstract— University of Lampung (Unila) is an Institution of Higher Education located in Bandar Lampung. Since 2016, Unila has deployed Internet Access Management(IAM) to guarantee the healthiness of the campus network, as well as to enhance the effectiveness of the bandwidth usage.
This study focused on internet traffic measurement, conducted in Unila’s campus network during February 1 until February 29, 2016. Overall, this study shows user behavior on their application. The trend data of monthly most popular URL Categories accessed by users was; 1st Computers & Technology with 30032328 hits or
39.1%, the 2nd was Search Engines & Portals with 14214611 hits
or 18.5%. There were around 30-40 % of internet traffic was use for Streaming Media activity, it proves that the existence of Streaming Media Activity in Campus Network which contribute to network congestion. During a month doing internet measurement, we identify the most active device/user that are the 1st was Aruba Wireless Controller with total traffic flow 40.45%,
the 2nd was CCR-1 with 26.2%, the 3rd was CCR-2 with 16.9%,
and the 4th was Digital Library Server with total flow was 0.6%.
Monthly uplink traffic total flow was 5889.92 GB while downlink traffic total flow was 61041.35 GB.
We made a recommendation to Unila management for implementing traffic provisioning especially on streaming media activity specific on access to Google Global Cache (GGC), to overcome network congestion during peak time period on working hours.
Keywords— internet access management; internet traffic measurement; traffic trend
I. INTRODUCTION
University of Lampung (Unila) is an Institution of Higher Education located in Bandar Lampung - the provincial capital of Lampung, Indonesia. Established in September 13, 1965. Unila has deployed Internet Access Management to guarantee the healthiness of the campus network, as well as to enhance the effectiveness of the bandwidth.
Unila has around 6.000 concurrent online users used internet at peak time from almost 27.000 of total Academia Civitas, which brings the difficulty to manage the campus network.
As an academic area, the University wants to conducting internet traffic measurements to understand the performance of networks, for troubleshooting needs, to figure out where the faults are, concerned about ensuring the security of networks, also to check whether internet operators are in compliance with the Service Level Agreements (SLA), and to make decisions of how to invest for the deployment of the future Internet infrastructure.
Since February 2016, UNILA already developed Internet Access Management (IAM) using SANGFORTM system, to provide an integrated solution to monitor, manage and accelerate the Unila’s network. IAM can identify and categorize the Internet resources by comprehensive reports, so Administrator capable to visualize the Internet usage status and filter the non-work related websites and applications.
It is very important to isolate the students from the disruptive Internet content such as pornography, violence and gambling. In addition, young students use P2P download softwares and video streaming actively should be warned, which consumes loads of bandwidth and causes network congestion to other critical applications.
II. RELATED WORKS
Network traffic measurement provides an Administrator network to understand the traffic flow behavior in term of throughput, latency, speed, and packet data transmission. By using specialized network measurement hardware or software, online or offline measurement, an administrator network can collect more information about packets transmission on their network [1] [2]. Based on research of internet user behavior by a group of researcher from Lund University, Sweden, they categorized application into 7 categories that are [3] web browsing, multimedia streaming, Peer to Peer (P2P), file transfer, game online, messaging and collaboration, and secure session. The network administrator should know exactly which applications/users are consuming the most of network bandwidth resource [4]. A study on mature of IEEE 802.11 WLAN campus at Darmouth College, USA found that the applications used on the WLAN changed affectedly. Initial WLAN usage was majoring by Web Traffic; but the study shows significant increases especially in P2P, streaming multimedia, and voice over IP (VoIP) traffic [5]. An increase in the percentage of P2P traffic and multimedia and inconsistent trend for Web traffic can be explained by the increasing complexity and overall size of Web pages that include more audio, images and video elements [6]. Nowadays network operator are faced with rapidly growing of video traffic that cause a main source of congestion in their networks. In order to reduce congestion, N. Khan, on their work [7], timely video rate adaptation is required at the Radio Access Network (RAN)
Aaron et al on their works paper [8], has made a deep packet trace analysis of two wireless network environment that place separately and still parts of campus network, with total observation time was for 3 days to gathering the data traffic for total 32,278 unique device. They get the trends of handhelds usage device connected to Wireless including UDP data transactions, also HTTP protocol with high traffic volume transactions, and video traffic. Security performance in wireless LAN already shown on works [9] [10] [11] [12] [13] [14] [15], Poonam Jindal et al on works [9] presented their experiments result that have carried out comprehensively about the performance evaluation of network security in the 802.11 WLAN protocol. Ye Wen on works [16] describe the evaluation of wireless channel utilization at Guangdong Mobile in Guangdong province.
Gigih, et al, [17] on their research already investigate the performance analysis of ArubaTM Wireless Local Area Network at University of Lampung, on this paper explain that IT units had developed wireless infrastructure using Aruba Technology since March 2014, they introduce a wireless performance analysis based on airwave application, with 1 year of data report they gathered network activity on each Aruba AP such as usage average, clients average. On paper [18] [19] [20] [21] [22] describe the usage of open source application for system monitoring. On paper [23] describe it is very important to implementing High Availability (HA) on a network.
III. INTERNETACCESSMANAGEMENT NETWORK
TOPOLOGY
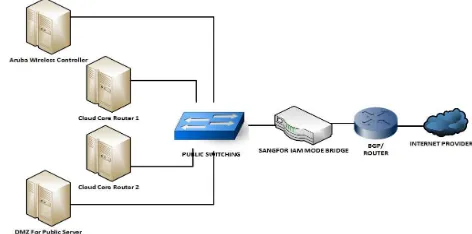
Fig.1 shown Unila’s Internet Access Management topology, on data center (DC), already installed Aruba Controller 7210 series and ClearPass System on dedicated server. Aruba Controller policy system work to manage the role of platform provides and device based network control access for Unila wireless user, and communicate with RADIUS system as Active Directory User (user profiling and also posture assessment, on boarding profile, guest access profile), and a comprehensive context-based system policy engine. ClearPass use the database user from radius server on Unila’s private cloud, radius act as SSO user database backend for other academic application.
Beside Aruba Controller, there is a DMZ server that monitored by IAM, the main purpose of our DMZ server is to provide another layer of security for Public Server behind DMZ system. If a rogue actor is able to gathering the access to services located in DMZ, they will not be able to get full access to the main part of the network. Some critical public server placed behind DMZ such Unila’s Web Server, Mail Server, Domain Name System (DNS) server, Academic Information System, etc. DMZ also has a notification that remainder of the network to be protected if a rogue actor or hacker is able to succeed in attacking any of the servers. Any Public server that is placed behind DMZ server have limited connectivity to other hosts that solely reside within the internal network.
On Fig. 1, there also 2 Cloud Core Router that act as internet router for Faculty member, this both router installed to serve whole users connected through Campus LAN cable, we split the router into 2 router to distribute the traffic load. There were Cloud Core Router 1 (CCR1) and Cloud Core Router 2 (CCR2), CCR1 is serving total 4 Faculty, and CCR2 also serve 4 Faculty. The end node of IAM implementation topology is Border Gateway Protocol (BGP), BGP communicate using the Transmission Control Protocol (TCP) and publish Unila’s network prefix (IPv4 and IPv6 prefix) and Autonomous Number (ASN) to upstream provider, besides running BGP services the device is also act as public router for all server that placed on Data Center.
Fig 1. Unila’s Internet Access Management topology.
device connected to network and take over the functionality of another equipment with less or no user intervention.
IV. INTERNETTRAFFICMEASUREMENTANALYSIS
A. Daily Internet Traffic Trend
Fig 2. Daily application Uplink flow speed trend comparison overlaid graph
Fig 2. Shown the trend of daily uplink usage that was capture on February 24, 2016, as we can see the uplink traffic will start increase during the working hours (08.00-16.00). The peak time held on 11.00 AM until 3 PM.
TABLE I. DAILY OUTBOUND APP DISTRIBUTION
Application Peak Rate Avg. Rate Total Flow Percent 1 Streaming
Media
8.35Mb/s 2.26Mb/s 23.80GB 11.18% 2 Download
Tools
5.03Mb/s 1.35Mb/s 14.22GB 6.68% 3 SSL 15.02Mb/s 3.04Mb/s 32.11GB 15.09% 4 HTTP File
Download
7.68Mb/s 2.85Mb/s 30.02GB 14.1% 5 Website
Browsing
22.10Mb/s 4.04Mb/s 42.61GB 20.02% 6 Others 39.06Mb/s 6.65Mb/s 70.08GB 32.93% 7 ALL - 20.18Mb/s 212.84GB 100%
Table I. explains the trend data of daily uplink traffic on February 24, 2016. The most consumed traffic application was streaming media, with Peak Rate 8.35 Mb/s, Average Rate 2.26 Mb/s, and total flow 23.80 GB data or equal to 11.18% from total uplink traffic.
Fig 3. Daily application Downlink flow speed trend comparison overlaid graph
Fig 3. Shown the trend of daily Downlink usage that was capture on February 24, 2016, same with uplink traffic, we can see that the downlink traffic will start increase during the working hours (08.00-16.00). The peak time held on 11.00 AM until 3 PM.
TABLE II. DAILY INBOUND APP DISTRIBUTION
Application Peak Rate Avg. Rate Total Flow Percent 1 Streaming
Media
337.38Mb/s 98.90 Mb/s 1043.04 GB 38.64% 2 Download
Tools
176.99Mb/s 55.09 Mb/s 581.04 GB 21.53% 3 SSL 141.29Mb/s 31.87 Mb/s 336.08 GB 12.45% 4 HTTP File
Download
68.63Mb/s 19.99 Mb/s 210.82 GB 7.81% 5 Website
Browsing
61.93Mb/s 15.59 Mb/s 164.46 GB 6.09% 6 Others 128.42Mb/s 34.48 Mb/s 363.66 GB 13.47% 7 ALL - 255.92 Mb/s 2699.11 GB 100%
Table II, shown the trend data of daily downlink traffic on February 24, 2016. The most consumed traffic application was streaming media, with Peak Rate 337.38 Mb/s, Average Rate 98.90 Mb/s, and total flow 1043.04 GB data or equal to 38.64% from total uplink traffic. Total flow for daily usage was 2699.11 GB. During peak time, users frequently complain feeling difficult to access the internet [24], this happen because almost 40% bandwidth flow was used for video streaming.
TABLE III. DAILY MOST POPULAR URL
Website Browsing Application Type Counts Percent 1 www.google.com Search Engines & Portals 104960 3.3% 2 *.unila.ac.id Computers & Technology 88932 2.8% 3 graph.facebook.com Social Networking 80502 2.5% 4
r3---sn-2b5njvh-jb3e.googlevideo.com
Streaming Media & Downloads
64739 2% 5
r1---sn-2b5njvh-jb3e.googlevideo.com
Streaming Media & Downloads
64098 2% 6
r2---sn-2b5njvh-jb3e.googlevideo.com
Streaming Media & Downloads
61264 1.9%
Table III, shown the daily most popular url, search engine google was the most popular url accessed by users, the other was official Unila website, facebook, and Google Global Cache (GGC).
B. Monthly Internet Traffic Trend
Fig 4. Shown the trend of monthly uplink usage that was capture since February 1, until February 29, 2016, as we can see the maximum uplink traffic was held on Monday February 1, 2016.
TABLE IV. MONTHLY OUTBOUND APP DISTRIBUTION
Application Peak Rate Avg. Rate Total Flow Percent 1 Streaming
Media
5.83Mb/s 1.76 Mb/s 538.06 GB 9.14% 2 Download
Tools
2.91Mb/s 967.07 Kb/s 288.85 GB 4.9% 3 SSL 10.25Mb/ 2.32 Mb/s 708.86 GB 12.04% 4 HTTP File
Download
4.55Mb/s 2.48 Mb/s 758.12 GB 12.87% 5 Website
Browsing
7.67Mb/s 3.62 Mb/s 1106.64 GB 18.79% 6 Others 40.62Mb/ 8.14 Mb/s 2489.39 GB 42.27% 7 ALL - 19.26 Mb/s 5889.92 GB 100%
Table IV, shown the trend data of Monthly uplink traffic since February 1 until February 29, 2016. The most consumed traffic application was streaming media, with Peak Rate 5.83 Mb/s, Average Rate 1.76 Mb/s, and total flow 538.06 GB data or equal to 9.14% from total uplink traffic. Total flow for monthly usage was 5889.92 GB.
Fig. 5. Monthly application Downlink flow speed trend comparison overlaid graph
Fig 5. Shown the trend of monthly Downlink usage that was capture since February 1, until February 29, 2016, as we can see the maximum uplink traffic was held on Thursday February 18, 2016. At this date 6-7, 13-14, 20-21, 27-28 February shown less traffic then other day, because at this date is non-working hours (Saturday and Sunday).
TABLE V. MONTHLY INBOUND APP DISTRIBUTION
Application Peak Rate Avg. Rate Total Flow Percent 1 Streaming
Media
252.36 Mb/s 77.80 Mb/s 23795.59 GB 38.98% 2 Download
Tools
104.56 Mb/s 37.56 Mb/s 11487.92 GB 18.82% 3 SSL 82.10 Mb/s 24.67 Mb/s 7546.62GB 12.36% 4 HTTP File 57.98 Mb/s 15.45 Mb/s 4724.54 GB 7.74% 5 Website 44.76 Mb/s 12.61 Mb/s 3857.59 GB 6.32% 6 Others 103.04 Mb/s 31.48 Mb/s 9629.08 GB 15.77% 7 ALL - 199.57 Mb/s 61041.35 GB 100%
Table V. shown the trend data of Monthly downlink traffic since February 1 until February 29, 2016. The most consumed traffic application was streaming media, with Peak Rate 252.36 Mb/s, Average Rate 77.80 Mb/s, and total flow 23795.59 GB data or equal to 38.98% from total uplink traffic. Total flow for monthly usage was 61041.35 GB.
Fig. 6. Most Active Device
Fig. 6. Shown pie chart of most active device/user during February 1 until February 29, 2016. The most active device was
103.46.247 (Aruba Wireless Controller) with total flow was
27044.64 GB, or 40.4% from total traffic.
TABLE VI. MONTHLY INBOUND APP DISTRIBUTION
Host IP Uplink Downlink Total Flow Percent 1 103.3.46.247 1449.17 GB 25595.48 GB 27044.64 GB 40.4% 2 103.3.46.252 1158.02 GB 16353.58 GB 17511.60 GB 26.2% 3 103.3.46.250 564.58 GB 10772.40 GB 11336.99 GB 16.9% 4 103.3.46.29 379.15 GB 13.95 GB 393.10 GB 0.6% 5 103.3.46.5 343.93 GB 30.42 GB 374.35 GB 0.6% 6 103.3.46.210 180.63 GB 103.29 GB 283.92 GB 0.4% 7 103.3.46.15 19.56 GB 200.81 GB 220.37 GB 0.3% 8 103.3.46.23 160.39 GB 16.98 GB 177.37 GB 0.3% 9 103.3.46.208 142.86 GB 9.83 GB 152.69 GB 0.2% 10 103.3.46.200 102.40 GB 8.45 GB 110.85 GB 0.2% 11 Others 1389.23 GB 7936.17GB 9325.40 GB 13.9% 12 [All Users] 5889.92 GB 61041.35 GB 66931.27 GB 100%
Table VI, shown the trend data of Monthly Inbound traffic since February 1 until February 29, 2016. The most consumed traffic device/user was Aruba Wireless Controller
(103.3.46.247) with total flow 40.45%, and 2nd was CCR1
(103.3.46.252) with 26.2%, the 3rd was CCR2 (103.3.46.250) with 16.9%, the 4th was Digital Library Server (103.3.46.29) with total traffic was 393.10 GB or 0.6%
Fig. 7. Shown pie chart of Users behavior ranking since February 1 until February 29, 2016. The most user was 103.46.247 (Aruba Wireless Controller) with total 36.5% from total.
TABLE VII. USER BEHAVIOR RANKING
Host IP Counts Percent 1 103.3.46.247 28058475 36.5% 2 103.3.46.252 16809988 21.9% 3 103.3.46.250 11938431 15.5% 4 103.3.46.5 2966146 3.9% 5 103.3.46.210 1498038 2% 6 103.3.46.208 1400041 1.8% 7 103.3.46.15 1326502 1.7% 8 103.3.46.23 403630 0.5% 9 103.3.46.21 379727 0.5% 10 103.3.46.45 162409 0.2% 11 Others 11869916 15.5% 12 [All Users] 76813303 100%
Table VII, shown the trend data of Monthly User Behavior Ranking since February 1 until February 29, 2016. The most active user/device was Aruba Wireless Controller (103.3.46.247), with total count 28058475 or 36.5 %, and total count was 76813303.
Fig. 8. Application Behavior Ranking
TABLE VIII. MOST POPULAR URLCATEGORIES
Application Type Counts Percent 1 Computers & Technology 30032328 39.1% 2 Search Engines & Portals 14214611 18.5% 3 Social Networking 8264092 10.8% 4 Streaming Media &
Downloads
6893365 9% 5 Advertisements & Pop-Ups 4292179 5.6% 6 Finance 3154604 4.1% 7 Business 1040108 1.4% 8 News 946049 1.2% 9 Web-based Email 828783 1.1% 10 Entertainment 793993 1% 11 Others 6353191 8.3% 12 Website Browsing 76813303 100%
Fig. 8 and Table VIII, shown the trend data of Monthly Most Popular URL Categories since February 1 until February 29, 2016. The most Application Type Category accessed by Unila’s users was Computers & Technology with 30032328 or
39.1%, the 2nd was Search Engines & Portals with
18.5%, the 4th was Streaming Media & Downloads with
8264092 total count. Total website browsing hit in a
month was 76813303 count.
Fig. 9. User Total Flow Peer To Peer (P2P) Ranking TABLE IX. MOST P2P ACTIVE USERS
Host IP Uplink Downlink Total Flow Percent 1 103.3.46.252 377.84GB 621.03GB 998.87GB 27.6% 2 103.3.46.247 351.40GB 608.10GB 959.50GB 26.5% 3 103.3.46.250 153.35GB 693.25GB 846.60GB 23.4% 4 103.3.46.15 5.17GB 36.90GB 42.07GB 1.2% 5 103.3.46.29 2.92MB 68.63KB 2.99MB 0% 6 103.3.46.61 1.72MB 795.09KB 2.49MB 0% 7 103.3.46.22 1.70MB 14.82KB 1.72MB 0% 8 103.3.46.45 340.01KB 10.84KB 350.85KB 0% 9 103.3.46.210 301.70KB 12.69KB 314.39KB 0% 10 103.3.46.41 235.76KB 6.36KB 242.12KB 0% 11 Others 378.41GB 391.44GB 769.85GB 21.3% 12 [All Users] 1266.18GB 2350.72GB 3616.90GB 100%
Fig. 9 and Table IX, shown the trend data of Monthly Most P2P active users since February 1 until February 29, 2016. The 1st device was CCR1 (103.3.46.252) with total flow was 998.87 GB or 27.6%, 2nd was Aruba Wireless Controller with 959.50
GB or 26.5%, and the 3rd was CCR2 (103.3.46.250) with
846.60 GB or 23.4%.
TABLE X. P2PAPPLICATION FLOW TREND OVERLAID
Application Peak Rate Avg. Rate Total Flow Percent 1 P2P 63.41Mb/ 11.83Mb/s 3616.90 GB 5.4% 2 Others 566.79Mb
/
207.00Mb/s 63314.37 GB 94.6% 3 ALL - 218.83Mb/s 66931.27 GB 100%
Fig. 10 and Table X. shown the trend data of Monthly P2P Application Flow Trend Overlaid since February 1 until February 29, 2016. From the data we can see in a month there were total 3616.90 GB P2P traffic or total 5.6 % from total Flow.
V. CONCLUSION
This study focused on Internet Traffic Measurement conducted in University of Lampung Campus Network. Overall, this study shows user (both from wireless or cable connection) behavior on the application. The trend data of Monthly Most Popular URL Categories accessed by Unila’s users was Computers & Technology with 30032328 hits or 39.1%, the 2nd was Search Engines & Portals with 14214611 hits or 18.5% hits. There were around 30-40 % of internet traffic flow was use for Streaming Media activity, it proves that the existence of Streaming Media Activity in Campus Network which contribute to network performance degradation. During a month doing internet measurement, we identify the most active device/user identified by Aruba Wireless Controller with total flow 40.45%, the 2nd was CCR1 with 26.2%, the 3rd was CCR2 with 16.9%, and the 4th was Digital Library Server with total traffic was 0.6%. Monthly uplink traffic total flow was
5889.92 GB while downlink traffic Total flow for February,
2016 was 61041.35 GB.
We made a recommendation to Unila management for pay a serious attention especially on Users Streaming Media Activity specific on access to Google Global Cache (GGC) to overcome network congestion during peak time period on working hours, we suggest to implement traffic provisioning of video streaming connections for improving the quality of campus network.
REFERENCES
[1] Claffy, K. and T. Monk, “ What's Next for Internet Data Analysis? Status and Challenges Facing the Community”. Proceedings of the IEEE, Vol.85, Issue. 10, 1997.
[2] Kushida, T. “An Empirical Study Of The Characteristics Of Internet Traffic”, Journal Computer Communication, Vol.22, Issue.17, Pp 1607-1618, 1999.
[3] Kihl, M., C. Lagerstedt, A. Aurelius, P. Odling. “Traffic Analysis And Characterization Of Internet User Behavior”. Ultra Modern Telecommunications and Control Systems and Workshops (ICUMT), 2010 International Congress, Pp 224-231, 2010.
[4] Kotz, D. and K. Essien. “Analysis of a Campus-Wide Network.Wireless Networks”, Journal Wireless Network, Vol.11, Issue 1-2, Pp 115-133, 2005.
[5] T. Henderson, D. Kotz, I. Abyzov. “The Changing Usage of a Mature Campus-Wide Wireless Network”. Proceedings of the 10th Annual International Conference on Mobile Computing and Networking, Philadelphia, PA, USA, 2004.
[6] Halepovic, E., C. Williamson, M. Ghader. “Wireless Data Traffic: A Decade of Change”. IEEE Network, Vol. 23, Issue 2, Pp 20-26, 2009. [7] N. Khan, M. G. Martini. "QoE-driven multi-user scheduling and rate
adaptation with reduced cross-layer signaling for scalable video streaming over LTE wireless systems". EURASIP Journal on Wireless Communications and Networking, 2016(1).
[8] Aaron Gember et al, "A Comparative Study of Handheld and Non-handheld Traffic in Campus Wi-Fi Networks", PAM 2011, LNCS 6579, pp. 173–183, Springer-Verlag Berlin Heidelberg, 2011.
[9] Poonam Jindal et al, "Experimental Study to Analyze the Security Performance in Wireless LANs", Journal Wireless Personal Communications, ISSN 0929-6212, 2015.
[10] Yong-lei liu et al, "SAEW: A Security Assessment and Enhancement System of Wireless Local Area Networks (WLANs)", Wireless Pers Commun (2015) 82:1–19, 2015.
[11] Jung-San Lee, Pei-Yu Lin, Chin-Chen Chang, "Lightweight Secure Roaming Mechanism Between GPRS/UMTS and Wireless LANs", Journal Wireless Personal Communications Volume 53, Issue 4 , pp 569-580, 2010.
[12] Bharat Singh, Akash Bansal, Sunil Kumar, Anshu Garg, "Analysis for Power Control and Security Architecture for Wireless Ad-Hoc Network", Third International Conference, IC3 2010, Noida, India, August 9-11, Proceedings, pp 205-216, Part II, 2010.
[13] Rajeev Singh, Teek Parval Sharma, "A Key Hiding Communication Scheme for Enhancing the Wireless LAN Security", Journal Wireless Personal Communications, Volume 77, Issue 2 , pp 1145-1165, 2014. [14] Lei Chen, Narasimha Shashidhar, Shengli Yuan, Ming Yang, "Security in
Wireless Metropolitan Area Networks", ISBN 978-3-642-36510-2, Springer Berlin Heidelberg, 2013.
[15] Alan Holt, Chi-Yu Huang, "Wireless Security", book tittle 802.11 Wireless Networks, pp 101-110, ISBN 978-1-84996-274-2, 2010. [16] Ye Wen, Chen Jian, "Applying rapid fluctuation model to analysis of
wireless channel utilization in GSM networks", Control Conference (CCC), 2010 29th Chinese, Beijing, China, 2010, pp- 4228-4235, 2010. [17] G. F. Nama, M. Komarudin, H. D. Septama, "Performance Analysis of
ArubaTM Wireless Local Area Network Lampung University", 2015
International Conference on Science in Information Technology (ICSITech), pp 41-46, Yogyakarta, Indonesia, 2015.
[18] G. F. Nama, M. Ulvan, A. Ulvan, A. M. Hanafi, "Design and Implementation of Web-Based Geographic Information System for Public Services in Bandar Lampung City - Indonesia", 2015 International Conference on Science in Information Technology (ICSITech), pp 270-275, Yogyakarta, Indonesia, 2015.
[19] D. Despa, A. Kurniawan, M. Komarudin, Mardiana, G. F. Nama, "Smart monitoring of electrical quantities based on single board computer BCM2835", 2nd International Conference on Information Technology, Computer, and Electrical Engineering, pp 315-320, Indonesia, 2015. [20] G. F. Nama, M Komarudin, Hanang. P, Mardiana, H. D. Septama,
"Electricity, Temperature, and Network Utilization Monitoring at Lampung University Data Centre Using Low Cost Low Power Single Board Mini Computer", Regional Conference On Computer Information Engineering, Indonesia, pp. 184-189, 2014.
[21] G. F. Nama, H. D. Septama, L. Hakim, M. Komarudin, "Design and Implementation of Internet Connection System Monitoring Lampung University based on Mini Single Board Computer BCM2835", Seminar National Science Technology, pp. 73-83, 2014.
[22] G. F. Nama, H. D. Septama, "Analysis the Performance of VoIP Services on Wireless LAN Network (IEEE 802.11) University of Lampung", Journal Research of Information Technology and Communications (MTI), Volume 5, Issue 1, 2014.