Surface roughness optimization in an end-milling operation
using the Taguchi design method
Julie Z. Zhang
a,∗, Joseph C. Chen
b, E. Daniel Kirby
b aDepartment of Industrial Technology, University of Northern Iowa, Iowa, USAbDepartment of Agricultural & Biosystems Engineering, Industrial Technology, Iowa State University, Iowa, USA
Received 27 January 2006; received in revised form 7 July 2006; accepted 27 September 2006
Abstract
This paper presents a study of the Taguchi design application to optimize surface quality in a CNC face milling operation. Maintaining good surface quality usually involves additional manufacturing cost or loss of productivity. The Taguchi design is an efficient and effective experimental method in which a response variable can be optimized, given various control and noise factors, using fewer resources than a factorial design. This study included feed rate, spindle speed and depth of cut as control factors, and the noise factors were the operating chamber temperature and the usage of different tool inserts in the same specification, which introduced tool condition and dimensional variability. An orthogonal array of L9(34) was used; ANOVA analyses were carried out to identify the significant factors affecting surface roughness, and the optimal cutting combination was determined by seeking the best surface roughness (response) and signal-to-noise ratio. Finally, confirmation tests verified that the Taguchi design was successful in optimizing milling parameters for surface roughness.
© 2006 Elsevier B.V. All rights reserved.
Keywords: Taguchi design; Surface roughness; Milling operations
1. Introduction
1.1. Background
As a basic machining process, milling is one of the most widely used metal removal processes in industry and milled sur-faces are largely used to mate with other parts in die, aerospace, automotive, and machinery design as well as in manufactur-ing industries[1,2]. Surface roughness is an important measure of the technological quality of a product and a factor that greatly influences manufacturing cost. The mechanism behind the formation of surface roughness is very dynamic, compli-cated, and process dependent; it is very difficult to calculate its value through theoretical analysis[3]. Therefore, machine oper-ators usually use “trial and error” approaches to set-up milling machine cutting conditions in order to achieve the desired sur-face roughness. Obviously, the “trial and error” method is not effective and efficient and the achievement of a desirable value
∗Corresponding author at: 37 ITC, Cedar Falls, IA 50613 0178, USA.
Tel.: +1 319 273 2590; fax: +1 319 273 5818.
E-mail address:[email protected](J.Z. Zhang).
is a repetitive and empirical process that can be very time con-suming. The dynamic nature and widespread usage of milling operations in practice have raised a need for seeking a systematic approach that can help to set-up milling operations in a timely manner and also to help achieve the desired surface roughness quality.
1.2. Background of Taguchi design
One method presented in this study is an experimental design process called the Taguchi design method. Taguchi design, developed by Dr. Genichi Taguchi, is a set of methodologies by which the inherent variability of materials and manufacturing processes has been taken into account at the design stage. The application of this technique had become widespread in many US and European industries after the 1980s. The beauty of Taguchi design is that multiple factors can be considered at once. Moreover, it seeks nominal design points that are insensitive to variations in production and user environments to improve the yield in manufacturing and the reliability in performance of a product[4]. Therefore, not only can controlled factors be considered, but also noise factors. Although similar to design of experiment (DOE), the Taguchi design only conducts
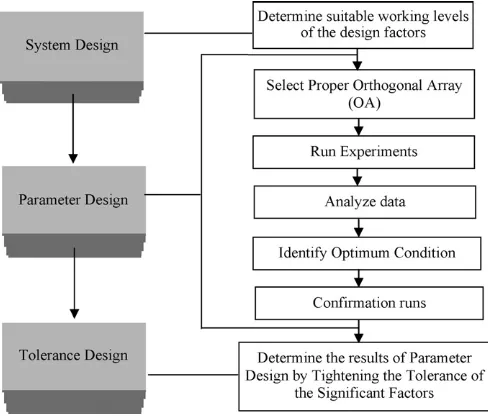
Fig. 1. Taguchi design procedure.
the balanced (orthogonal) experimental combinations, which makes the Taguchi design even more effective than a fractional factorial design. By using the Taguchi techniques, industries are able to greatly reduce product development cycle time for both design and production, therefore reducing costs and increasing profit. Moreover, Taguchi design allows looking into the variability caused by noise factors, which are usually ignored in the traditional DOE approach.
1.3. Procedure of the Taguchi design method
To better understand Taguchi design, the procedure of the Taguchi design is described inFig. 1. The complete procedure in Taguchi design method can be divided into three stages: system design, parameter design, and tolerance design (shown inFig. 1). Of the three design stages, the second stage – the parameter design – is the most important stage [5]. It has been widely applied in the US and Japan with great success for optimizing industrial/production processes. The stage of Taguchi parameter design requires that the factors affecting quality characteristics in the manufacturing process have been determined. The major goal of this stage is to identify the optimal cutting conditions that yield the lowest surface roughness value (Ra).
The steps included in the Taguchi parameter design are: selecting the proper orthogonal array (OA) according to the num-bers of controllable factors (parameters); running experiments based on the OA; analyzing data; identifying the optimum con-dition; and conducting confirmation runs with the optimal levels of all the parameters. The details regarding these steps will be described in the section of experimental design.
1.4. Application of the Taguchi parameter design in milling operations
As applying Taguchi parameter design requires the identifica-tion of factors affecting targeted quality characteristics, relevant
literature must be reviewed to screen the most important among a number of factors or conditions affecting surface roughness of milled surface. As a multi-point machining process, more potential variability makes it even harder to obtain a surface roughness model in milling operations compared with single point machining[3]. Tsai et al.[3]stated that the possible fac-tors affecting surface finish were found to be feed rate, cutting speed, depth of cut, cutter geometry, cutter runout, tool wear, and the cutter force and vibration under dynamic cutting conditions. Using Taguchi design, Fuh and Wu[6]included cutting speed, feed rate, depth of cut, tool nose radius, and flank as control factors for the creation of a statistical model to predict surface roughness for aluminum parts in end milling operations. Ghani et al.,[7]conducted a study to optimize cutting conditions for hardened steel under semi-finish and finish conditions. Apply-ing cuttApply-ing speed, feed rate, and depth as control factors, they used measured responses (i.e., surface roughness and resultant cutting force) and their calculated signal-to-noise ratio to deter-mine the optimal cutting condition. Bouzid et al.[8]did research to obtain optimal cutting parameters such as cutting speed, feed per tooth, and cutting depth for surface roughness in down face milling operations by using duplex (ferritic/austenitic) stainless steel and carbon steel compositions as samples. Also applying these three cutting parameters as control factors, Lin[9] stud-ied multiple characteristics including removed volume, surface roughness, and burr height, and in this research a weighted value was used to optimize the cutting condition for face milling oper-ations. The studies reviewed above indicated although applied in various working conditions for solving different, specific prob-lems, they all selected the three commonly applied machining parameters – feed rate, cutting speed, and depth of cut – as con-trol factors. These studies indicated that the technique of Taguchi parameter design worked well in optimizing cutting parameters to achieve the surface finish result.
Table 1
The basic Taguchi L9(34) orthogonal array
Run Control factors and levels
A B C D
cutting fluids, and related research may be conducted in the future.
2. Purpose of study
The Taguchi parameter design stage is the primary design applied in the study, and the purpose of this study is to effi-ciently determine the optimal face milling parameters to achieve the smallest surface roughness value for aluminum parts under varying conditions. The questions that this study will address include the following:
• What are the relationships between the controllable factors (in the study: spindle speed, feed rate, and depth of cut) and the response factor (surface roughness)?
• How do the noise factors (temperature and tool wear) affect the response factor?
• What are the optimal conditions of the milling parameters for surface roughness?
• What are the optimal conditions for the two noise factors?
3. Experimental design
3.1. Orthogonal array and experimental factors
Following the procedure described inFig. 1, the first step in the Taguchi method is to select a proper orthogonal array. The standardized Taguchi-based experimental design, a L9(34) orthogonal array described in Peace[4], was used in this study and is shown inTable 1. This basic design makes use of up to four control factors, with three levels each. A total of nine experimental runs must be conducted, using the combination of levels for each control factor (A–D)
as indicated inTable 1. The addition of noise factors is optional, and requires that each run should be conducted once for each combination of noise factors. However, this study did not use all the array cells for four factors, because only three factors were considered (spindle speed, feed rate, and depth of cut). Therefore, the last column (for the fourth factor) in the L9(34) orthogonal array is left empty for this specific study.
The selected parameters, as discussed in the introduction, are listed inTable 2
along with their applicable codes and values for use in the Taguchi parameter design study. The control and noise factors are independent variables, and the response variable is the dependent variable.
The control factors are the basic controlled parameters used in a milling oper-ation. The spindle speeds and depth of cut were selected from within the range of parameters for finishing and semi-finishing milling of aluminum. The feed rates were slightly lower than normally used for milling aluminum workpieces, in consideration of safety concerns.
The noise factors listed inTable 2are variables often uncontrolled in machine shops, which may affect the surface roughness of a milling operation mentioned earlier. The temperature ranges included both a normal (65–75◦F/18.3–23.9◦C)
and a high (95–100◦F/35–37.8◦C) shop temperature range. The normal range
includes a range of common temperatures based on what heating and air con-ditioning systems are usually set for, or normal room temperature. The high temperature range is what a machine shop without air conditioning in some areas would expect during the summer. The second noise factor is the use of either good inserts or inserts with light tool wear, which introduces a variable common to all machine shops. The light tool wear on the inserts was created by lightly grinding the cutting edge with a small abrasive grinder. The light tool wear here means no crater wear on the insert surfaces, some friction marks indicating slight flank wear.
A modified orthogonal array inTable 3was created using the basic Taguchi orthogonal array and the selected parameters fromTable 2. In this array, the basic array with the control factors are shown as the inner control factor array, and the added noise factors are shown in the outer noise array. Since all nine cutting conditions specified in the array come with four combinations of noise factors (normal temperature with no tool wear, normal temperature with light tool wear, high temperature with no tool wear, and high temperature with light tool wear), it brings the total number of runs to 36 for the experiment.
3.2. Experimental set-up and procedure
After the orthogonal array has been selected, the second step in Taguchi parameter design (seeFig. 1) is running the experiment. This experiment was conducted using the hardware listed as follows:
• CNC Mill: Fadal VMC-40 vertical machining center.
• Surface roughness measurement device: Federal Pocketsurf Stylus Profilome-ter (measuresRainin.; stylus travel 0.1 in./2.54 mm).
• Space heater: 1500 W Honeywell Quick Heat Ceramic Heater (small forced-air space heater with thermostat with thermal protection devices for safety). • Thermometer: Taylor digital thermometer #1420 (digital thermometer with
probe, range includes 50–120◦F/10–48.9◦C) (Taylor Instruments).
• Cutting tool inserts: APKT 160408R coated carbide inserts (Ingersoll Cutting Tools).
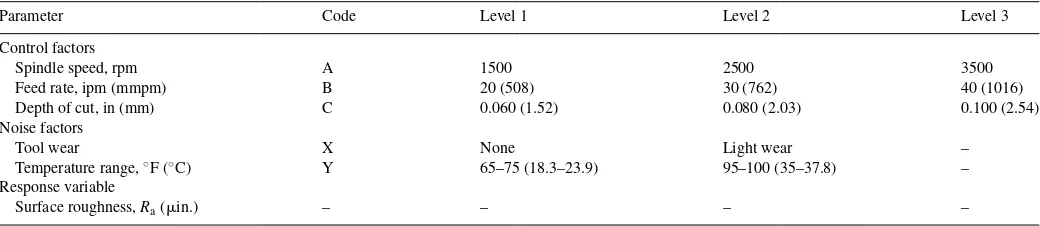
Table 2
Parameters, codes, and level values used for orthogonal array
Parameter Code Level 1 Level 2 Level 3
Control factors
Spindle speed, rpm A 1500 2500 3500
Feed rate, ipm (mmpm) B 20 (508) 30 (762) 40 (1016)
Depth of cut, in (mm) C 0.060 (1.52) 0.080 (2.03) 0.100 (2.54)
Noise factors
Tool wear X None Light wear –
Temperature range,◦F (◦C) Y 65–75 (18.3–23.9) 95–100 (35–37.8) –
Response variable
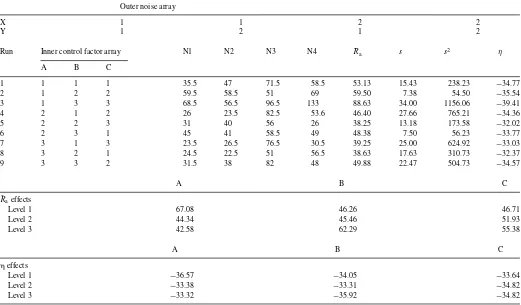
Table 3
Completed orthogonal array
Outer noise array
X 1 1 2 2
Y 1 2 1 2
Run Inner control factor array N1 N2 N3 N4 R¯a s s2 η
A B C
1 1 1 1 35.5 47 71.5 58.5 53.13 15.43 238.23 −34.77
2 1 2 2 59.5 58.5 51 69 59.50 7.38 54.50 −35.54
3 1 3 3 68.5 56.5 96.5 133 88.63 34.00 1156.06 −39.41
4 2 1 2 26 23.5 82.5 53.6 46.40 27.66 765.21 −34.36
5 2 2 3 31 40 56 26 38.25 13.18 173.58 −32.02
6 2 3 1 45 41 58.5 49 48.38 7.50 56.23 −33.77
7 3 1 3 23.5 26.5 76.5 30.5 39.25 25.00 624.92 −33.03
8 3 2 1 24.5 22.5 51 56.5 38.63 17.63 310.73 −32.37
9 3 3 2 31.5 38 82 48 49.88 22.47 504.73 −34.57
A B C
¯
Raeffects
Level 1 67.08 46.26 46.71
Level 2 44.34 45.46 51.93
Level 3 42.58 62.29 55.38
A B C
effects
Level 1 −36.57 −34.05 −33.64
Level 2 −33.38 −33.31 −34.82
Level 3 −33.32 −35.92 −34.82
• Tool holder: Fadal VNE90-1250C 3-insert mill with 1.25 in. (31.75 mm) cut diameter (for above inserts).
• Surface table: polished granite surface for more stable and accurate surface roughness measurements.
• Microsoft Excel and JMP software packages for charting data and statistical analysis.
The 36 experiments were cut in a random sequence to better eliminate any other invisible factors that might also contribute to the surface roughness. The high temperature was created through heating up the air inside the machine chamber by the heater to the defined temperature and maintaining the tempera-ture 5 min. The light tool wear on the inserts was created by lightly grinding the cutting edge with a small abrasive grinder. It is hard to control the degree of tool wear when grinding the inserts. A microscope was used to observe and measure the flank wears on the inserts to control the wear situation of the three inserts as similar as possible. Because the difficulty still existed due to the researchers’ inability to reproduce the exactly same tool wear situation, tool wear was con-sidered a noise factor in this study. A simple NC program was written with different cutting conditions specified to have the Fadal machine face mill the top surface of 3/4×1 1/2×3 in. (19.1×38.1×76.2 mm) aluminum blocks. After each cut, the surface roughness was measured on the surface table with the stylus profilometer. Three fixed spots on each milled surface, one in the middle and the other two on the edge, were used to measure the surface roughness of the cut, and the mean of the three readings was recorded in the orthogonal array. A diagram of measurement points were shown inFig. 2.
4. Results and analysis
The procedures after the experimental runs are analyzing data and identifying the optimal levels for all the control factors (seeFig. 1). The results of the surface roughness measurements and their average value (in. ¯Ra) of each sample are shown in
Table 3, along with the additional parameters of the expanded orthogonal array. The individual surface roughness measure-ments are noted as N1–N4 for each run in the array. A final column has been added to this array, to indicate the signal-to-noise (S/N) ratio, which is calculated as follows:
η= −10 log 1
n(
y2i)
(1)
whereηis the S/N ratio, yi the individual surface roughness measurements in columns N1–N4,n the number of combined noise factors; in this case,n= 4.
Also added to this array are the standard deviation (s), variance (s2), and the mean ( ¯Ra) of the surface roughness mea-surements, which are used to verify the performance of the calculated S/N ratio. This type of experiment, in which a smaller response variable is desirable, should produce S/N ratios that increase as the variance and means decrease.
Table 4
T-test for effect on surface roughness of alternating between two sets of inserts with different wear
A visual examination found that the noise factors may affect surface roughness because of the rather large standard deviations across each row of the experimental runs. The changing trend of surface roughness brought by different inserts sets with and without tool wear (coded as outer noise array factor X1 and X2) is consistent from experimental run #1 through #9. No matter in what cutting parameter condition, the samples cut by the inserts with wear always result in larger surface roughness values. On the other hand, no such a consistent trend was found among the samples collected by varying machine chamber temperature, which is coded as outer noise array factor Y1 and Y2. In order to present a more rigorous analysis, two comparisont-tests were made to see if the differences associated with the two noise factors were significant.
Thet-test for the effect of tool wear on surface roughness in Table 4 shows that tool wear, as would be expected, has significantly reduced the quality of the milled surface from the mean surface roughness of 38.8in. (0.99m) to 63.9 (in. 1.62m) (p< .001). As shown in Table 5, the differ-ence between surface roughness in high temperature (mean 48.8in./1.24m) compared to the one in normal temperature (mean 53.9in./1.37m) was not significant (p> .05). There-fore, it cannot be concluded from this experiment that the temperature significantly affects the quality of the finished sur-face. In this study, only 5 min was maintained for keeping the high temperature, and more time may need to be maintained for future study to investigate the impact of environmental temper-ature.
A non-formal examination of the effects introduced by the control factors found that the mean surface roughness reduced greatly when feed rate was set from level 3 to level 2, how-ever, the surface roughness almost did not change when feed
Table 5
T-test for effect on surface roughness of normal (70±5◦F) and high (95–100◦F)
room temperature
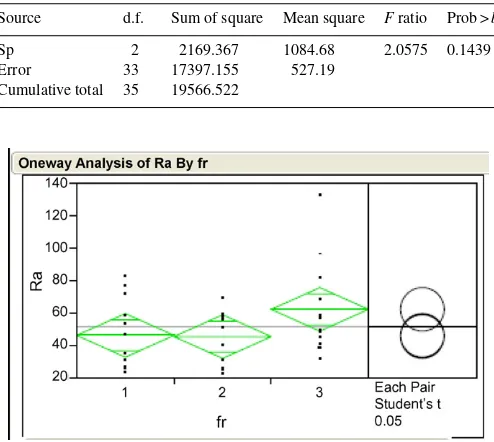
ANOVA analysis for the effect of feed rate on surface finish
Source d.f. Sum of square Mean square Fratio Prob >b
Sp 2 2169.367 1084.68 2.0575 0.1439
Error 33 17397.155 527.19
Cumulative total 35 19566.522
Fig. 3. Pair means comparisons for feed rate.
rate was set from level 1 to level 2. The ANOVA analysis illus-trated inTable 6and pair means comparisons inFig. 3for feed rate shows that surface roughness difference caused by varying feed rate was not significant as the other studies found [12]. This would seem to imply that the noise factors could possibly add uncertain interactions by varying the tool wear factor. A complete study including the interaction effects among factors would open another research agenda with more experimental runs. But this is beyond the scope of the current research set-up and research purpose.
As for the effect of spindle speed and depth of cut on surface roughness, there is not a completely consistent conclusion in previous studies. For example, Ghani et al.[6]found that high cutting speed and low depth of cut in addition to the main fac-tor of low feed rate would improve surface finish for machining hardened steel (AISI H13) with a TiN coated P10 carbide insert. Bouzid et al.[7]found a high value of cutting speed used with a small value of feed rate would improve the roughness of the machined Duplex stainless steel surface. They also found that an optimal value of depth of cut was more dependent on the mate-rial characteristics and the machine dynamics. For this study, the ANOVA analysis shown inTable 7and pair means compar-isons inFig. 4for spindle speed shows that spindle speed was a significant factor affecting surface roughness, and the setting of spindle speed at 3500 rpm produced the smallest surface rough-ness value. The pair means comparison inFig. 5for depth of cut
Table 7
ANOVA analysis for the effect of spindle speed on surface finish
Source d.f. Sum of square Mean square Fratio Prob >b
Sp 2 4466.367 2233.18 4.8804 0.0139
Error 33 15100.155 457.58
Fig. 4. Pair means comparisons for spindle levels.
Fig. 5. Pair means comparisons for depth levels.
clearly shows that depth of cut was not a significant factor in this study; however, the milling operations at low depth of cut consis-tently provided a low surface roughness during this study. The surface roughness changing trend revealed in the experimen-tal data provides a direction to determine the optimum cutting condition.
5. Determination of the optimum cutting condition
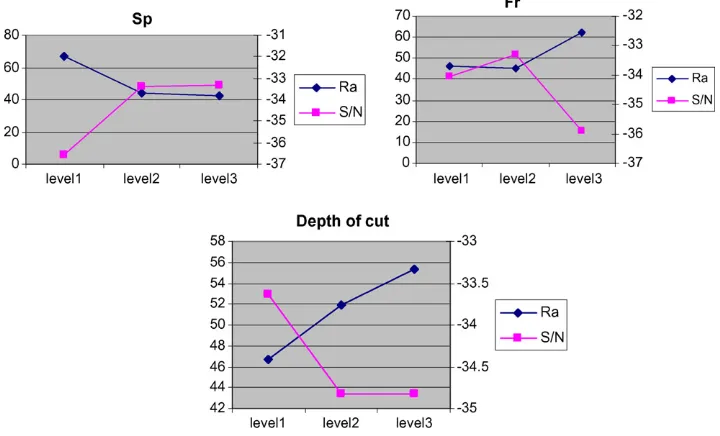
The (mean response variable) effect table under the array in Table 3indicates the mean of the response variable means for each level of each control factor. This specifies the mean surface roughness value that each level of each control factor produced during this experiment. The S/N ratio effect table under the array inTable 3indicates the mean of the S/N ratio values for each level of each control factor.Fig. 6shows the surface roughness (Ra) and S/N ratio effects fromTable 3.
In this study, it is the-smaller-the-better case, which means the smallest surface roughness would be the ideal situation. Also the largest S/N ratio, reflecting the best response given the noise in the machine set-up system, would be the ideal situation. This is the criteria employed in this study to determine the optimal cutting condition.
By following the criteria of smaller surface roughness and larger S/N ratio, the graphs in Fig. 6 was used to determine the optimal set of parameters from this experimental design. The control factor of spindle speed (A) at level 3 (3500 rpm) provided the best result. Similarly, the control factor of feed rate (B) at level 2 (30 ipm) provided the best result. Although depth of cut (C) was not a significant factor impacting surface roughness result, of the three set-up conditions, depth of cut at level 1 provided the lowest surface roughness and highest S/N ratio. Therefore depth of cut at level 1 (0.06 in./1.52 mm) was selected for the optimal cutting condition. The criteria of the lowest response and highest S/N ratio were followed and there are no conflicts in this study in determining the optimal spin-dle speed, feed rate, and depth of cut. Therefore, the optimized combination of levels for the three control factors from the anal-ysis so far was A3-B2-C1. In addition, this study supports the contention that the insert without wear (X1) will generate a bet-ter surface finish. The statistical analysis indicated that there was no significant difference when temperature was set as nor-mal or high level, thus, temperature set-up would not matter in
Table 8
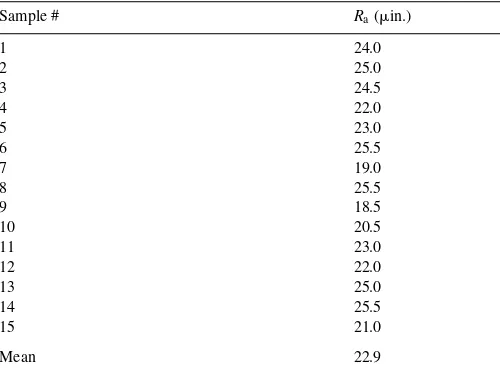
The results of the confirmation run
Sample # Ra(in.)
the confirmation run. For the researchers’ convenience, in the confirmation run temperature was set-up as normal temperature (Y1). The optimized levels of the three parameters A3-B2-C1 (X1, Y1) were included in the confirmation run.
6. Confirmation run
After the optimal levels of all the control factors were identi-fied, the last step in Taguchi parameter design is conducting the confirmation run (seeFig. 1). The combination of the optimal levels of all the factors should produce the optimal magnitude of surface roughness (the smallestRa). This conclusion must be further supported through the confirmation runs. Fifteen samples were cut under the optimal parameter set-up in the study for the purpose of confirmation run. The optimal levels for the control-lable factors were spindle speed 3500 rpm, feed rate 30 in./min (762 mm/min), depth of cut 0.06 in (1.52 mm). In terms of the experimental result, the optimal levels for the noise factors in confirmation run were no tool wear condition and normal tem-perature range.Table 8shows the results of the confirmation run. Compared with the experiment results in Table 3, the mean surface roughness of the 15 confirmation samples 22.9in. (0.58m), which was very close to the smallest value (23.5in./0.60m) of surface roughness inTable 3. Therefore, the confirmation run indicated that the selection of the optimal levels for all the parameters produced the best surface roughness.
7. Conclusions
In this study the optimal cutting condition for face milling was selected by varying cutting parameters through the Taguchi
parameter design method. With the L9(34) orthogonal array, a total of 36 experimental runs, covering three main factors each at three levels and two noise factors each at two levels, indi-cated that the Taguchi parameter design was an efficient way of determining the optimal cutting parameters for surface finish. The experimental results indicate that in this study the effects of spindle speed and feed rate on surface were larger than depth of cut for milling operation. In addition, one of the noise factors, tool wear, was found to be statistically significant. The surface finish achievement of the confirmation runs under the optimal cutting parameters indicated that of the parameter settings used in this study, those identified as optimal through Taguchi param-eter design were able to produce the best surface roughness in this milling operation. This was accomplished with a relatively small number of experimental runs, given the number of control and noise factors, suggesting that Taguchi parameter design is an efficient and effective method for optimizing surface roughness in a milling operation.
References
[1] T.S. Lee, Y.J. Lin, A 3D predictive cutting force model for end milling of parts having sculptured surfaces, Int. J. Adv. Manuf. Tech. 16 (2000) 773–783.
[2] Y. Altintas, Direct adaptive control of end milling process, Int. J. Mach. Tool Manuf. 34 (4) (1994) 461–472.
[3] Y.H. Tsai, J.C. Chen, S.J. Lou, In-process surface recognition system based on neural networks in end milling cutting operations, Int. J. Mach. Tool Manuf. 39 (4) (1999) 583–605.
[4] G.S. Peace, Taguchi Methods, A Hands-on Approach, Addision-Wesley, MA, 1992.
[5] G. Taguchi, M. El Sayed, C. Hsaing, Quality Engineering and Quality Systems, McGraw-Hill, NY, 1989.
[6] K.H. Fuh, C.F. Wu, A proposed statistical model for surface quality pre-diction in end-milling of Al alloy, Int. J. Mach. Tool Manuf. 35 (8) (1995) 1187–1200.
[7] J.A. Ghani, I.A. Choudhury, H.H. Hassan, Application of Taguchi method in the optimization of end milling, J. Mater. Process. Tech. 145 (1) (2004) 84–92.
[8] W. Bouzid, A. Zghal, L. Sai, Taguchi method for design optimiza-tion of milled surface roughness, Mater. Technol. 19 (3) (2004) 159– 162.
[9] T.R. Lin, Optimization technique for face milling stainless steel with mul-tiple performance characteristics, Int. J. Adv. Manuf. Tech. 19 (5) (2002) 330–335.
[10] F. Ismail, M.A. Elbestawi, R. Du, K. Urbasik, Generation of milled surfaces including tool dynamics and wear, J. Eng. Ind. T. ASME 115 (3) (1993) 245–252.
[11] Y. Huang, S.Y. Liang, Cutting forces modeling considering the effect of tool thermal property—application to CBN hard turning, Int. J. Mach. Tool Manuf. 43 (2003) 307–315.