An experimental study on the in
fl
uence of water stagnation and
temperature change on water quality in a full-scale domestic drinking
water system
Lj. Zlatanovi
c
a,*, J.P. van der Hoek
a,b, J.H.G. Vreeburg
c,d aDelft University of Technology, Department of Water Management, Delft, The Netherlands bWaternet, Strategic Centre, Amsterdam, The NetherlandscWageningen University, Sub- Department of Environmental Technology, Wageningen, The Netherlands dKWR Watercycle Research Institute, Nieuwegein, The Netherlands
a r t i c l e
i n f o
Article history:
Received 5 December 2016 Received in revised form 2 July 2017
Accepted 9 July 2017 Available online 10 July 2017
Keywords:
Drinking water Water quality Water temperature Water stagnation
a b s t r a c t
The drinking water quality changes during the transport through distribution systems. Domestic drinking water systems (DDWSs), which include the plumbing between the water meter and consumer's taps, are the most critical points in which water quality may be affected. In distribution networks, the drinking water temperature and water residence time are regarded as indicators of the drinking water quality. This paper describes an experimental research on the influence of stagnation time and tem-perature change on drinking water quality in a full-scale DDWS. Two sets of stagnation experiments, during winter and summer months, with various stagnation intervals (up to 168 h of stagnation) were carried out. Water and biofilms were sampled at two different taps, a kitchen and a shower tap. Results from this study indicate that temperature and water stagnation affect both chemical and microbial quality in DDWSs, whereas microbial parameters in stagnant water appear to be driven by the tem-perature of fresh water. Biofilm formed in the shower pipe contained more total and intact cells than the kitchen pipe biofilm.Alphaproteobacteriawere found to dominate in the shower biofilm (78% of all Proteobacteria), while in the kitchen tap biofilmAlphaproteobacteria, Betaproteobacteriaand Gammap-roteobacteriawere evenly distributed.
©2017 The Authors. Published by Elsevier Ltd. This is an open access article under the CC BY-NC-ND
license (http://creativecommons.org/licenses/by-nc-nd/4.0/).
1. Introduction
The Dutch drinking water industry places the highest priorities in supplying adequate quantities of safe drinking water to its con-sumers. The so-called“Dutch secret”includes the following steps: 1) employing the best sources available; 2) applying the most efficient and state-of-the-art treatment technologies; 3) preventing re-contamination during distribution, by keeping the leakage rate low (<3%) and avoiding very low or negative pressures; 4) pre-venting re-growth of microorganisms, by production of biologically stable water (i.e. nutrient limited) and application of biostable materials (Van der Kooij, 2000); 5) optimization and maintenance of distribution networks (self-cleaning networks and regular
flushing of networks) (Vreeburg and Boxall, 2007); 6) statuary monitoring of produced and delivered drinking water. All these approaches have resulted in a low average frequency of in-terruptions affecting customers (on average 7.5 min per connection per year), 99.9% of samples that are in compliance with the Dutch drinking water standards (ILT, 2015) and a high level of consumer trust and satisfaction with regards to the drinking water quality, where over 95% of the Dutch population consumes water from the tap (de Moel et al., 2006; Smeets et al., 2009). However, given the complexity of processes occurring during the water transport through distribution systems, the quality of drinking water may deteriorate, leading to hygienic (growth of pathogens and oppor-tunistic pathogens), aesthetic (taste and odour) and operational problems (corrosion and discoloration) (Berry et al., 2006; Moerman et al., 2014; Van der Kooij, 2000; Van der Kooij and van der Wielen, 2013, Vreeburg and Boxall, 2007).
The domestic drinking water system (DDWS), being a portion of the distribution system that includes the plumbing between the *Corresponding author.
E-mail addresses: [email protected] (Lj. Zlatanovic), j.p.vanderhoek@ tudelft.nl, [email protected](J.P. van der Hoek),jan.vreeburg@ wur.nl,[email protected](J.H.G. Vreeburg).
Contents lists available atScienceDirect
Water Research
j o u r n a l h o m e p a g e :w w w . e l s e v i e r . c o m / l o c a t e / w a t r e s
http://dx.doi.org/10.1016/j.watres.2017.07.019
water meter and consumers’taps, is thefinal stage in a drinking water supply system. DDWSs are characterized by long sections of small-diameter piping. For example, a study in Columbia showed that DDWSs and service pipes had ~80% of the total pipe length and ~25% of the overall surface area, and contained ~1.5% of the total volume in the whole water distribution system (Brazos et al., 1985). This high surface area to volume ratio may lead to increased chemical leaching from pipe materials, enhanced biofilm forma-tion, and greater decay rates of the disinfectant residual (Brazos et al., 1985; Rossman et al., 1994). The Netherlands is one of the few countries where drinking water is distributed without a re-sidual disinfectant and, as stated before, prevention of microbial growth in drinking water distribution systems is accomplished by the production of biologically stable water, with low concentrations of assimilable organic carbon (AOC<10
m
g/L). However, despite the low concentrations of organic carbon that can be utilized by mi-croorganisms, microbial growth may happen both in distribution networks and DDWSs. In addition to this, a recent study showed that opportunistic pathogens were more frequently found in the samples from DDWSs than in the samples from the distribution networks in The Netherlands (Van der Kooij and van der Wielen, 2013), which proves the importance of DDWSs in the entire pro-cess of safe drinking water supply.The drinking water temperature is an important factor to consider when assessing water quality, as it is known to affect chemical and microbiological processes within the distribution phase (Boulay and Edwards, 2001; LeChevallier et al., 1996a; 1996b; Li and Sun, 2001; Sarver, 2010; Singh and Mavinic, 1991; Uhl and Schaule, 2004; Van der Kooij, 2003). In the Netherlands, the tem-perature of drinking water in distribution networks varies from a few degrees Celsius in the winter to about 20C in summer months (Van der Kooij and van der Wielen, 2013). Once the drinking water is delivered to a DDWS, thermal equilibrium between stagnant water and surrounding air/walls takes place. For instance, as indi-cated by a temperature model (Moerman et al., 2014; Zlatanovic et al., 2017) and as confirmed by measurements in the present study, the rate at which the drinking water is being warmed up to the room temperature is ~0.1C per minute. According to existing standards for thermal environmental conditions for human occu-pancies, the operative room temperatures should be 20e23.5C in
winter and 23e26C in summer (ANSI-ASHRAE, 1992). If those
guidelines are followed, the difference between water temperature
in cold water installations and water temperature in distribution networks could even be about 20C during winter seasons, which may result in an increase in biological activity in DDWSs (Van der Kooij, 2003).
Long residence times which may vary from 2 to 30 days depending on the population size, is known to promote microbial growth in water distribution networks (Bartram, 2003). When it comes to DDWSs, water can further stagnate in pipes for hours, days or even weeks before being consumed. Only a limited number of studies investigated the influence of stagnation on water quality in experimental and real DDWSs (Lautenschlager et al., 2010; Lehtola et al., 2007; Lipphaus et al., 2014; Prest et al., 2013; Zhang et al., 2015). Lehtola et al. (2007)covered the impact of various stagnation intervals (40 mine16 h) on water quality in two
experimental rigs, one made of copper and the other made of plastic (polyethylene) pipes. In both rigs, water stagnation (with an average temperature of fresh water of 13.9C) resulted in an in-crease in the total cell concentrations (TCC) and heterotrophic plate count bacteria (HPC).Lautenschlager et al. (2010)andPrest et al. (2013) studied the impact of overnight stagnation on microbial quality of unchlorinated water, sampled at different household taps in Dübendorf, Switzerland. Both studies found out that the over-night stagnation induces microbial growth in DDWSs, while Lautenschlager et al. (2010)also observed a change in microbial community composition after the overnight stagnation. Looking at the temperature of fresh water in the studies,Lautenschlager et al. (2010) included the information on fresh water temperature (average 9.1C), whilePrest et al. (2013)did not report the ranges of fresh water temperatures.Lipphaus et al. (2014)andZhang et al. (2015)also reported that water stagnation leads to increased cell concentrations and higher bacterial community metabolic activity in chlorinated water during winter months. Apart from the fact that sampling campaigns were carried out in winter months, all listed studies did not enclose information on materials of the DDWSs from which the stagnant water samples were taken. Hence, the overall conclusion that overnight stagnation results in induced microbial activity and increased microbial concentrations might not be applicable to drinking water with higher temperatures (during warmer periods) and to all plumbing materials.
Even though the water temperature and water residence time are regarded as water quality indicators in distribution networks, little is known about their joint influence on the water quality in DDWSs. To assess the impact of the stagnation time (i.e. up to 168 h of stagnation) and temperature effect on chemical and microbial quality in more detail, two sets of stagnation experiments (winter and summer) were carried out in a full-scale copper DDWS.
To study the influence of fresh water temperature on microbial activity in the stagnant water, long-term experiments with the stagnation time of 10 h (overnight stagnation) were performed over a study period of eight months. The main aim of this research was to assess the extent to which the two“surrogate”indicators for water quality (temperature and stagnation) contributes to the alteration of the drinking water quality in DDWSs.
2. Materials and methods
2.1. Description of the experimental rig
To examine the influence of stagnation time and temperature effect on water quality at tapping points in a DDWS, a full-scale DDWS was built using copper pipes (Supplemental Fig. S1).
The design of the experimental plumbing rig was done ac-cording to a plan of a two storey house (Typical Dutch House). In-side a Typical Dutch House, there are three locations where plumbing pipes go: kitchen, bathrooms/toilets, and laundry/water
heater room, with in total 11 plumbingfixtures. On thefirstfloor of the house, a kitchen (with hot-cold taps and a dishwasher) and a guest toilet (with a toilet bowl and a washbasin) are located. On the secondfloor, a family bathroom (with a toilet bowl, shower and a sink) is placed, while at the thirdfloor, a washing machine and a hot water boiler are present.
The configuration of the experimental rig complies with the Dutch home plumbing codes NEN 1006 (NEN1006, 2002). The DDWS, which was used for stagnation experiments, consists of 2 vertical lines and 4 horizontal branches of copper (manufactured in accordance with European Standard EN 1057), namely vertical copper pipe of 22 mm diameter - carrying cold water to the upper
floors, vertical copper pipe of 15 mm (ID) - delivering hot water from a 50 L water heater and copper pipes of 15 mm - supplying cold and hot water from the vertical lines to the 11 plumbingfi x-tures (solenoid valves), as given inSupplemental Fig. S2. The total length of the pipes is 48.6 m and the volume of the plumbing rig is 6 L.
To mimic a realistic drinking water consumption at the house-hold level, the test rig comprises 11 solenoid valves (point of use) per system. The valves were configured to run automatically (on and off mode) according to the one-year demand patterns (time step of 10 s) generated by SIMDEUM model (SIMulation of water
Demand, an End-Use Model). SIMDEUM model is a stochastic model that is grounded on statistical information of water appli-ances and water consumers (Blokker et al. 2006, 2010). In this research, the SIMDEUM demand patterns of a two-person house-hold were used.
Results from a study that was done in Finland (Lehtola et al., 2004) revealed that copper had an effect on heterotrophic plate counts (HPC) and biofilm composition only in thefirst 200 days, and thus in this research, a stabilization period of 210 days was considered before the experimental start-up. During the stabiliza-tion period, every tap in the experimental rig wasflushed twice a day for 5 min at least four times a week.
2.2. Stagnation experiments
Winter and summer stagnation experiments were one time experiments, in which water was allowed to stagnate in the test rig for 40 min, 4 h, 10 h, 24 h, 48 h, 96 h and 168 h. Before each stagnation interval, water was flushed through the system by opening the solenoid valves for 5 min, at aflow rate between 20 and 30 L/min. Afterflushing the pipes, samples of fresh water were collected at the inlet point, cold kitchen and cold shower taps.
The quality of water at the shower tap was measured because the shower tap is less frequently used than the kitchen tap (ac-cording to the stochastic demand patterns that were applied to run the system). Moreover, in the Netherlands, the quality of water at every tap in a house must comply with the drinking water stan-dards (StateJournal, 2011). The water at the inlet point was sampled to assess the difference, if any, in fresh water quality between the inlet point and the points of use in the DDWSs.
After collecting fresh water samples, water was allowed to stagnate in the plumbing rig for 40 min, 4 h, 10 h, 24 h, 48 h, 96 hand 168 h. After every stagnation interval, water samples (i.e. stagnant water) were taken at two sampling taps: kitchen tap and shower tap. To examine the influence of different stagnation times on water quality parameters, the entire volume of stagnant water was collected (1.05 L for the kitchen tap and 0.7 L for the shower tap). Stagnant water samples were collected into a sterile bottle and then transferred into sampling cups for further analysis. Samples were stored on ice in a cooler for maximum 12 h until analysis at Het Waterlaboratorium in Haarlem, The Netherlands.
To examine the influence of fresh water temperature on the
quality of the drinking water that is left for the overnight stagnation of 10 h, long-term experiments were carried out, using the previ-ously described approach. Sampling campaigns for fresh and 10 h stagnant water were done every two weeks, for the study period of 8 months.
2.3. Water and biofilm analysis
After eight months of the stagnation experiments, the system was run for additional six months (total 430 days after the exper-imental start-up). After that period kitchen and shower pipes (3 times 20 cm long pipe specimens) were cut from the experimental rig. The pipe specimens werefilled with sterilized water and were closed by autoclaved silicone rubber stoppers and were sealed with ethanol swabbed parafilm. Biofilms were detached by three consequent cycles of low energy ultrasonic treatments, with 2 min per ultrasonication cycle, before further analysis (Magic-Knezev and van der Kooij, 2004). The biofilm results were normalized with respect to the surface area of the pipes (cm2) and measured volumes (mL).
After acidification with hydrochloric acid, the concentrations of copper and zinc in fresh and stagnant water were determined by Inductively Coupled Plasma mass spectrometry (ICP-MS) in tripli-cates. The detection limit of this method was 0.1
m
g/L. The standard deviation (SD) of the measurements was less than 2.5% for copper and less than 2.8% for zinc.The content of total organic carbon (TOC) in water samples was determined in duplicates based on the combustion catalytic oxidation/NDIR method (TOC-V CPH, Shimadzu, Duisburg, Ger-many), based to the Dutch standard procedure NEN-EN-1484 (NEN, 1997), with the detection limit of 10
m
g/L. The SD of the TOC measurements was less than 2%.The number of culturable bacteria in water and biofilm samples was determined by the HPC method which was performed following the Dutch guidelines for drinking water NEN-EN-ISO 6222 (NEN, 1999). The SD of HPC triplicate measurements was less than 5%.
The process of staining for total (TCC) and intact (ICC) cell counts andflow cytometry (FCM) measurements were done in triplicates for water and biofilm samples according to the protocol which was identified previously (Hammes et al., 2008, 2011; Nakamoto et al., 2014; Vital et al., 2012). Two subgroups of bacteria can be distin-guished by the FCM method, such as bacteria with low nucleic acid content (LNA) and bacteria with high nucleic acid (HNA). The distinction between these two subgroups is based on thefl uores-cent intensity and sideward scatter signals, which indicate the actual nucleic content and cell size, respectively (Hammes and Egli, 2010; Wang et al., 2010). The standard deviation of the FCM mea-surements was less than 4%.
Total adenosine triphosphate (ATP) concentration in water and biofilm samples was measured in triplicates by employing the re-agent kit for bacterial ATP (Celsis; Brussels, Belgium) and a luminometer (Celsis Advance™, Celsis, Netherlands) according to the protocol described in a study (Magic-Knezev and van der Kooij, 2004). The standard deviation of the ATP triplicate measurements was less than 4%.
The cultivation-independent investigation of microbial diversity and richness of water and biofilm was done by next generation sequencing at KWR in Nieuwegein, The Netherlands. Collected samples (250 mL of fresh water samples and 30e45 mL of
Paired-end sequences were generated on the Illumina MiSeq sys-tem using the 2300 cycles protocol and paired-end sequences were merged, using FLASH (Magoc and Salzberg, 2011) and all subsequent analyses were performed using the version 7.5 of the Bionumerics software (Applied Maths, Sint-Martens-Latem, Belgium). Quality filtering was based on PHRED scores by excluding sequence reads with a minimal score of 20 and excluding reads with an average quality below 30. Thefinal sequences were identified against the Silva taxonomic database (Pruesse et al., 2007; Yilmaz et al., 2014).
2.4. Statistical analysis
Statistical analysis was carried out to determine if the measured data sets (copper, zinc, HPC, TCC and ATP values) from fresh water at three different taps (inlet, kitchen and shower) were significantly different. The data that were found to be normally distributed were tested by thet-test, while in the case of the non-normal distributed nonparametric tests (Kruskal-Wallis tests) were performed. The statistical analysis was done using the Minitab 17 statistical soft-ware. In this study, differences were considered to be significant if the p-value was less than 0.05. Data were plotted according to the box plot methodology (Tukey, 1977).
3. Results
3.1. Fresh water
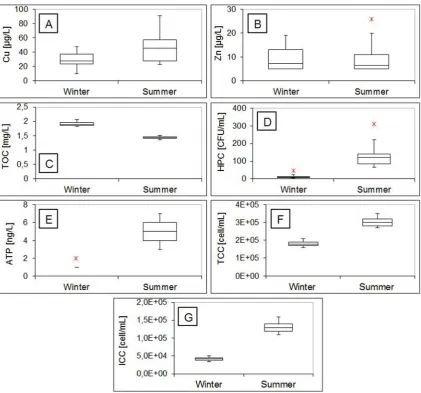
According to Kruskal-Wallis test, no difference was found be-tween all fresh water samples coming from the inlet tap, kitchen tap and shower tap for all examined parameters. The quality pa-rameters of fresh water delivered to the study site during the winter and summer experiments are presented inFig. 1A - G. The temperature of fresh water samples was 6e8C during the winter
experiments and 21.5e23 C during the summer experiments.
Ambient temperature around the DDWS was measured to be 16e20.5C during the winter experiments and 19.5e26C during
the summer experiments.
The average copper concentration in fresh water samples (Fig. 1A) was 30
m
g/L (range 10e50m
g/L) during the winter exper-iments and 50m
g/L (range 20e90m
g/L) during the summer ex-periments, respectively, while the average measured zinc content in fresh water samples (Fig. 1B) was found to be around 7m
g/L (range 5e26m
g/L), both in the winter and in the summer experiments.The total organic carbon (TOC) is one of the most commonly applied measures to indicate the natural organic matter (NOM)
concentration that is present in a water sample. The average con-tent of TOC in fresh water samples during the winter experiments was 1.89 mg/L (range 1.83e2.06 mg/L) (Fig. 1C), while the average
concentration of TOC in fresh water samples during the summer experiments was 1.43 mg/L (range 1.37e1.52 mg/L), respectively.
The general microbial quality of drinking water is monitored with HPC analysis. As can be seen fromFig. 1D, the average HPC concentration during the winter experiments was 10 CFU/mL (range 5e31 CFU/mL) and was considerably lower than the average
HPC concentration during the summer experiments of 130 CFU/mL (range 65e310 CFU/mL).
Adenosine triphosphate (ATP) represents the main energy car-rier molecule and is detectable and measurable in all living cells. As shown inFig. 1E, ATP concentrations during the winter experi-ments can be considered low, as the average ATP concentration was 1 ng/L (range 1e2 ng/L). During the summer experiments, however,
ATP concentrations were somewhat elevated, with the average value of 5 ng/L (range 3e7 ng/L).
The total number of cells in fresh water samples during the winter and summer experiments (Fig. 1F) was in the range from 1.6 105 cell/mL to 2.15 105 cell/mL and from 2.7 105 to 3.5105cell/mL, respectively. Though water is distributed without residual disinfectant in the Netherlands, it was found that only ~25% of total cells in fresh water were intact during the winter experiments and ~45% of total cells were intact during the summer experiments (Fig. 1G). In addition to this, the percentage of intact cells with high nucleic acid content (ICC-HNA) among total intact cells during the winter and summer experiments was ~33% and ~56%, respectively.
3.2. Stagnant water
InFig. 2measured copper concentrations during the winter and
summer stagnation experiments are summarized.
The concentrations of copper in stagnant water samples increased with the stagnation time during both sets of experi-ments. During the winter experiments, maximum copper levels of 1370
m
g/L and 1680m
g/L were assayed after 48 h of stagnation in water samples from the kitchen and shower tap, respectively. During the summer experiments, maximum copper levels of 1140m
g/L in a kitchen tap sample, and 1470m
g/L in a shower tap sample, were reached after 24 h of stagnation. After peaking, the concentrations of copper were found to decrease.Levels of zinc concentrations during the stagnation experiments are summarized inFig. 3.
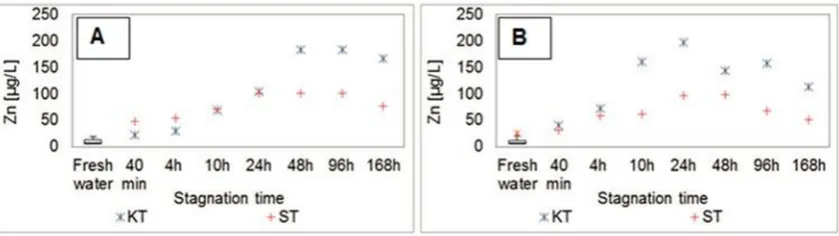
Similar to the copper leaching during the stagnation experi-ments, the concentrations of zinc in water samples increased with the stagnation time in both winter and summer experiments. Maximum zinc concentrations of 180
m
g/L in a water sample from the kitchen tap and 100m
g/L in a water sample from the shower tap were reached after 48 h of stagnation during the winter experi-ments. During the summer experiments, maximum zinc concen-trations of 200m
g/L and 100m
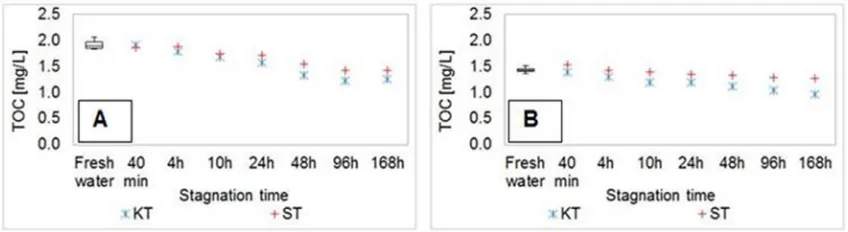
g/L were measured after the 24 h of stagnation in the kitchen and in the shower samples, respectively. After peaking, the concentrations of zinc were found to decrease.The distribution of TOC concentrations over the stagnation time is presented inFig. 4.
As is evident fromFig. 4, TOC concentrations decreased with the stagnation time during both sets of experiments (winter and summer), and the highest reduction in the TOC content was detected after 168 h of stagnation (30% during the winter and 15% during the summer experiments, respectively).
During the winter experiments, the number of heterotrophic bacteria increased with stagnation time, in both kitchen and shower tap samples (Fig. 5A). Stagnation time of 168 h resulted in a 100 and 200-fold increases in the HPC levels in water sampled from Fig. 2.A) Copper concentrations in water samples during winter stagnation experiments. B) Copper concentrations in water samples during summer stagnation experiments. KT -kitchen tap; STeshower tap, SD<2.5%.
the kitchen and shower tap, respectively, compared to the HPC levels after 40 min of stagnation in the winter experiments. During the summer experiments (Fig. 5B), the HPC levels in stagnant water were scattered, with a random increase and/or decrease after different stagnation intervals for two examined taps.
Fig. 6shows ATP profiles that were measured during the stag-nation experiments.
The results demonstrate a 4e8-fold increase in the ATP
con-centrations in the water samples after 10 and 24 h of stagnation during the winter experiments for both kitchen and shower taps. After 48of stagnation, differences in the ATP concentrations were observed in the samples from the two considered taps. In water samples from the kitchen tap, a reduction in the ATP levels was observed after 48 h of stagnation, while in the shower water samples the ATP concentrations continued to increase. The ATP profile during the summer experiments shows that no increase in microbial viability was measured, except for the shower water
samples after 96 h of stagnation. Here, a 2-fold increase was measured after 96 and 168 h of stagnation time.
InFig. 7, the influence of stagnation time on the intact bacterial cell concentrations is presented.
During the winter experiments, water stagnation resulted in increased ICC concentrations, as a 2-fold increase in the ICC was measured after 10 h of stagnation (Fig. 6A). During the summer experiments, on the contrary, water stagnation resulted in a reduction in the ICC in the kitchen tap samples, i.e. a 5-fold reduction was measured after 168 h. In the shower tap samples, a steady decrease in the ICC was initially observed, i.e. a 3-fold reduction in the ICC was found after 48 h of stagnation. After 96 and 168 h, elevated ICC were measured compared to the results of 48 h of stagnation, which coincides with the ATP measurements (Fig. 6B). The HNA/LNA footprint of all stagnant water samples didn't change considerably during the summer stagnation experi-ments (50% of ICC bacteria were ICC-HNA bacteria), while during Fig. 4.A) TOC concentrations in water samples during winter stagnation experiments. B) TOC concentrations in water samples during summer stagnation experiments. KT - kitchen tap; STeshower tap, SD<2%.
Fig. 5.A) HPC levels in water samples during winter stagnation experiments. B) HPC levels in water samples during summer stagnation experiments. KT - kitchen tap; STeshower tap, SD<5%.
the winter experiments an increase of up to 2.5-fold was observed in ICC-HNA cells in the stagnant water samples.
3.3. Influence of water temperature and overnight stagnation on microbial properties of drinking waterelong term experiments
InFig. 8, a change in microbial parameters after the overnight stagnation is given, which was assessed by FCM, ATP and HPC measurements.
As presented inFig. 8A, the overnight stagnation of 10 h led to an increase in ICC and ATP concentrations, i.e. up to 1.5-fold increase in ICC concentrations and up to 7-fold increase in ATP levels were measured (Fig. 8A), if the fresh water temperature was lower than 17C. However, if the fresh water temperatures were higher than 17C, the overnight stagnation resulted in a reduction in ICC and ATP concentrations, up to 2-fold and 5-fold, respectively. A similar observation was made with HPC measurements (Fig. 8B), while here the critical fresh water temperature for the shift in the increase and/ or decrease in HPC concentrations was around 16C, which co-incides with the critical temperature of 17C of ICC and ATP.
3.4. Biofilm measurements
Biofilm characteristics from two different pipes (kitchen and shower), were quantified by FCM, ATP and HPC measurements (Table 1).
Biofilm in the shower tap contained higher amounts of total cells (TCC 10105cells/cm2) and intact cells (ICC 5.7105cells/ cm2) than in the kitchen tap (TCC 6.6 105 cells/cm2 and ICC 2.9105 cells/cm2, respectively). The amount of viable biomass and cultivable bacteria in the biofilms were 12 pg/cm2and 6 CFU/ cm2 for the kitchen pipe and 11 pg/cm2 and 3 CFU/cm2 for the shower pipe, respectively.
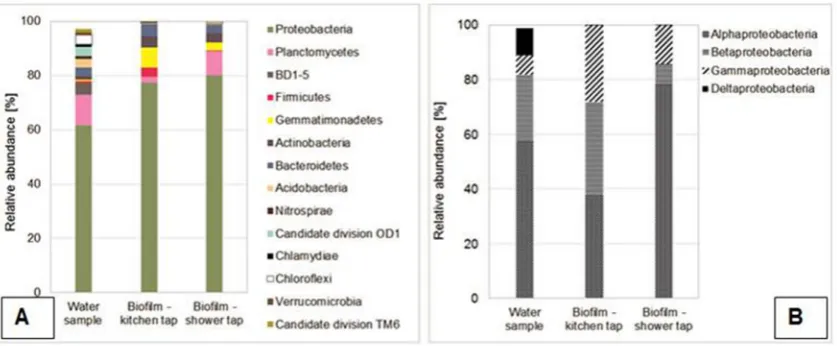
According to the sequencing analysis, Proteobacteria were identified as the most dominant phyla in both water and biofilm samples, ranging from 61% to 80%. Proteobacteria in the water samples were represented by 57% ofAlphaproteobacteria, 25% of Betaproteobacteria, 7% ofGammaproteobacteriaand 10% of Deltap-roteobacteria. Interestingly, a different composition of Proteobac-teriawas observed in the biofilm samples from the kitchen and shower pipes. In the kitchen biofilm sampleAlphaproteobacteria, BetaproteobacteriaandGammaproteobacteriawere evenly distrib-uted (38%, 33% and 28%, respectively). In the shower tap sample the most dominant members ofProteobacteriawere Alphaproteobac-teria(78%), while the abundance ofBetaproteobacteriaand Gam-maproteobacteriawas considerably lower, 7% and 14%, respectively.
4. Discussion
In this research, a full-scale copper DDWS, which was run ac-cording to stochastic demand water patterns, was used to study the influence of different stagnation intervals on water quality. Two Fig. 7.A) ICC concentrations in water samples during winter stagnation experiments. B) ICC concentrations in water samples during summer stagnation experiments. KT - kitchen tap; STeshower tap, SD<4%.
Fig. 8.Change in microbiological parameters during overnight stagnation in long term experiments. A) Change in ICC and ATP concentrations. B) Change in HPC levels. KT-kitchen tap, ST - shower tap.
Table 1
Biofilm characteristics measured by FCM, ATP and HPC measurements from-kitchen and shower tap.
Biofilm sample TCC [105 cell/cm2] ICC [105 cell/cm2] HPC [CFU/cm2] ATP [pg/cm2]
Kitchen tap 6.6 2.9 6 12
individual experimental sets (winter and summer) were carried out to examine the seasonal effects on fresh and stagnant water quality.
4.1. Fresh water
The concentrations of copper in fresh water samples were, on average, 20
m
g/L higher during the summer experiments (Fig. 1A). As water passed through copper pipes before the inlet point, the discrepancy of 20m
g/L in the copper levels between winter and summer samples could be related to the leaching of copper under higher temperatures from the copper pipes before the experimental rig. However, the measured copper levels in fresh water samples during both winter and summer were found to be below the guideline value proposed by WHO (2 mg/L) and therefore they could pose a negligible risk to human health (WHO, 2004).The concentrations of zinc in fresh water samples (Fig. 1B) were in the same range during the winter and summer experiments. Even though there is no health-based guideline value for zinc in drinking water, at zinc concentrations above 3 mg/L an undesired colour and taste can develop (WHO, 2003). In this research, the measured zinc concentrations in fresh water samples were far below the proposed aesthetic guideline.
The total organic carbon concentration in fresh water samples was, on average, 0.45 mg/L, higher in the winter experiments than in the winter experiments (Fig. 1C), which agrees with findings from a recent research in which seasonal variations in TOC con-centrations in treated water are presented (Prest et al., 2016b). The variations in the TOC content may be attributed both to the sea-sonal differences in organic matter in raw (surface) water (Herzsprung et al. 2012, Ledesma et al., 2012) and decreased organic carbon removal efficiency of GAC filters at lower water temperatures (Melin et al., 2002; Schreiber et al., 2005).
The differences in microbial parameters in fresh water, measured by HPC, ATP and FCM methods (Fig. 1DeG), were also
observed between winter and summer months. For example, significantly higher HPC concentrations in fresh water were measured during the summer experiments, i.e. up to 300 CFU/mL (Fig. 1D), exceeding the Dutch official guideline of 100 CFU/mL in distribution networks. Elevated HPC concentrations during the summer experiments may be linked to higher drinking water temperatures, which was also documented in a study on HPC growth in an unchlorinated water system in Germany at the end of a hot summer (Uhl and Schaule, 2004). ATP concentrations in fresh water samples (Fig. 1E) were also higher during the summer ex-periments than in the winter exex-periments, which coincides with
findings from two studies about unchlorinated water systems (Prest et al., 2016b; van der Wielen and van der Kooij, 2010).
Measured TCC and ICC concentrations (Fig. 1F and E) fall within the range of TCC and ICC concentrations in unchlorinated drinking water samples (Hammes et al., 2010; Liu et al., 2013; Prest et al., 2016b). The concentrations of TCC and ICC were significantly higher in the summer experiments than in the winter experiments, and such seasonal variations were also observed by Prest et al. (2016a,b) in the effluent of a drinking water treatment plant. In addition to this, we also observed that percentage of intact cells with high nucleic content (ICC-HNA) were lower in the winter than in the summer experiments (~33% and ~56%, respectively), which can be attributed to seasonal changes in the abundance of HNA fraction in surface water (Liu et al., 2016). The shift in HNA/LNA community can be one of the reasons for the elevated ATP con-centrations in fresh water samples during the summer experi-ments, as a previous study showed that an increase in HNA content could be related to a 4-fold increase in ATP concentrations (Liu et al., 2013). This is because the HNA bacteria are larger cells with
a 10-fold higher ATP-per-cell content than LNA bacteria (Wang et al., 2009).
4.2. Stagnant water
First of all, we have to point out that the winter and summer stagnation experiments were carried out as “one-time experi-ments”, whereas all measurements were done in duplicates or triplicates. The standard deviation of measurements was less than 5% for all examined parameters. Looking at the box-plot results for fresh water samples (21 water samples per experiment were taken on different days), it can be seen that the results are close to each other (Fig. 1), indicating a high level of measurements’stability. On the other hand, from the stagnant water results (Figs. 2e7), it can be noticed that the results fell outside the whiskers for fresh water. Based on the stability of the measurements for fresh water, we concluded that stagnation led to changes in water quality param-eters, while the change in microbial quality parameters was mainly influenced by the temperature of fresh water and/or seasonality effect.
reacting with metallic copper (Lytle and Schock, 2000).
Water stagnation also promoted leaching of zinc from brass elements (Fig. 3), which was already documented in several studies on the influence of stagnation on zinc leaching (Lytle and Schock, 1996; Quevauviller and Thompson, 2005; Sorlini et al., 2014). The difference in released zinc between the samples from the kitchen and shower tap (~100
m
g/L) might also be due to the microclimate conditions around the set-up. After peaking, a drop in zinc con-centrations was observed with the increase in stagnation time. As NOM has negligible effect on leaching of zinc from brass elements (Korshin et al., 2000), the decrease in zinc concentrations can be related to the drop in dissolved oxygen levels in stagnant water, because oxygen is the limiting parameter in the zinc leaching process (Turner, 1962), after which the precipitation of the corro-sion product (meringue) on pipe surface may happen (Zhang, 2009).The concentrations of TOC decreased with the stagnation of water in the copper DDWS (Fig. 4). A larger decrease in the TOC content was observed during the winter experiments, than in the summer experiments. As given before, free copper may react with organic matter in water and the products of the reaction may be soluble compounds, particulate compounds and precipitates (Edwards and Sprague, 2001), followed by the precipitation and/or sorption of the products on the pipe surfaces. Moreover, according to the scanning electron microscopy of biofilms present on copper surfaces, two distinct layers can be distinguished: a layer of extracellular polymeric substances in direct contact with the cop-per and a layer comprising the microorganisms which are not embedded in the extracellular polymeric substances, as cited in (Momba et al., 2000). The extracellular polymeric substances contain functional groups which provide bonding sites both for metal cations and NOM (Qin-qin et al., 2012; Wang et al., 2012). Organic carbon is usually considered as a limiting factor for the growth of microorganisms in water distribution systems. Theoret-ically, 1
m
g/L of organic carbon is enough to stimulate the growth of 103e104 cell/mL (Prest et al., 2016a). During the winterexperi-ments, an increase in ICC concentrations was observed (5 104 cell/mL), which might imply that only 1e10% of the
measured drop in TOC might have been consumed by bacteria during the water stagnation.
The growth of HPC bacteria depends on different parameters such as temperature, disinfectant residual, nutrient concentrations, corrosion control and pipe material (LeChevallier et al., 1996b; Volk et al., 2000). In our study, the numbers of HPC bacteria were found to be influenced by stagnation time in the DDWS, whereas an in-crease in HPC levels was measured (Fig. 5A) during the winter ex-periments. The increase in HPC counts during the stagnation in the winter experiments is consistent with findings from a study (Lehtola et al., 2007), in which stagnation time of 16 h resulted in up to 10-fold higher numbers of HPC compared to the HPC levels after 40 min of stagnation of fresh water (with average fresh tempera-ture of 13.9C). On the other hand, data from the summer exper-iments show that HPC concentrations increase in some cases with stagnation time, but no consistent pattern was observed. Though the data were found to be too scattered to be conclusive, a possible reason for this observation could be biofilm attachment/detach-ment in the stagnant water (Hunt et al., 2004; Lautenschlager et al., 2010).
Results from culture independent measurements, such as ATP andflow cytometry measurements, revealed that water stagnation influenced the cell numbers and viable biomass in both winter and summer experiments (Figs. 6 and 7). During the winter experi-ments, increased ICC concentrations and ATP levels were measured in stagnant samples, despite the higher concentrations of copper in stagnant water (Fig. 2A), and its toxicity for bacteria (Thurman
et al., 1989). This observation suggests that copper was not toxic to all bacteria, as some bacteria can develop complex resistance mechanisms under elevated copper concentrations (Bondarczuk and Piotrowska-Seget, 2013).
The increase in ICC in thefirst 24 h during the winter experi-ments (Fig. 7A) agrees with the observation from previous research (Boe-Hansen et al., 2002; Lautenschlager et al., 2010; Lehtola et al., 2007). As in the previous studies, longer stagnation time did not result in a further increase in ICC concentrations, which is most likely due to the substrate limitation (Boe-Hansen et al., 2002; Lautenschlager et al., 2010). Moreover, during the winter experi-ments an increase of up to 2.5-fold was measured in ICC-HNA cells in stagnant samples, and the shift in HNA community might be a reason for the 4e8-fold increase in ATP concentrations during the
winter experiments (Fig. 6A). During the summer experiments, on the other hand, water stagnation led to decrease in both ICC and ATP concentrations (Figs. 6B and 7B), while the HNA footprint of all stagnant water samples didn't change considerably during stag-nation (~50% of ICC bacteria were ICC-HNA bacteria). To our knowledge, similar findings were never reported before, and therefore a hypothesis is that the decrease in ICC and ATP may be due to substrate limitation and/or bacterial death through starva-tion (Morita, 1997). Previous research on the biological stability of drinking water produced and distributed by Evides Waterbedrijf (The Netherlands), showed that assimilable organic carbon (AOC), a portion of the TOC that can be utilized by microorganisms, exhibited a reverse seasonal trend compared to the water tem-perature. The lowest AOC concentrations (3.5
m
g/L) were measured at highest water temperature, while the highest AOC concentra-tions (41.4m
g/L) were detected at low drinking water temperatures at the water treatment facility (Prest et al., 2016b). With high water temperatures, low AOC content could be further reduced during the distribution phase, leaving the limited amount of AOC growth in DDWSs. On the other hand, during the winter months with low fresh water temperatures, favorable growth conditions, in terms of temperature, could only be met in the DDWS, where the ambient temperature was 16e26C.Furthermore, the overnight stagnation of 10 h led to increased ICC, ATP and HPC levels, i.e. when the fresh water temperature was lower than 17C (16C for HPC), while a reduction in ICC, ATP and HPC concentrations was found when the fresh water temperatures were higher than 17C (16C for HPC) as presented inFig. 8. Earlier studies (Lautenschlager et al., 2010; Lehtola et al., 2007; Lipphaus et al., 2014; Prest et al., 2013; Zhang et al., 2015) on water quality in experimental and real DDWSs showed that the overnight stag-nation of water in DDWSs can lead to increased cell concentrations and higher bacterial community metabolic activity. Still, these studies were conducted during colder months, with temperatures of fresh water ranging from 4.2 C to 13.9C. What might have happened during overnight water stagnation under higher fresh water temperatures, remains unclear from the listed studies. A possible reason for the decrease in ICC, ATP and HPC when fresh-water was higher than 17C (16C for HPC) can be substrate lim-itation following the starvation e induced death or bacterial
accumulation on the pipe wall (Garrett et al., 2008).
4.3. Biofilm
Supplemental Table S3). Moreover, high similarity (>98%) at the genus level was also found between biofilm samples from the two kitchen taps, showing the reproducibility of the experiment. The results presented inTable 1show that the viable microbial biomass (ATP/cm2) was similar in the kitchen and shower biofilms. Considerably higher values of total, intact and culturable counts were observed in the biofilm from the shower pipe, which might be due to the less frequent use of the pipe and higher ambient tem-perature on the 2nd floor, where the shower pipe is located. However, the authors were unable to explain the discrepancies between ATP and FCM/HPC results for kitchen and shower pipe biofilms. The biofilm densities expressed by TCC and ICC mea-surements agree well with previously reported densities, which ranged from 104to 107cell/cm2. Measured ATP and HPC concen-trations are below the reported ranges in biofilms formed in drinking water distribution systems, which were from 40 to 4000 pg ATP/cm2 and 104e107 CFU/cm2 (Boe-Hansen, 2001;
Inkinen et al., 2014; Kalmbach et al., 1997; Lehtola et al. 2004, 2006; Liu, 2013). Low HPC and ATP levels can be because in this study water was mainly stagnant in the DDWS system, while in most studies water was continuouslyflowing through the pipes -introducing new nutrients for bacteria to grow within the biofilm phase. Our results also show that less than 0.01% of the total bac-teria in biofilms are culturable, estimated by the traditionally applied HPC approach, which is in line with the conclusion from above-mentioned studies that the portion of biofilm culturable bacteria is as little as 0.01% to several percents of the total cell concentration.
Moreover, the community differences were also observed in biofilm samples from the kitchen and shower pipes, and this observation supports the finding that biofilm bacterial commu-nities may be affected by infrequentflow conditions (Inkinen et al., 2016). According to the sequencing analysis, Proteobacteriawere identified as the most dominant phyla in both water and biofilm samples, ranging from 61% to 80% (Fig. 9A), which has also been reported in earlier research (Eichler et al., 2006; Liu et al., 2013; Lührig et al., 2015; Magic-Knezev et al., 2009; Prest, 2015). Despite the fact that copper is toxic to bacteria when present under higher concentrations, copper is an essential element for cell metabolism. The dual characteristic of copper has forced bacteria to develop complex resistance mechanisms in order to survive under excessive copper concentrations (Bondarczuk and Piotrowska-Seget, 2013). For instance, genus Sphingomonas (order
Sphingomonadales)is associated with the corrosion of copper pipes and the biosorption of copper (Vilchez et al., 2007; White et al., 1996), as it contains the copper resistance (copA)genes (Altimira et al., 2012). The presence of Sphingomonadales in the biofilms (24e35% of the biofilm OTU's) indicates high copper tolerance.
Furthermore, an uncultured group ofAlcaligenacea(15e20% of the
biofilm OTU's) was identified, andAlcaligenes eutrophusis known for its tolerance to high zinc concentrations. Sedimenticola (11e21%) andGemmatimonas(2e7%), on the other hand, are able to
utilize various electron acceptors (Carlstr€om et al., 2015; Nancharaiah and Lens, 2015; Zhang et al., 2003), and their pres-ence in biofilms suggests that specific redox-conditions on the copper pipe surface have an impact on the biofilm differentiation.
5. Conclusions
Stagnation promoted leaching of copper and zinc from pipes and
fixtures during the summer and winter stagnation experiments. Maximum copper and zinc concentrations were reached after 48 h of stagnation during the winter experiments and after 24 h of stagnation during the summer experiments, which might be related to the seasonal differences in water chemistry.
Overnight stagnation of water in copper pipes influenced mi-crobial parameters measured by HPC, ATP and FCM methods. At low fresh water temperatures, the concentrations of HPC, ICC and ATP increased in stagnant water samples, while at high fresh water temperatures, microbial numbers and viable biomass were found to decrease during the overnight stagnation.
From the biofilm analysis, it can be concluded that different biofilm compositions may exist within one DDWS, which can be attributed to the influence of the microclimate in houses and consumption patterns on biofilm formation.
Acknowledgements
The authors would like to acknowledgefinancial support from Dutch Automatische bluswatersystemen project (Agentschap Project No. IMV1100047), Stichting PIT, and drinking water com-panies Waternet, Vitens, Oasen, PWN and Brabant Water.
Appendix A. Supplementary data
Supplementary data related to this article can be found athttp:// dx.doi.org/10.1016/j.watres.2017.07.019.
References
Altimira, F., Ya~nez, C., Bravo, G., Gonzalez, M., Rojas, L.A., Seeger, M., 2012. Charac-terization of resistant bacteria and bacterial communities from copper-polluted agricultural soils of central Chile. BMC Microbiol. 12 (1), 193.
ANSI-ASHRAE, 1992. Thermal environmental Conditions for Human Occupancy. American Society of Heating, Refrigerating and Air-conditioning Engineers, Atlanta, GA.
Bartram, J., 2003. In: Heterotrophic Plate Counts and Drinking-water Safety: the Significance of HPCs for Water Quality and Human Health. Pub., I. World Health Organization, London, UK.
Berry, D., Xi, C., Raskin, L., 2006. Microbial ecology of drinking water distribution systems. Curr. Opin. Biotechnol. 17 (3), 297e302.
Blokker, E.J.M., Vreeburg, J.H.G., van Dijk, J.C., 2010. Simulating residential water demand with a stochastic end-use model. J. Water Resour. Plan. Management-Asce 136 (1), 19e26.
Blokker, E.J.M., Vreeburg, J.H.G., Vogelaar, A.J., 2006. Combining the Probabilistic Demand Model SIMDEUM with a Network Model. Cincinnati, Ohio, USA.
Boe-Hansen, R., 2001. Microbial Growth in Drinking Water Distribution Systems. Environment&Resources. DTU.
Boe-Hansen, R., Albrechtsen, H.J., Arvin, E., Jørgensen, C., 2002. Bulk water phase and biofilm growth in drinking water at low nutrient conditions. Water Res. 36 (18), 4477e4486.
Bondarczuk, K., Piotrowska-Seget, Z., 2013. Molecular basis of active copper resis-tance mechanisms in Gram-negative bacteria. Cell Biol. Toxicol. 29 (6), 397e405.
Boulay, N., Edwards, M., 2001. Role of temperature, chlorine, and organic matter in copper corrosion by-product release in soft water. Water Res. 35 (3), 683e690. Brazos, B.J., O'Conner, J.T., Abcouwer, S., 1985. Kinetics of Chlorine Depletion and
Microbial Growth in Household Plumbing Systems (Houston, Texas).
Carlstr€om, C.I., Loutey, D., Bauer, S., Clark, I.C., Rohde, R.A., Iavarone, A.T., Lucas, L., Coates, J.D., 2015. (Per) chlorate-reducing bacteria can utilize aerobic and anaerobic pathways of aromatic degradation with (per) chlorate as an electron acceptor. mBio 6 (2) e02287e02214.
de Moel, P.J., Verberk, J.Q., van Dijk, J.C., 2006. Drinking Water: Principles and Practices. World Scientific, New Jersey ([etc.]).
Edwards, M., Sprague, N., 2001. Organic matter and copper corrosion by-product release: a mechanistic study. Corros. Sci. 43 (1), 1e18.
Eichler, S., Christen, R., Holtje, C., Westphal, P., B€ otel, J., Brettar, I., Mehling, A.,€ H€ofle, M.G., 2006. Composition and dynamics of bacterial communities of a drinking water supply system as assessed by RNA- and DNA-based 16S rRNA genefingerprinting. Appl. Environ. Microbiol. 72 (3), 1858e1872.
Garrett, T.R., Bhakoo, M., Zhang, Z., 2008. Bacterial adhesion and biofilms on sur-faces. Prog. Nat. Sci. 18 (9), 1049e1056.
Hammes, F., Berger, C., K€oster, O., Egli, T., 2010. Assessing biological stability of drinking water without disinfectant residuals in a full-scale water supply sys-tem. J. Water Supply Res. Technol. - AQUA 59 (1), 31e40.
Hammes, F., Berney, M., Wang, Y., Vital, M., K€oster, O., Egli, T., 2008. Flow-cytometric total bacterial cell counts as a descriptive microbiological parameter for drinking water treatment processes. Water Res. 42 (1e2), 269e277. Hammes, F., Boon, N., Vital, M., Ross, P., Magic-Knezev, A., Dignum, M., 2011.
Bac-terial colonization of pellet softening reactors used during drinking water treatment. Appl. Environ. Microbiol. 77 (3), 1041e1048.
Hammes, F., Egli, T., 2010. Cytometric methods for measuring bacteria in water: advantages, pitfalls and applications. Anal. Bioanal. Chem. 397 (3), 1083e1095. Herzsprung, P., von Tumpling, W., Hertkorn, N., Harir, M., Buttner, O., Bravidor, J., Friese, K., Schmitt-Kopplin, P., 2012. Variations of DOM quality in inflows of a drinking water reservoir: linking of van Krevelen diagrams with EEMF spectra by rank correlation. Environ. Sci. Technol. 46 (10), 5511e5518.
Hunt, S.M., Werner, E.M., Huang, B., Hamilton, M.A., Stewart, P.S., 2004. Hypothesis for the role of nutrient starvation in biofilm detachment. Appl. Environ. Microbiol. 70 (12), 7418e7425.
ILT, 2015. The Quality of the Drinking Water in The Netherlands in 2014, the Human Environment and Transport Inspectorate. Utrecht, The Netherlands.
Inkinen, J., Jayaprakash, B., Santo Domingo, J.W., Keinanen-Toivola, M.M., Ryu, H.,€ Pitk€anen, T., 2016. Diversity of ribosomal 16S DNA-and RNA-based bacterial community in an office building drinking water system. J. Appl. Microbiol. 120 (6), 1723e1738.
Inkinen, J., Kaunisto, T., Pursiainen, A., Miettinen, I.T., Kusnetsov, J., Riihinen, K., Kein€anen-Toivola, M.M., 2014. Drinking water quality and formation of biofilms in an office building during itsfirst year of operation, a full scale study. Water Res. 49, 83e91.
Kalmbach, S., Manz, W., Szewzyk, U., 1997. Isolation of new bacterial species from drinking water biofilms and proof of their in situ dominance with highly spe-cific 16S rRNA probes. Appl. Environ. Microbiol. 63 (11), 4164e4170. Korshin, G.V., Ferguson, J.F., Lancaster, A.N., 2000. Influence of natural organic
matter on the corrosion of leaded brass in potable water. Corros. Sci. 42 (1), 53e66.
Korshin, G.V., Perry, S.A.L., Ferguson, J.F., 1996. Influence of NOM on copper corro-sion. Am. Water Works Assoc. J. 88 (7), 36.
Lautenschlager, K., Boon, N., Wang, Y., Egli, T., Hammes, F., 2010. Overnight stag-nation of drinking water in household taps induces microbial growth and changes in community composition. Water Res. 44 (17), 4868e4877. LeChevallier, M.W., Shaw, N.J., Smith, D.B., 1996a. Factors Limiting Microbial Growth
in Distribution Systems: Full-scale Experiments. American Water Works Association.
LeChevallier, M.W., Welch, N.J., Smith, D.B., 1996b. Full-scale studies of factors related to coliform regrowth in drinking water. Appl. Environ. Microbiol. 62 (7), 2201e2211.
Ledesma, J.L., Kohler, S.J., Futter, M.N., 2012. Long-term dynamics of dissolved€ organic carbon: implications for drinking water supply. Sci. total Environ. 432, 1e11.
Lehtola, M.J., Laxander, M., Miettinen, I.T., Hirvonen, A., Vartiainen, T., Martikainen, P.J., 2006. The effects of changing waterflow velocity on the for-mation of biofilms and water quality in pilot distribution system consisting of copper or polyethylene pipes. Water Res. 40 (11), 2151e2160.
Lehtola, M.J., Miettinen, I.T., Hirvonen, A., Vartiainen, T., Martikainen, P.J., 2007. Estimates of microbial quality and concentration of copper in distributed drinking water are highly dependent on sampling strategy. Int. J. Hyg. Environ. Health 210 (6), 725e732.
Lehtola, M.J., Miettinen, I.T., Kein€anen, M.M., Kekki, T.K., Laine, O., Hirvonen, A., Vartiainen, T., Martikainen, P.J., 2004. Microbiology, chemistry and biofilm development in a pilot drinking water distribution system with copper and plastic pipes. Water Res. 38 (17), 3769e3779.
Li, X.Z., Sun, J.M., 2001. Further formation of trihalomethanes in drinking water during heating. Int. J. Environ. Health Res. 11 (4), 343e348.
Lipphaus, P., Hammes, F., Kotzsch, S., Green, J., Gillespie, S., Nocker, A., 2014.€ Microbiological tap water profile of a medium-sized building and effect of water stagnation. Environ. Technol. 35 (5), 620e628.
Liu, G., 2013. Microbiological Water Quality in Drinking Water Distribution Systems: Integral Study of Bulk Water, Suspended Solids, Loose Deposits, and Pipe Wall Biofilm (chapter 5). PhD thesis. Technische Universiteit Delf, Delft, The Netherlands.
Liu, G., Van der Mark, E.J., Verberk, J.Q.J.C., Van Dijk, J.C., 2013. Flow cytometry total cell counts: afield study assessing microbiological water quality and growth in unchlorinated drinking water distribution systems. BioMed Res. Int. 2013, 595872http://dx.doi.org/10.1155/2013/595872, 10 pages.
Liu, J., Hao, Z., Ma, L., Ji, Y., Bartlam, M., Wang, Y., 2016. Spatio-temporal variations of high and low nucleic acid content bacteria in an exorheic river. PLoS One 11 (4), e0153678.
Lührig, K., Canb€ack, B., Paul, C.J., Johansson, T., Persson, K.M., Rådstrom, P., 2015.€ Bacterial community analysis of drinking water biofilms in southern Sweden. Microbes Environ. 30 (1), 99e107.
Lytle, D.A., Schock, M.R., 1996. Stagnation Time, Composition, Ph, and Orthophos-phate Effects on Metal Leaching from Brass. National Risk Management Research Laboratory, Office of Research and Development, US Environmental Protection Agency.
Lytle, D.A., Schock, M.R., 2000. Impact of stagnation time on metal dissolution from plumbing materials in drinking water. J. Water Supply Res. Technol. - AQUA 49 (5), 243e257.
Magic-Knezev, A., van der Kooij, D., 2004. Optimisation and significance of ATP analysis for measuring active biomass in granular activated carbonfilters used in water treatment. Water Res. 38 (18), 3971e3979.
Magic-Knezev, A., Wullings, B., Van der Kooij, D., 2009. Polaromonas and Hydro-genophaga species are the predominant bacteria cultured from granular acti-vated carbonfilters in water treatment. J. Appl. Microbiol. 107 (5), 1457e1467. Magoc, T., Salzberg, S.L., 2011. FLASH: fast length adjustment of short reads to
improve genome assemblies. Bioinformatics 27 (21), 2957e2963.
Melin, E., Eikebrokk, B., Brugger, M., Ødegaard, H., 2002. Treatment of humic surface water at cold temperatures by ozonation and biofiltration. Water Sci. Technol. Water Supply 2 (5e6), 451e457.
Merkel, T.H., Groß, H.J., Werner, W., Dahlke, T., Reicherter, S., Beuchle, G., Eberle, S.H., 2002. Copper corrosion by-product release in long-term stagnation experiments. Water Res. 36 (6), 1547e1555.
Moerman, A., Blokker, M., Vreeburg, J., van der Hoek, J.P., 2014. Drinking water temperature modelling in domestic systems. Procedia Eng. 89, 143e150. Momba, M.N.B., Kfir, R., Venter, S.N., Cloete, T.E., 2000. Overview of Biofilm
For-mation in Distribution Systems and its Impact on the Deterioration of Water Quality.
Morita, R.Y., 1997. Bacteria in Oligotrophic Environments: Starvation-survival Life-style. Chapman&Hall, New York.
Nakamoto, N., Graham, N., Gimbel, R., 2014. Progress in Slow Sand and Alternative Biofiltration Processes: Further Developments and Applications (chapter 6).
Nancharaiah, Y., Lens, P., 2015. Ecology and biotechnology of selenium-respiring bacteria. Microbiol. Mol. Biol. Rev. 79 (1), 61e80.
NEN1006, 2002. General Requirements for Water Supply Installations. Delft, The Netherlands.
NEN, 1997. Water Analysis - Guidelines for Determination of Total Organic Carbon (TOC) and Dissolved Organic Carbon (DOC). Delft, The Netherlands.
NEN, 1999. Water Quality - Enumeration of Culturable Micro-organisms - Colony Count by Inoculation in a Nutrient Agar Culture Medium. Delft, The Netherlands.
Approach for Systematic Microbial Water Quality Monitoring. PhD thesis. Delft University of Technology, Delft, The Netherlands.
Prest, E.I., Hammes, F., K€otzsch, S., van Loosdrecht, M.C.M., Vrouwenvelder, J.S., 2013. Monitoring microbiological changes in drinking water systems using a fast and reproducibleflow cytometric method. Water Res. 47 (19), 7131e7142. Prest, E.I., Hammes, F., van Loosdrecht, M., Vrouwenvelder, J.S., 2016a. Biological stability of drinking water: controlling factors, methods, and challenges. Front. Microbiol. 7, 45.
Prest, E.I., Weissbrodt, D.G., Hammes, F., van Loosdrecht, M.C.M., Vrouwenvelder, J.S., 2016b. Long-term bacterial dynamics in a full-scale drinking water distribution system. PLoS One 11 (10), e0164445.
Pruesse, E., Quast, C., Knittel, K., Fuchs, B.M., Ludwig, W., Peplies, J., Glockner, F.O., 2007. SILVA: a comprehensive online resource for quality checked and aligned ribosomal RNA sequence data compatible with ARB. Nucleic Acids Res. 35 (21), 7188e7196.
Qin-qin, T., Zhi-rong, L., Ying, D., Xin-xing, Z., 2012. Biosorption properties of extracellular polymeric substances towards Zn (II) and Cu (II). Desalination Water Treat. 45 (1e3), 40e47.
Quevauviller, P., Thompson, C., 2005. Analytical Methods for Drinking Water: Ad-vances in Sampling and Analysis. John Wiley&Sons.
Rossman, L.A., Clark, R.M.,, Grayman, W.M., 1994. Modeling chlorine residuals in drinking-water distribution systems. J. Environ. Eng. 120 (4), 803e820. Rupp, R.F., Vasquez, N.G., Lamberts, R., 2015. A review of human thermal comfort in
the built environment. Energy Build. 105, 178e205.
Rushing, J.C., Edwards, M., 2004. The role of temperature gradients in residential copper pipe corrosion. Corros. Sci. 46 (8), 1883e1894.
Sarver, E.A., 2010. Insights into Non-uniform Copper and Brass Corrosion in Potable Water Systems. Virginia Polytechnic Institute and State University.
Schreiber, B., Brinkmann, T., Schmalz, V., Worch, E., 2005. Adsorption of dissolved organic matter onto activated carbondthe influence of temperature, absorption wavelength, and molecular size. Water Res. 39 (15), 3449e3456.
Singh, I., Mavinic, D.S., 1991. Significance of building and plumbing specifics on trace metal concentrations in drinking water. Can. J. Civ. Eng. 18 (6), 893e903. Smeets, P.W., Medema, G.J., van Dijk, J.C., 2009. The Dutch secret: how to provide
safe drinking water without chlorine in The Netherlands. Drink. Water Eng. Sci. 2 (1), 1e14.
Sorlini, S., Gialdini, F., Collivignarelli, C., 2014. Metal leaching in drinking water domestic distribution system: an Italian case study. Int. J. Environ. Health Res. 24 (6), 497e514.
StateJournal, 23 May 2011. Decree of 23 May 2011 concerning the regulations for the production and distribution of drinking water and the organisation of the public drinking water supply. StaatscouranteOffic. J. R. Kingd. Neth. (No. 293) (in Dutch).
Thurman, R.B., Gerba, C.P., Bitton, G., 1989. The molecular mechanisms of copper and silver ion disinfection of bacteria and viruses. Crit. Rev. Environ. Sci. Technol. 18 (4), 295e315.
Tukey, J.W., 1977. Exploratory Data Analysis.
Turner, M.E.D., 1962. The Influence of Water Composition on the Dezincification of Duplex Brass Fittings.
Uhl, W., Schaule, G., 2004. Establishment of HPC(R2A) for regrowth control in non-chlorinated distribution systems. Int. J. Food Microbiol. 92 (3), 317e325. Van der Kooij, D., 2000. In: Belkin, S. (Ed.), Environmental Challenges. Springer,
Netherlands, pp. 25e34.
Van der Kooij, D., 2003. Managing Regrowth in Drinking Water Distribution Sys-tems. Heterotrophic Plate Counts and Drinking-water Safety. IWA Publishing,
London, United Kingdom, pp. 199e232.
Van der Kooij, D., van der Wielen, P.W.J.J., 2013. Microbial Growth in Drinking-water Supplies: Problems, Causes, Control and Research Needs. Intl Water Assn.
van der Wielen, P.W., van der Kooij, D., 2010. Effect of water composition, distance and season on the adenosine triphosphate concentration in unchlorinated drinking water in The Netherlands. Water Res. 44 (17), 4860e4867.
Vilchez, R., Pozo, C., Gomez, M.A., Rodelas, B., Gonz alez-Lopez, J., 2007. Dominance of sphingomonads in a copper-exposed biofilm community for groundwater treatment. Microbiology 153 (2), 325e337.
Vital, M., Dignum, M., Magic-Knezev, A., Ross, P., Rietveld, L., Hammes, F., 2012. Flow cytometry and adenosine tri-phosphate analysis: alternative possibilities to evaluate major bacteriological changes in drinking water treatment and dis-tribution systems. Water Res. 46 (15), 4665e4676.
Volk, C., Dundore, E., Schiermann, J., LeChevallier, M.W., 2000. Practical evaluation of iron corrosion control in a drinking water distribution system. Water Res. 34 (6), 1967e1974.
Vreeburg, J.H.G., Boxall, J.B., 2007. Discolouration in potable water distribution systems: a review. Water Res. 41 (3), 519e529.
Wang, Y., Hammes, F., Boon, N., Chami, M., Egli, T., 2009. Isolation and character-ization of low nucleic acid (LNA)-content bacteria. ISME J. 3 (8), 889e902. Wang, Y., Hammes, F., De Roy, K., Verstraete, W., Boon, N., 2010. Past, present and
future applications offlow cytometry in aquatic microbiology. Trends Bio-technol. 28 (8), 416e424.
Wang, Z., Hessler, C.M., Xue, Z., Seo, Y., 2012. The role of extracellular polymeric substances on the sorption of natural organic matter. Water Res. 46 (4), 1052e1060.
White, D.C., Sutton, S.D., Ringelberg, D.B., 1996. The genus Sphingomonas: physi-ology and ecphysi-ology. Curr. Opin. Biotechnol. 7 (3), 301e306.
WHO, 2003. In: Organization, W.H. (Ed.), Zinc in Drinking-water: Background Document for Development of WHO Guidelines for Drinking-water Quality (Geneva).
WHO, 2004. In: Organization, W.H. (Ed.), Copper in Drinking-water: Background Document for Development of WHO Guidelines for Drinking-water Quality (Geneva).
Yilmaz, P., Parfrey, L.W., Yarza, P., Gerken, J., Pruesse, E., Quast, C., Schweer, T., Peplies, J., Ludwig, W., Glockner, F.O., 2014. The SILVA and"All-species living tree project (LTP)"taxonomic frameworks. Nucleic Acids Res. 42 (Database issue), D643eD648.
Zhang, H., Sekiguchi, Y., Hanada, S., Hugenholtz, P., Kim, H., Kamagata, Y., Nakamura, K., 2003. Gemmatimonas aurantiaca gen. nov., sp. nov., a Gram-negative, aerobic, polyphosphate-accumulating micro-organism, the first cultured representative of the new bacterial phylum Gemmatimonadetes phyl. nov. Int. J. Syst. Evol. Microbiol. 53 (4), 1155e1163.
Zhang, H.H., Chen, S.N., Huang, T.L., Shang, P.L., Yang, X., Ma, W.X., 2015. Indoor heating drives water bacterial growth and community metabolic profile changes in building tap pipes during the winter season. Int. J. Environ. Res. public health 12 (10), 13649e13661.
Zhang, Y., 2009. Dezincification and Brass Lead Leaching in Premise Plumbing Systems: Effects of Alloy, Physical Conditions and Water Chemistry. Virginia Polytechnic Institute, Blacksburg, Virginia.