Experimental study on the void fraction of air-water two-phase flow in a horizontal
circular minichannel
Sudarja, Indarto, Deendarlianto, and Aqli Haq
Citation: AIP Conference Proceedings 1737, 040014 (2016); doi: 10.1063/1.4949302 View online: http://dx.doi.org/10.1063/1.4949302
View Table of Contents: http://scitation.aip.org/content/aip/proceeding/aipcp/1737?ver=pdfcov Published by the AIP Publishing
Articles you may be interested in
Experimental investigation on the interfacial characteristics of stratified air-water two-phase flow in a horizontal pipe
AIP Conf. Proc. 1737, 040012 (2016); 10.1063/1.4949300
Image processing analysis on the air-water slug two-phase flow in a horizontal pipe AIP Conf. Proc. 1737, 040011 (2016); 10.1063/1.4949299
Two-phase air-water stratified flow measurement using ultrasonic techniques AIP Conf. Proc. 1592, 283 (2014); 10.1063/1.4872116
An experimental study of the size effect on adiabatic gas-liquid two-phase flow patterns and void fraction in microchannels
Phys. Fluids 19, 033301 (2007); 10.1063/1.2567903
Experimental Study on the Void Fraction of Air-Water
Two-phase Flow in A Horizontal Circular Minichannel
Sudarja
1,2,a, Indarto
1,3, Deendarlianto
1,3, Aqli Haq
11Departement of Mechanical and Industrial Engineering, Gadjah Mada University, Yogyakarta 55281, Indonesia. 2Departement of Mechanical Engineering, Muhammadiyah University of Yogyakarta, Yogyakarta 55183, Indonesia.
3Centre for Energy Studies, Gadjah Mada University, Sekip K-1A Kampus UGM, Yogyakarta 55281, Indonesia.
Corresponding author: a[email protected], [email protected]
Abstract. Void fraction is an important parameter in two-phase flow. In the present work, the adiabatic two-phase air-water flow void fraction in a horizontal minichannel has been studied experimentally. A transparent circular channel with 1.6 mm inner diameter was employed as the test section. Superficial gas and liquid velocities were varied in the range of 0.025 - 66.3 m/s and 0.033 - 4.935 m/s, respectively. Void fraction data were obtained by analyzing the flow images being captured by using a high-speed camera. Here, the homogeneous (Eand the measured void fractions (H, respectively, were
compared to the existing correlations. It was found that: (1) for the bubbly and slug flows, the void fractions increases with the increase of JG, (2) for churn, slug-annular, and annular flow patterns, there is no specific correlation between JG and void fraction was observed due to effect of the slip between gas and liquid, and (3) whilst for bubbly and slug flows the void fractions are close to homogeneous line, for churn, annular, and slug-annular flows are far below the homogeneous line. It indicates that the slip ratios for the second group of flow patterns are higher than unity.
Keywords: Two-phase flow, Minichannel, Void fraction, Flow pattern, Slip ratio
INTRODUCTION
The small size flow channels are applied in compact heat exchangers, microelectronic cooling systems, nuclear reactors, chemical processing, and small-size refrigeration systems [1]. Two-phase flow parameters consist of basic parameters and heat transfer effect parameters. They include (a) Flow behavior or interfacial behavior (flow pattern, flow pattern map), (b) void fraction (DorH), and (c) pressure gradient. A “Void fraction” is defined as the ratio of the cross-sectional area occupied by the gas phase to the total cross-sectional area of the flow channel. The void fraction is an important parameter in two-phase flow, and two-phase flow void fractions in mini and microchannels have previously been studied [2-14]
Chung and Kawaji [10] measured the time-averaged void fractions in circular channels with diameters of 50 Pm,
100 Pm, 250 Pm, and 530 Pm and a 96Pm square channel by using an image analysis. The homogeneous flow model
agreed well with their 530 Pm diameter test data. Their data representing D = 250 Pm slightly deviated from the
homogeneous flow model, but they agreed well with Armand-type correlation that has been proposed earlier by Ali et al. [13] for two-phase flow in narrow rectangular channels with DH ≈ 1 mm.
The number of publications on the void fraction in the minichannel is not as many as those in conventional channels. Hence, the investigations on the void fraction in minichannel accompanied by its detail discussion is very important to be carried out. The objectives of this work are to obtain experimental data on the void fraction of air-water two-phase flow in a horizontal circular minichannel, and determine the relationship among the flow patterns and void fraction characteristics. The data then is compared to the existing correlation, such as homogeneous model, Armand’s correlation, and Kawahara’s correlation.
EXPERIMENTAL APPARATUS AND PROCEDURE
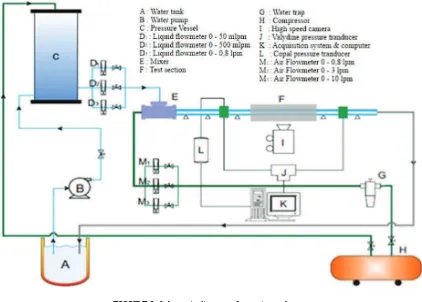
A schematic diagram of the experimental apparatus used in the present work is shown in Fig. 1. It consists of a pressure vessel for feeding (instead of pumping to avoid pulsation by pump) the liquid, a water pump for water recirculation (periodically), an air compressor, a water trap and air dryer, a glass pipe test section with an inner diameter of 1.6 mm and length of 400 mm, optical correction box, measuring instruments (such as water flowmeter from TOKYO KEISO and Omega with accuracy of + 3 % and + 5 %, respectively, gas flowmeter, and pressure transducer from Validyne with accuracy of + 0.25 %), high speed camera (Nikon J4 at 1200 fps and the resolution was 640 x 480 pixel) , and a computer. Water and dry air were used as working fluids. The properties of the working fluid are shown in Table 1. Experimental condition was adiabatic. The test was conducted under the superficial velocities of gas (JG) and liquid (JL) of 0.025 - 66.3 m/s and 0.033 - 4.935 m/s, respectively.
FIGURE 1. Schematic diagram of experimental set-up
In the present experimental study, the water was supplied to pressure vessel C by pumping it from the water storage tank. The water was compressed using air from the air compressor before it flowed to the mixer E. The water
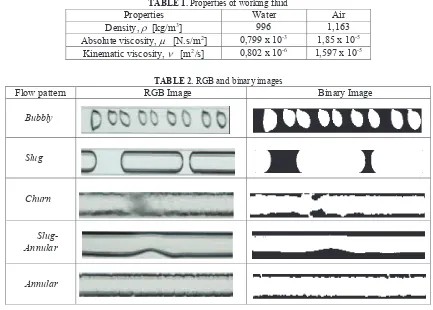
flowmeters were used to measure the flow rates. The pressurized air was flowed from the air compressor to the mixer through the water trap and air flow meters. Next, the mixture of air and water flowed to the test section and then flowed back to water storage tank. The video images of the test section were captured by using a high-speed video camera. Void fraction data were obtained by analyzing the videos and images. The principles of image processing are changing the Red Green Blue (RGB) images to binary images, as shown in Table 2. The dark color represents liquid phase while the white ones represent gas.
Flow pattern RGB Image Binary Image
Bubbly
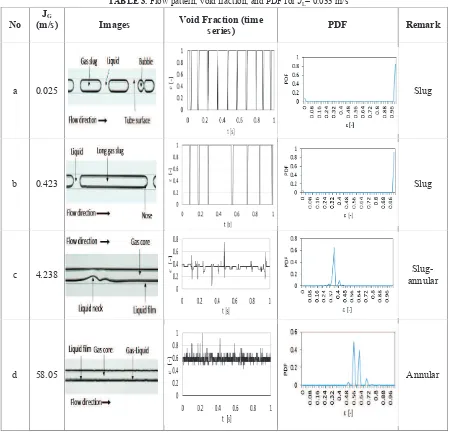
Flow patterns that were observed in this study are bubbly, slug, slug-annular, churn, and annular. Table 3- 5 show the relationship between the flow pattern, the void fraction for 1 second time series, and the void fraction PDF for each couple of JL and JG. Table. 3 (a) shows that at JL 0.033 m/s and JG 0.025 m/s, the flow pattern is a slug flow that
consists of the elongated bubbles which have relatively short lengths. Moreover, those elongated bubbles flow intermittently. Slug flow occurs at low to moderate JG and low to high JL. The air slug is observed as the long bubbles
or called as the elongated bubbles that have a length is about 3 times larger than its diameter. In mini and microchannels, the air slug geometry is similar to air plug. It can be seen in the time series graph of the void fraction that the void fraction magnitudes, H, are intermittently 0 (represents the liquid) and 1 (represents gas slug or bubble), but the gas slugs are much longer than liquid slugs. It is also clearly seen in the PDF graph that the dominant H is unity (slugs and bubbles) with PDF of 0.844, and the remaining is liquid. It means that gas phase is dominant in this flow
pattern. When JG increases to 0.423 m/s at the constant JL, the flow pattern remains as a slug. However, the size of
slugs become much longer. The slugs length reach 8-10 times the channel diameter (Table. 3b). It is also seen in the void fraction graph, where the void unity fractions are much longer than those on Table. 3a, and also the void fractions magnitude are 1 with a probability of 0.91. In this couple of JG and JL, long slugs are very dominant. Furthermore,
produced a liquid ring. In some points, the liquid rings are thicker than those in other points and form the liquid neck. The flow pattern is called slug-annular, as shown in Table. 3c.
TABLE 3. Flow pattern, void fraction, and PDF for JL= 0.033 m/s
No (m/s) JG Images Void Fraction (time series) PDF Remark
a 0.025 Slug
b 0.423 Slug
c 4.238 annular
Slug-d 58.05 Annular
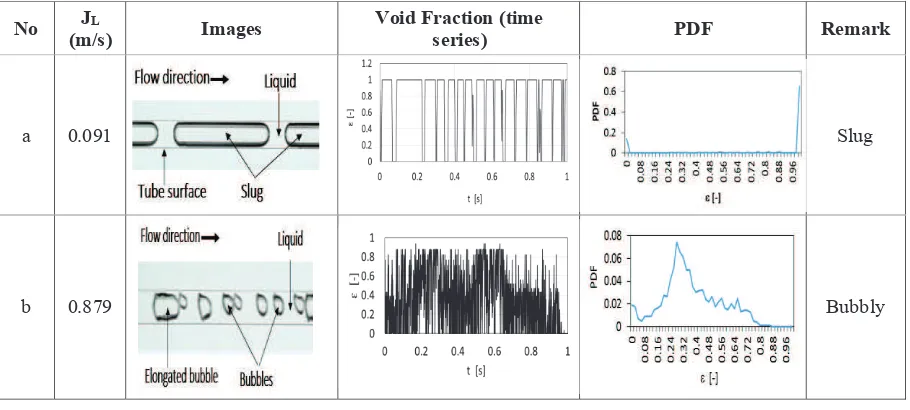
TABLE 4. Flow pattern, void fraction, and PDF for JG= 0.116 m/s.
No JL
(m/s) Images Void Fraction (time series) PDF Remark
a 0.091 Slug
b 0.879 Bubbly
TABLE 5. Flow pattern, void fraction, and PDF for JG= 22.26 m/s
No JL
(m/s) Images Void Fraction (time series) PDF Remark
a
0.033
Slug-annular
b
1.493
Churn
The slug-annular pattern is a transition from slug to annular flow. It can be seen in the void fraction graph that the average void fraction is approximately 0.35 and sometimes (at the liquid necks), the void fractions decrease significantly. The PDF graph shows that the void fractions of slug-annular are dominant at approximately 0.35 with a probability of 0.65.
Furthermore, when JG was increased to 58.05 m/s at constant JL, annular flow was observed. Annular flow occurs
at high gas superficial velocity and relatively low liquid superficial velocity. As shown in Table 3d, gas phase passing in the core of channel which occupied by liquid produces a gas core, and the liquid produces the liquid film at the channel wall. The liquid films are sometimes wavy. As shown in void fraction graph, void fractions for annular flow were fluctuated, but the increase or decrease are not significant. It indicates that the interface between liquid and gas is wavy or ripple. The void fraction magnitudes are distributed at between 0.48 to 0.72, and the peak is at the 0.56 with a probability of 0.49, as shown in PDF graph of Table 3d.
and small bubbles. Bubbly flows occur at very low JG and high JL (> 0.7 m/s). The image in Table 4b is an example
of the bubbly flow at JG = 0.116 m/s and JL = 0.879 m/s. Bubbly flow is characterized by the occurrence of air bubbles
with diameters smaller than channel size. This flow pattern appears at low gas superficial velocity and moderate to high water superficial velocity. The magnitude of void fractions disperses from 0 up to close to 1 (but, never reach unity). It means that in the bubble flow, the flow consists of liquid, small bubbles, big bubbles, elongated bubbles and sometimes accompanied by the emergence of air slugs. The diameter of bubbles and slugs is mostly smaller than channel diameter. The slug emergence may be caused by the coalescence of two or more bubbles or by the accumulation of air at the outlet side of the mixer due to low amount air discharge. This phenomenon can also be seen in the graph of void fraction time series, in which the void fraction increases abruptly and significantly at a certain period. It can be observed in the PDF graph that the flow is dominated by small bubbles (approximately 38 %). Unlike that in slug flow, the void fraction graph in bubbly flow shows the sharp curve shape. It means that the flow is dominated by bubbles and sometimes accompanied by elongated bubbles. The PDF graph indicates that the magnitudes of a void fraction are distributed at the range of 0 to 0.8 with various probabilities. This phenomenon means that the bubble sizes are varied widely.
Table 5 (a) reveals a slug-annular flow (like that shown in Table 3c as previously described) with much more liquid necks. The void fraction time series graph shows the fluctuation of magnitude, ranged from 0.25 up to 0.38. If
JL is increased to 1.493 m/s with constant JG (22.26 m/s), the flow pattern changes to churn flow. Churn flow is
characterized by disruptions in some of the flow area, as shown in Table 5b. We can also observe that the void fractions are disordered and fluctuate rapidly in the extreme magnitude. This is caused by the condition that at high both JG and
JL, air and water are mixed and flow together irregularly. In PDF graph, void fractions of churn flow are distributed
from 0 to 1. However, the dominant magnitude is in the interval of 0.45 to 0.75.
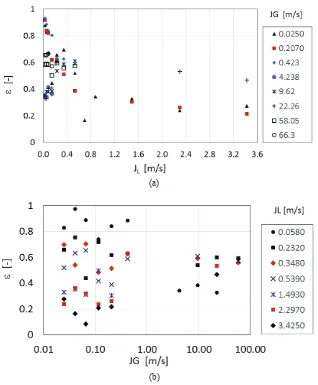
Figure 2 (a and b) illustrates the influence of JL and JG on void fraction. Fig. 2a shows that at low JG (0.0423 m/s),
an increase of JL causes a significant decrease in void fraction (H), meanwhile, at high JG (4.238 and higher) the
influence of JL on flow pattern is not clear. It can be explained that at low JG region the flow patterns are slug and
bubbly, which the slip ratios are close to unity. Therefore, the changes of JL result in a direct effect on the void
fractions, whereas at high JG the flow patterns are slug-annular, annular, and churn, which the slip ratios are higher
than unity. The changes of JL do not influence directly to the void fraction, but it directly influences on the slip ratios.
Similar to the explanation of Fig 2a, in Fig. 2b, the increase JG is not directly increased in a void fraction. We can
observe the extreme condition, when JG increases from 0.423 m/s to 4.238 m/s, the void fraction drops from 0.884 to
0.342, instead. It can be concluded that the influences of JL and JG to the void fraction is highly dependent on the flow
pattern and mostly associated with slip ratio.
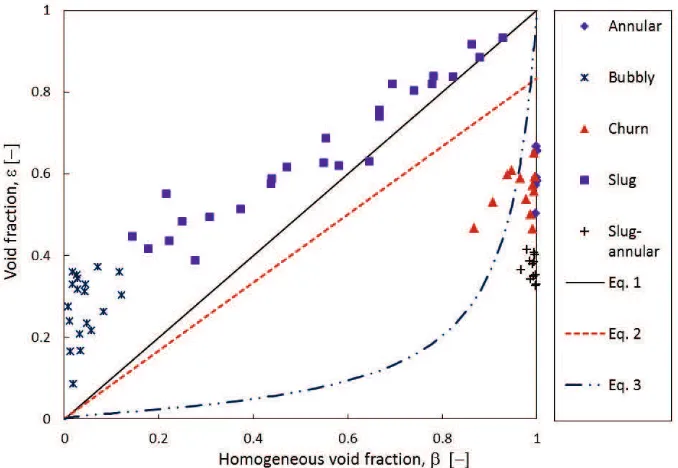
Figure 3 shows the present void fraction data, denoted by H, plotted against the homogeneous void fractions, represented by E, for all flow regimes. The data are also compared with other correlations. The linear solid line is a homogeneous line, Eq. 1, while the linear dotted line is the Armand type correlation [18], Eq. (2), which used previously by Ali et al. [5] and Serizawa et al. [9].
H= E
H = 0,833 E
where E = JG/( JG +JL) is the volumetric quality.
(a)
(b)
FIGURE 2. The influence of JG and JL on void fraction
The bottom dashed line is Kawahara’s correlation [8], represented by Eq. (3).
ߝ ൌ
ଵିǤଽఉǤଷఉబǤఱబǤఱ(3)
The data can be divided into three groups, those in the upper part of the homogeneous line (bubbly flow), those in the vicinity of the homogeneous line (slug flow) and those far below the homogeneous line (churn, slug-annular, and annular flow). All of the first group data values are higher than those of the homogeneous flow line. It indicates that the velocity of the liquid is higher than that of the gas, or the slip ratio is less than unity. It caused by the liquid dominant since for bubbly flow JL is much higher than JG. Slip ratio (S) is the ratio of gas velocity (vg) to liquid velocity
(vL), which among others expressed by Eq. (44) of Baretto et al. [13]. In general, for slug flow, gas and liquid flow
agreement with both of them. For the third group data, all H are smaller than E, caused by relatively high slip ratio, as previously explained by Kawahara et al. [8] and Saisorn and Wongwises [15].
FIGURE 3. The relation between homogeneous and measured void fraction data, compared with other correlations.
CONCLUDING REMARKS
An experimental study on the void fraction of air-water two-phase flow in a 1.6 mm diameter circular channel was carried out. Water and air were employed as the working fluids. The superficial gas and liquid velocities were varied in the range of 0.025 - 66.3 m/s and 0.033 - 4.935 m/s, respectively. The void fraction data were obtained on the basis of the image analysis. The results are summarized as follows:
1. Flow pattern plays an important role in predicting the void fraction.
2. For bubbly and slug flows, the void fractions increase with the increase of JG. The measured void fractions
are the same as or bigger than the homogeneous void fraction.
3. For churn, slug-annular, and annular flow patterns, there is no clear relation between JG and void fraction was
observed when JG was increased, because of the high slip ratio between gas and liquid.
4. It’s evident that, for bubbly and slug flows, the void fractions are close to the homogeneous line, while for churn, annular, and slug-annular flows that are far below the homogeneous line. It indicates that the slip ratios for the second group of flow patterns are higher than unity.
REFERENCES
1. K. A. Triplett, S. M. Ghiaasiaan, , S.I. Abdel-khalik, and D. L. Sadowski, Gas-Liquid two-phase flow in microchannels. Part I: Two-phase flow pattern. Int. J. Multiphase flow, 1999a, Vol. 25, pp. 377-394. 2. Y. Xu and X. Fang, Correlatin of void fraction for two-phase refrigerant flow in pipes, Applied Thermal
Engineering, 2014, Vol 64, pp 242-251.
3. S. Saisorn and S. Wongwises, An experimental investigation of two-phase air-water flow through a horizontal circular microchannel, Exp. Thermal and Fluid Science, 2009, Vol 33, pp 306-315.
4. M. Adineh, M. Nematollahi, and A. Erfaninia, Experimantal and numerical void fraction measurement for modeled two-phase flow inside a vertical pipe, Annals of Nuclear Energy, 2015, Vol 83, pp. 188-192. 5. M. I. Ali, M. Sadatomi, M. Kawaji, Two-phase flow in narrow channels between two flat plates. Can. J.
Chem. Eng., 1993,Vol. 71, pp. 657–666
6. K.Mishima and T. Hibiki, Some characteristics of air-water two-phase flow in small diameter vertical tubes, Int. J. Multiphase flow, 1996, Vol 2, pp. 703-712.
7. K. A. Triplett, S. M. Ghiaasiaan, , S.I. Abdel-khalik, and D. L. Sadowski, Gas-Liquid two-phase flow in microchannels. Part II: Void fraction and pressure drop.. Int. J. Multiphase flow, 1999b, Vol. 25, pp. 377-394.
8. A. Kawahara, P.M. Chung, M. Kawaji, Investigation of two-phase flow pattern, void fraction and pressure drop in a microchannel,Int. J. Multiphase Flow, 2002,Vol. 28, pp. 1411-1435.
9. A. Serizawa, Z. Feng, and Z. Kawara, Two-phase flow in microchannels.Exp Thermal fluid Sci., 2002, Vol. 26, pp. 703 – 714.
10. P.M.-Y. Chung and M. Kawaji, The effect of channel diameter on adiabatic two-phase flow characteristics in microchannel. Int. J. Multiphase flow, 2004,Vol. 30, pp. 735-761.
11. S. Saisorn and S. Wongwises, The effect of channel diameter on flow pattern, void fraction and pressure drop of two-phase air-water flow in circular microchannel, Exp. Thermal and Fluid Science, 2010, Vol 34, pp 454-462.
12. J. Jia, A. Babatunde, M. Wang, Void fraction measurement of gas-liquid two-phase flow from differential pressure, Flow Measurement and Instrumentation, 2015, Vol 41, pp 75-80.
13. E.X. Baretto, J.L.G. Oliveira, J.C. Passos, Frictional and void fraction analysis in air-water two-phase flow in a microchannel, Int. J. Multiphase Flow, 2015, Vol 72, pp. 1-10.
14. M. Adineh, M. Nematollahi, A. Erfaninia, Experimental and numerical void fraction measurement for modeled two-phase flow inside a vertical pipe, Anals of Nuclear Energy, 2015,Vol 83, pp. 188-192. 15. S. M. Ghiaasiaan, Two-Phase Flow, Boiling, and Condensation in Conventional and Miniature Systems,
Cambridge University Press. New York, USA, 2008.
16. Z.-Y. Bao, M. G. Bosnich, and B. S. Haynes, Estimation of void fraction and pressure drop for two-phase flow in fine passages, Trans. Inst. Chem. Eng., 1994, Vol 72A, pp. 625–532.
17. A. Kariyasaki, T. Fukano, A. Ousaka, and M. Kagawa, Isothermal air-water two-phase up- and downward flows in vertical capillary tube (1st report, Flow pattern and void fraction). Trans. JSME Ser. B., 1992, Vol. 58, pp. 2684–2690.