Ka-Chun Wong
Editor
Big Data
Big Data Analytics
in Genomics
Department of Computer Science City University of Hong Kong Kowloon Tong, Hong Kong
ISBN 978-3-319-41278-8 ISBN 978-3-319-41279-5 (eBook) DOI 10.1007/978-3-319-41279-5
Library of Congress Control Number: 2016950204
© Springer International Publishing Switzerland (outside the USA) 2016
Chapter 12 completed within the capacity of an US governmental employment. US copy-right protection does not apply.
This work is subject to copyright. All rights are reserved by the Publisher, whether the whole or part of the material is concerned, specifically the rights of translation, reprinting, reuse of illustrations, recitation, broadcasting, reproduction on microfilms or in any other physical way, and transmission or information storage and retrieval, electronic adaptation, computer software, or by similar or dissimilar methodology now known or hereafter developed.
The use of general descriptive names, registered names, trademarks, service marks, etc. in this publication does not imply, even in the absence of a specific statement, that such names are exempt from the relevant protective laws and regulations and therefore free for general use.
The publisher, the authors and the editors are safe to assume that the advice and information in this book are believed to be true and accurate at the date of publication. Neither the publisher nor the authors or the editors give a warranty, express or implied, with respect to the material contained herein or for any errors or omissions that may have been made.
Printed on acid-free paper
This Springer imprint is published by Springer Nature
At the beginning of the 21st century, next-generation sequencing (NGS) and third-generation sequencing (TGS) technologies have enabled high-throughput sequencing data generation for genomics; international projects (e.g., the Ency-clopedia of DNA Elements (ENCODE) Consortium, the 1000 Genomes Project, The Cancer Genome Atlas (TCGA), Genotype-Tissue Expression (GTEx) program, and the Functional Annotation Of Mammalian genome (FANTOM) project) have been successfully launched, leading to massive genomic data accumulation at an unprecedentedly fast pace.
To reveal novel genomic insights from those big data within a reasonable time frame, traditional data analysis methods may not be sufficient and scalable. Therefore, big data analytics have to be developed for genomics.
As an attempt to summarize the current efforts in big data analytics for genomics, an open book chapter call is made at the end of 2015, resulting in 40 book chapter submissions which have gone through rigorous single-blind review process. After the initial screening and hundreds of reviewer invitations, the authors of each eligible book chapter submission have received at least 2 anonymous expert reviews (at most, 6 reviews) for improvements, resulting in the current 13 book chapters.
Those book chapters are organized into three parts (“Statistical Analytics,” “Computational Analytics,” and “Cancer Analytics”) in the spirit that statistics form the basis for computation which leads to cancer genome analytics. In each part, the book chapters have been arranged from general introduction to advanced top-ics/specific applications/specific cancer sequentially, for the interests of readership. In the first part on statistical analytics, four book chapters (Chaps.1–4) have been contributed. In Chap.1, Yang et al. have compiled a statistical introduction for the integrative analysis of genomic data. After that, we go deep into the statistical methodology of expression quantitative trait loci (eQTL) mapping in Chap. 2 written by Cheng et al. Given the genomic variants mapped, Ribeiro et al. have contributed a book chapter on how to integrate and organize those genomic variants into genotype-phenotype networks using causal inference and structure learning in Chap.3. At the end of the first part, Li and Tong have given a refreshing statistical
perspective on genomic applications of the Neyman-Pearson classification paradigm in Chap.4.
In the second part on computational analytics, four book chapters (Chaps. 5–8) have been contributed. In Chap. 5, Gupta et al. have reviewed and improved the existing computational pipelines for re-annotating eukaryotic genomes. In Chap.6, Rucci et al. have compiled a comprehensive survey on the computational acceleration of Smith-Waterman protein sequence database search which is still central to genome research. Based on those sequence database search techniques, protein function prediction methods have been developed and demonstrated promising. Therefore, the recent algorithmic developments, remaining challenges, and prospects for future research in protein function prediction are discussed in great details by Shehu et al. in Chap. 7. At the end of the part, Nagarajan and Prabhu provided a review on the computational pipelines for epigenetics in Chap.8.
In the third part on cancer analytics, five chapters (Chaps.9–13) have been contributed. At the beginning, Prabahar and Swaminathan have written a reader-friendly perspective on machine learning techniques in cancer analytics in Chap.9. To provide solid supports for the perspective, Tong and Li summarize the existing resources, tools, and algorithms for therapeutic biomarker discovery for cancer analytics in Chap.10. The NGS analysis of somatic mutations in cancer genomes are then discussed by Prieto et al. in Chap.11. To consolidate the cancer analytics part further, two computational pipelines for cancer analytics are described in the last two chapters, demonstrating concrete examples for reader interests. In Chap. 12, Leung et al. have proposed and described a novel pipeline for statistical analysis of exonic variants in cancer genomes. In Chap.13, Yotsukura et al. have proposed and described a unique pipeline for understanding genotype-phenotype correlation in breast cancer genomes.
Kowloon Tong, Hong Kong Ka-Chun Wong
Part I Statistical Analytics
Introduction to Statistical Methods for Integrative Data
Analysis in Genome-Wide Association Studies. . . 3 Can Yang, Xiang Wan, Jin Liu, and Michael Ng
Robust Methods for Expression Quantitative Trait Loci Mapping. . . 25 Wei Cheng, Xiang Zhang, and Wei Wang
Causal Inference and Structure Learning
of Genotype–Phenotype Networks Using Genetic Variation. . . 89 Adèle H. Ribeiro, Júlia M. P. Soler, Elias Chaibub Neto, and André
Fujita
Genomic Applications of the Neyman–Pearson Classification Paradigm.. 145 Jingyi Jessica Li and Xin Tong
Part II Computational Analytics
Improving Re-annotation of Annotated Eukaryotic Genomes. . . 171
Pirasteh Pahlavan, Johannes Balkenhol, and Thomas Dandekar
State-of-the-Art in Smith–Waterman Protein Database Search
on HPC Platforms.. . . 197 Enzo Rucci, Carlos García, Guillermo Botella, Armando De
Giusti, Marcelo Naiouf, and Manuel Prieto-Matías
A Survey of Computational Methods for Protein Function Prediction. . . . 225 Amarda Shehu, Daniel Barbará, and Kevin Molloy
Genome-Wide Mapping of Nucleosome Position and Histone
Code Polymorphisms in Yeast. . . 299 Muniyandi Nagarajan and Vandana R. Prabhu
Part III Cancer Analytics
Perspectives of Machine Learning Techniques in Big Data
Mining of Cancer. . . 317 Archana Prabahar and Subashini Swaminathan
Mining Massive Genomic Data for Therapeutic Biomarker
Discovery in Cancer: Resources, Tools, and Algorithms . . . 337 Pan Tong and Hua Li
NGS Analysis of Somatic Mutations in Cancer Genomes. . . 357 T. Prieto, J.M. Alves, and D. Posada
OncoMiner: A Pipeline for Bioinformatics Analysis of Exonic
Sequence Variants in Cancer . . . 373 Ming-Ying Leung, Joseph A. Knapka, Amy E. Wagler,
Georgialina Rodriguez, and Robert A. Kirken
A Bioinformatics Approach for Understanding
Genotype–Phenotype Correlation in Breast Cancer. . . 397 Sohiya Yotsukura, Masayuki Karasuyama, Ichigaku Takigawa,
for Integrative Data Analysis in Genome-Wide
Association Studies
Can Yang, Xiang Wan, Jin Liu, and Michael Ng
Abstract Scientists in the life science field have long been seeking genetic variants associated with complex phenotypes to advance our understanding of complex genetic disorders. In the past decade, genome-wide association studies (GWASs) have been used to identify many thousands of genetic variants, each associated with at least one complex phenotype. Despite these successes, there is one major challenge towards fully characterizing the biological mechanism of complex diseases. It has been long hypothesized that many complex diseases are driven by the combined effect of many genetic variants, formally known as “polygenicity,” each of which may only have a small effect. To identify these genetic variants, large sample sizes are required but meeting such a requirement is usually beyond the capacity of a single GWAS. As the era of big data is coming, many genomic consortia are generating an enormous amount of data to characterize the functional roles of genetic variants and these data are widely available to the public. Integrating rich genomic data to deepen our understanding of genetic architecture calls for statistically rigorous methods in the big-genomic-data analysis. In this book chapter, we present a brief introduction to recent progresses on the development of statistical methodology for integrating genomic data. Our introduction begins with the discovery of polygenic genetic architecture, and aims at providing a unified statistical framework of integrative analysis. In particular, we highlight the
C. Yang () • M. Ng
Department of Mathematics, Hong Kong Baptist University, Kowloon Tong, Hong Kong e-mail:eeyang@hkbu.edu.hk;mng@math.hkbu.edu.hk
X. Wan
Department of Computer Science, Hong Kong Baptist University, Kowloon Tong, Hong Kong e-mail:xwan@comp.hkbu.edu.hk
J. Liu
Center of Quantitative Medicine, Duke-NUS Graduate Medical School, Singapore, Singapore e-mail:jin.liu@duke-nus.edu.sg
© Springer International Publishing Switzerland 2016 K.-C. Wong (ed.),Big Data Analytics in Genomics, DOI 10.1007/978-3-319-41279-5_1
importance of integrative analysis of multiple GWAS and functional information. We believe that statistically rigorous integrative analysis can offer more biologically interpretable inference and drive new scientific insights.
Keywords Statistics • SNP • Population genetics • Methodology • Genomic data
1
Introduction
Genome-wide association studies (GWAS) aim at studying the role of genetic vari-ations in complex human phenotypes (including quantitative traits and qualitative diseases) by genotyping a dense set of single-nucleotide polymorphisms (SNPs) across the whole genome. Compared with the candidate-gene approaches which only consider some regions chosen based on researcher’s experience, GWAS are intended to provide an unbiased examination of the genetic risk variants [46]. In 2005, the identification of the complement factor H for age-related macular degeneration in a small sample set (96 cases v.s. 50 controls) was the first successful example of searching for risk genes under the GWAS paradigm [31]. It was a milestone moment in the genetics community, and this result convinced researchers that GWAS paradigm would be powerful even with such a small sample size. Since then, an increasing number of GWAS have been conducted each year and significant risk variants have been routinely reported. As of December, 2015, more than 15,000 risk genetic variants have been associated with at least one complex phenotypes at the genome-wide significance level (p-value< 5108) [61].
The polygenicity of complex phenotypes has many important implications on the development of statistical methodology for genetic data analysis. First, the methods relying on “extremely sparse and large effects” may not work well because the sum of many small effects, which is non-negligible, has not been taken into account. Second, it is often challenging to pinpoint those variants with small effects only based on information from GWAS. Fortunately, an enormous amount of data from different perspectives to characterize human genome is being generated and much richer than ever. This motivates us to search for relevant information beyond GWAS (indirect evidence) and combine it with GWAS signals (direct evidence) to make more convincing inference [15]. However, it is not an easy task to integrate indirect evidence with direct evidence. A major challenge in integrative analysis is that the direct evidence and indirect evidence are often obtained from different data sources (e.g., different sample cohorts, different experimental designs). A naive combination may potentially lead to high false positive findings and misleading interpretation. Yet, effective methods that combine indirect evidence with direct evidence are still lacking [23]. In this book chapter, we offer an introduction to the statistical methods for integrative analysis of genomic data, and highlight their importance in the big genomic data era.
To provide a bird’s-eye view of integrative analysis of genomic data, we start with the introduction of heritability estimation because heritability serves as a fundamental concept which quantifies the genetic contribution to a phenotype [58]. A good understanding of heritability estimation offers valuable insights of the polygenic architecture of complex phenotypes. From a statistical point of view, it is the polygenicity that motivates integrative analysis of genomic data such that more genetic variants with small effects can be identified robustly. Our discussion of the statistical methods for integrative analysis will be divided into two sections: integrative analysis of multiple GWAS and integrative analysis of GWAS with genomic functional information. Then we demonstrate how to integrate multiple GWAS and functional information simultaneously in the case study section. At the end, we summarize this chapter with some discussions about the future directions of this area.
2
Heritability Estimation
The theoretical foundation of heritability estimation can be traced back to R. A. Fisher’s development [20], in which the phenotypic similarity between relatives is related to the degrees of genetic resemblance. In quantitative genetics, the phenotypic value (P) is modeled as the sum of genetic effects (G) and environmental effects (E),
whereis the population mean of the phenotype. To keep our introduction simple, GandEare assumed to be independent, i.e., Cov.G;E/D0. The genetic effect can be further decomposed into the additive effect (also known as the breeding value), the dominance effect and the interaction effect,GD ACDCI. Accordingly, the phenotype variance can be decomposed as
P2 DG2 CE2D.A2CD2CI2/CE2; (2)
where2
Gis the variance due to genetic variations,A2; D2; I2, andE2correspond to
the variance of additive effects, dominance effects, interaction effects (also known as epistasis), and environmental effects, respectively. Based on these variance components, two types of heritability are defined. The broad-sense heritability (H2)
is defined as the proportion of the phenotypic variance that can be attributed to the genetic factors,
H2D
2
G
2
P
D
2
ACD2CI2
2
ACD2CI2CE2
: (3)
The narrow-sense heritability (h2), however, focuses only on the contribution of the
additive effects:
h2D
2
A
2
ACE2
: (4)
Due to the law of inheritance, individuals can only transmit one allele of each gene to their offsprings, most relatives (except full siblings and monozygotic twins) share only one allele or no allele that is identical by descent (IBD). Therefore, the dominance effects and interaction effects will not contribute to their genetic resemblance as these effects are due to the sharing two IBD alleles. Accumulating evidence suggests that non-additive genetic effects on complex phenotypes may be negligible [28, 64,69]. For example, Yang et al. [64] reported that the additive effects of about 17 million imputed variants explained 56 % variance of human height, leaving a very small space for the non-additive effects to contribute. Zhu et al. [69] found the dominance effects on 79 quantitative traits explained little phenotypic variance. Therefore, we will ignore non-additive effects and concentrate our discussion on narrow-sense heritability in this book chapter.
2.1
The Basic Idea of Heritability Estimation
from Pedigree Data
of this issue. Assuming a number of conditions (e.g., random mating, no inbreeding, Hardy–Weinberg equilibrium, and linkage equilibrium), a simple formula for the genetic covariance between two relatives can be derived based on the additive variance component:
Cov.G1;G2/DK1;2A2; (5)
whereK1;2 is the expected proportion of their genomes sharing one chromosome
IBD. Let us take a parent–offspring pair as an example. Because the parent transmits one copy of each gene to his/her offspring, i.e., K1;2 D 12, thus their genetic
covariance is122
A. LetP1andP2be the phenotypic values (e.g., height) of the parent
and the offspring. Based on (1), we have Cov.P1;P2/DCov.G1;G2/CCov.E1;E2/.
Assuming the independence of the environmental factor, Cov.E1;E2/ D 0, we
further have
E, the phenotypic correlation can
be related to the narrow-sense heritabilityh2:
Corr.P1;P2/D
Suppose we have collected the phenotypic values of n parent–offspring pairs. A simple way to estimateh2based on this data set is to use the linear regression:
Pi2 DPi1ˇCˇ0Ci; (8)
whereiD1; : : : ;nis the index of samples,ˇis the regression coefficient, andiis
the residual of theith sample. The ordinary least square estimate ofˇis
O
values and offspring phenotypic values. Because ˇO is the sample version of the correlation given in (7), heritability estimated from parent–offspring pairs is given by twice of the regression slope, i.e.,hO2D2ˇO.
Another example of heritability estimation is based on the phenotypic values of two parents (P1andP2) and one offspring (P3). LetPMD P1C2P2 be the phenotypic
value of the mid-parent. Similarly, we have the genetic covariance Cov.PM;P3/D 1
A, and correlation between the mid-parent and
the offspring can be related to heritabilityh2as
Suppose we haventrio samplesfPi1;Pi2;Pi3g, where.Pi1;Pi2;Pi3/corresponds to
the phenotypic values of two parents and the offspring from theith sample. Again, a convenient way to estimateh2is to still use linear regression:
Pi3D
Pi1CPi2
2 ˇCˇ0Ci: (11)
Heritability estimated from the phenotypic values of mid-parents and offsprings can be read from the coefficient fitted in (11) ashO2D OˇD
3
Var.PM/1Cov
5
.PM;P3/.It is worth pointing out that the above methods for heritability estimation only make use of covariance information. In statistics, they are referred to as the methods of moments because covariance is the second moment. In fact, we can impose normality assumptions and reformulate heritability estimation using maximum likelihood estimator. Considering the parent–offspring case, we can view all the samples independently drawn from the following distribution:
wherePi1andPi2are the phenotypic values of the parent and offspring from theith
family. Similarly, we can view a trio samplePi1;Pi2;Pi3independently drawn from
the following distribution:
The restricted maximum likelihood (REML) approach can be used to efficiently compute the estimates of model parametersf; 2
A; E2gin (12) and (13). Then the
heritability estimation can be obtained as
O
2.2
Heritability Estimation Based on GWAS
As we discussed above, the heritability estimation based on pedigree data relies on the expected genome sharing between relatives. Nowadays, genome-wide dense SNP data provides an unprecedented opportunity to accurately characterize genome sharing. However, this advantage brings new challenges. First, three billion base pairs of human genome sequences are identical at more than 99.9 % of the sites due to the inheritance from the common ancestors. SNP-based data only records genotypes at some specific genome positions with single-nucleotide mutations, and thus SNP-based measures of genetic similarity are much lower than the 99.9 % similarity based on the whole genome DNA sequence. Second, SNP-based measures depend on the subset of SNPs genotyped in GWAS and their allele frequencies. Third, SNP-based measure can be affected by the quality control procedures used in GWAS.
Our discussion assumes that the SNPs used in heritability estimation are fixed. There are many different ways to characterize genome similarity based on these fixed SNPs, as discussed in [51]. Here, we choose the GCTA approach [66,67] as it is the most widely used one. Suppose we have collected the genotypes ofnsubjects in matrixGDŒgim2RnMand their phenotype in vectory2Rn1, whereMis the
number of SNP markers andgim 2 f0; 1; 2gis the numerical coding of the genotypes
at themth SNP of theith individual. Yang et al. [66,67] proposed to standardize the genotype matrixGas follows:
wimD
.gimfm/
p
2fm.1fm/M
; (15)
wherefmis the frequency of the reference allele. An underlying assumption in this
standardization is that lower frequency variants tend to have larger effects. Speed et al. [52] examined this assumption and concluded that it would be robust in both simulation studies and real data analysis. After standardization, an LMM is used to model the relationship between the phenotypic value and the genotypes:
yDXˇCWuCe; uN.0; u2I/;
eN .0; e2I/; (16)
whereX 2 Rnc is the fixed-effect design matrix collecting the intercept of the
regression model and all covariates, such as age, sex, and a few principal compo-nents (PC) of the genotype data (PCs are used for adjustment of the population structure [45]); ˇ is the vector of fixed effects; ucollects all the individual SNP effects which are considered as random, andecollects the random errors due to the environmental factors. Since bothuandeare Gaussian, they can be integrated out analytically, which yields the marginal distribution ofy:
yN .Xˇ;WWT2
uC
2
Efficient algorithms, such as AI-REML[25] and expectation-maximization (EM) algorithms [43], are available for estimating model parameters. Letf Oˇ;O2
u;Oe2gbe
the REML estimates. Then heritability can be estimated as
O
h2gD O
2
u
O
2
u C Oe2
; (18)
where hO2g is called chip heritability because it depends on the SNPs genotyped from chip. Since the genotyped SNPs only form a subset of all SNPs in the human genome, the chip heritability should be smaller than the narrow-sense heritability, i.e.,h2g h2. One can compare (17) with (12) and (13) to get some intuitive understandings. The matrixWWTcan be regarded as the genetic similarity
measured by the SNP data, which is the so-called genetic relatedness matrix (GRM). In this sense, heritability estimation based on GWAS data makes use of the realized genome similarity rather than the expected genome sharing in pedigree data analysis.
Although the idea of heritability estimation based on pedigree data and GWAS data looks similar, there is an important difference. The chip heritability can be largely inflated in presence of cryptical relatedness. Let us briefly discuss this issue so that readers can gain more insights on chip heritability estimation. Notice that chip heritability relies on GRM calculated using genotyped SNPs. However, this does not mean that GRM only captures information from genotyped SNPs because there exists linkage disequilibrium (LD, i.e., correlation) among genotyped SNPs and un-genotyped SNPs. In this situation, GRM indeed “sees” the un-genotyped SNPs partially due to the imperfect LD. Suppose a GWAS data set is comprised of many unrelated samples and a few relatives, which is ready for the chip heritability estimation. Consider an extreme case that there is a pair of identical twins whose genomes will be the same ideally. Thus, their genotyped SNPs can capture more information from their un-genotyped SNPs because their chromosomes are highly correlated. For unrelated individuals, however, their chromosomes can be expected to be nearly uncorrelated such that their genotyped SNPs capture less information from the un-genotyped SNPs. As a result, the chip heritability estimation will be inflated even though a few relatives are included. To avoid the inflation due to the cryptical relatedness, Yang et al. [66,67] advocated to use samples that are less related than the second degree relative.
From the statistical point of view, a remaining issue is whether the statistical estimate can be done efficiently using unrelated samples, where sample size n is much smaller than the number of SNPs M. This is about whether variance component estimation can be done in the high dimensional setting. The problem is challenging because all the SNPs are included for heritability estimation but most of them are believed to be irrelevant to the phenotype of interest. In other words, the GCTA approach assumed the nonzero effects of all genotyped SNPs in LMM, leading to misspecified LMM when most of the included SNPs have no effects. Recently, a theoretical study [30] has showed that the REML estimator in the misspecified LMM is still consistent under some regularity conditions, which provides a justification of the GCTA approach. Heritability estimation is still a hot research topic. For more detailed discussion, interested readers are referred to [13,26,32,68].
3
Integrative Analysis of Multiple GWAS
In this section, we will introduce the statistical methods for integrative analysis of multiple GWAS of different phenotypes, which is motivated from both biological and statistical perspectives. The biological basis to perform integrative analysis is the fact that a single locus can affect multiple seemly unrelated phenotypes, which is known as “pleiotropy” [53]. Recently, an increasing number of reports have indicated abundant pleiotropy among complex phenotypes [49,50]. Examples includeTERT-CLPTM1Lassociated with both bladder and lung cancers [21] and PTPN22associated with multiple auto-immune disorders [10]. On the other hand, polygenicity imposes great statistical challenges in identification of weak genetic effects. The existence of pleiotropy allows us to combine information from multiple seemingly unrelated phenotypes. Indeed, recent discoveries along this line are fruitful [63], e.g., the discovery of pleiotropic loci affecting multiple psychiatric disorders [12] and the identification of pleiotropy between schizophrenia and immune disorders [48,60].
Before we proceed, we first introduce a concept closely related to pleiotropy— genetic correlation (denoted as ; also known as co-heritability) [11]. Let us consider GWAS of two distinct phenotypes without overlapped samples. Denote the phenotypes and standardized genotype matrices asy.k/2Rnk1andW.k/ 2RnkM,
respectively, whereM is the total number of genotyped SNPs andnkis the sample
size of thekth GWAS,kD1; 2. Bivariate LMM can be written as follows:
y.1/ DX.1/ˇ.1/CW.1/u.1/Ce.1/; (19) y.2/ DX.2/ˇ.2/CW.2/u.2/Ce.2/; (20)
whereX.k/collects all the covariates of thekth GWAS andˇ.k/is the corresponding
e.k/is the independent noise due to environment. Denote themth element ofu.1/and
u.2/asu.1/m andu.2/m , respectively. In bivariate LMM,Œu.1/m;u.2/mT (mD1; : : : ;M) are
assumed to be independently drawn from the bivariate normal distribution:
"
u.1/m
u.2/m
#
N .
0 0
;
2
1 12
12 22
/;
whereis defined to be the heritability of the two phenotypes. In this regard, co-heritability is a global measure of the genetic relationship between two phenotypes while detection of loci with pleiotropy is a local characterization.
In the past decades, accumulating GWAS data allows us to investigate co-heritability and pleiotropy in a comprehensive manner. First, European Genome-phenome Archive (EGA) and The database of Genotypes and Phenotypes (dbGap) have collected an enormous amount of genotype and phenotype data at the individual level. Second, the summary statistics from many GWAS are directly downloadable through public gateways, such as the websites of the GIANT consortium and the Psychiatric Genomics Consortium (PGC). Third, databases have been built up to collect the output of published GWAS. For example, the Genome-Wide Repository of Associations between SNPs and Phenotypes (GRASP) database has been developed for such a purpose [36]. Very recently, GRASP has been updated [17] to provide latest summary of GWAS output—about 8.87 million SNP-phenotype associations in 2082 studies withp-values0:05.
4
Integrative Analysis of GWAS with Functional Information
Besides integrating multiple GWAS, integrative analysis of GWAS with functional information is also a very promising strategy to explore the genetic architectures of complex phenotypes. Accumulating evidence suggests that this strategy can effectively boost the statistical power of GWAS data analysis [5]. The reason for such an improvement is that SNPs do not make equal contributions to a phenotype and a group of functionally related SNPs can contribute much more than the average, which is known as “functional enrichment” [19,54]. For example, an SNP that plays a role in the central nervous system (CNS) is more likely to be involved in psychiatric disorders than a randomly selected SNP [11]. As a matter of fact, not only can functional information help to improve the statistical power, but also offer deeper understanding on biological mechanisms of complex phenotypes. For instance, the integration of functional information into GWAS analysis suggests a possible connection between the immune system and schizophrenia [48,60]. How-ever, the fine-grained characterization of the functional role of genetic variations was not widely available until recent years.
In 2012, the Encyclopedia of DNA Elements (ENCODE) project [9] reported a quality functional characterization of the human genome. This report high-lighted the regulatory role of non-coding variants, which helped to explain the fact that about 85 % of the GWAS hits are in the non-coding region of human genome [29]. More specifically, the analysis results from the ENCODE project showed that 31 % of the GWAS hits overlap with transcription factor binding sites and 71 % overlap with DNase I hypersensitive sites, indicating the functional roles of GWAS hits. Afterwards, large genomic consortia started generating an enormous amount of data to provide functional annotation of the human genome. The Roadmap Epigenomics project [33] aims at providing the epigenome reference of more than one hundred tissues and cell types to tackle human diseases. Besides the epigenome reference, the Genotype-Tissue Expression project (GTEx) [39] has been initiated to collect about 20,000 tissues from 900 donors, serving as a comprehensive atlas of gene expression and regulation. Based on the data collected from 175 individuals across 43 tissues, GTEx [2] has reported a pilot analysis result of the gene expression patterns across tissues, including identification of thousands of shared and tissue-specific eQTL. Clearly, the integration of GWAS and functional information is calling effective methods that hardness such a rich data resources [47].
To introduce the key idea of integrative analysis of GWAS with functional information, we briefly discuss a Bayesian method [6] to see the advantages of statistically rigorous methods. Suppose we have collected n samples with their phenotypic valuesy 2 Rn and genotypes in X 2 RnM. Following the typical practice, we assume the linear relationship betweenyandX:
yiDˇ0C
M
X
jD1
where ˇj;j D 1; : : : ;M are the coefficients and ei is the independent noise
ei N .0; e2/. Identification of risk variants can be viewed as determination of
the nonzero coefficients in ˇ D Œˇ1; : : : ; ˇMT. Next, we use a binary variable
D Œ1; : : : ; Mto indicate whether the correspondingˇjis zero or not:ˇj D0if
and only ifjD0. The spike and slab prior [44] is assigned forˇj:
ˇjN .0; ˇ2/; ifjD1;
ˇjD0; ifjD0; (22)
where Pr.jD1/D and Pr.jD0/D 1. Following the standard procedure
in Bayesian inference, the remaining is to calculate the posterior Pr.jy;X/based on Markov chain Monte Carlo (MCMC) method. Although the computational cost of MCMC can be expensive, efficient variational approximation can be used [3,7].
Suppose we have extracted functional information from the reference data of high quality, such as Roadmap [33] and GTEx [39] and collected them in anMDmatrix, denoted asA. Each row ofAcorresponds to an SNP and each column corresponds to a functional category. For example, if theith SNP is known to play a role in the d-functional category from the reference data, then we putAjd D 1andAjd D 0
otherwise. To keep our notation simple, we useAj 2 R1D to index thejth row
ofA. Note that functional information inAmay come from different studies. It is inappropriate to conclude that SNPs being annotated inAare more useful because the relevance of such functional information has not been examined yet.
To determine the relevance of functional information, statistical modeling plays a critical role. Indeed, functional informationAj of thejth SNP can be naturally
related to its association statusjis using a logistic model [6]:
logPr.jD1jAj/ Pr.jD0jAj/ D
AjC0; (23)
where 2 RDand0 2 Rare the logistic regression coefficients to be estimated.
Clearly, when there are nonzero entries in, the prior of the association statusjwill
be modulated by its functional annotationaj, indicating the relevance of functional
annotation. More rigorously, a Bayes factor ofcan be computed to determine the relevance of function information. In summary, statistical methods allow a flexible way to incorporate functional information into the model and adaptively determine the relevance of such kind of information.
5
Case Study
simultaneously. To be more specific, we consider our GPA (Genetic analysis incorporating Pleiotropy and Annotation) approach [8] as a case study.
In contrast to the method discussed in the previous sections, GPA takes sum-mary statistics and functional annotations as its input. Let us begin with the simplest case where we have only p-values from one GWAS data set, denoted asfp1;p2; : : : ;pj; : : : ;pMg, where M is the number of SNPs. Following the
“two-groups model” [16], we assume the observedp-values from a mixture of null and non-null distributions, with probability 0 and1 D 10, respectively. Here
we choose the null distribution to be the Uniform distribution on [0,1], denoted as
UŒ0; 1, and the non-null distribution to be the Beta distribution with parameters (˛; 1), denoted as B.˛; 1/, respectively. Again, we introduce a binary variable Zj 2 f0; 1g to indicate the association status of thejth SNP:Zj D 0means null
andZjD1means non-null. Then the two-groups model can be written as
0 DPr.ZjD0/WpjUŒ0; 1;ifZjD0;
1 DPr.ZjD1/WpjB.˛; 1/;ifZjD1; (24)
where0C1D1and0 < ˛ < 1. An efficient EM algorithm can be easily derived
if the independence among the SNP markers is assumed, as detailed in the GPA paper. Let‚O D f O0;O1;˛Ogbe the estimated model parameters, then the posterior is
given as
b
Pr.ZjD0jpjI O‚/D O
0
O
0C O1fB.pjI O˛/
; (25)
wherefB.pI˛/D˛p˛1is the density function ofB.˛; 1/. Indeed, this posterior is
known as the local false discovery rate [14], which is widely used in the type I error control.
To explore pleiotropy between two GWAS, the above two-groups model can be extended to a four-groups model. Suppose we have collectedp-values from two GWAS and denote thep-value of thejth SNP asfpj1;pj2g;jD 1; : : : ;M. LetZj1 2
f0; 1gandZj2 2 f0; 1gbe the indicator of association status of thejth SNP in two
GWAS. Then the four-groups model can be written as
00 DPr.Zj1D0;Zj2D0/Wpj1UŒ0; 1;pj2UŒ0; 1;ifZj1D0;Zj2 D0;
10 DPr.Zj1D1;Zj2D0/Wpj1B.˛1; 1/;pj2UŒ0; 1;ifZj1D1;Zj2 D0;
01 DPr.Zj1D0;Zj2D1/Wpj1UŒ0; 1;pj2B.˛2; 1/;ifZj1D0;Zj2 D1;
11 DPr.Zj1D1;Zj2D1/Wpj1B.˛1; 1/;pj2B.˛2; 1/;ifZj1 D1;Zj2D1;
where0 < ˛1 < 1,0 < ˛2 < 1and00C10C01C11 D1. The four-groups
model takes pleiotropy into account by allowing the correlation betweenZj1andZj2.
It is easy to see that the correlation Corr.Zj1;Zj2/¤0if11 ¤.10C11/.01C
designed to examine whether the overlapping of risk variants between two GWAS is different from the overlapping just by chance. The testing result can be viewed as an indicator of pleiotropy.
To incorporate functional annotations, GPA assumes that all the functional annotations are independent after conditioning on the association status. Again, let A 2 RMDbe the annotation matrix, whereAjd D 1corresponds to the jth SNP
being annotated in thedth functional category, andAjd D0otherwise. Therefore, in
the two-groups model (24), the conditional probability of thedth annotation can be written as
q0dDPr.AjdD1jZjD0/; q1dDPr.AjdD1jZjD1/; (26)
where q0d and q1d are GPA model parameters which can be estimated by the
EM algorithm. Readers who are familiar with classification can easily recognize that (26) is the Naive Bayes formulation with latent class label, while (23) is a logistic regression with latent class label. Latent space plays a very important role in integrative analysis, in which indirect information (annotation data) can be com-bined with direct information (p-values). Under a coherent statistical framework, we are able to employ statistically efficient methods for parameter estimation rather than relying on ad-hoc rules. Let‚O D f O0;O1;˛; .O qO1d;qO0d/dD1;:::;Dgbe the estimated
functional enrichment in thedth annotation. Hypothesis testing H0 W q0d D q1d
can be used to declare the significance of the enrichment. Similarly, functional annotations can be incorporated into the four-groups model as follows:
q00d DPr.AjdD1jZj1D0;Zj2D0/;
q10d DPr.AjdD1jZj1D1;Zj2D0/;
q01d DPr.AjdD1jZj1D0;Zj2D1/;
q11d DPr.AjdD1jZj1D1;Zj2D1/: (28)
some brief discussions. First, more significant GWAS hits with controlled false discovery rates can be identified by integrative analysis of GWAS and functional information, as shown in Tables1and2. Second, we can see the pleiotropic effects exist between SCZ and BPD (the estimated shared proportionO110:15). Indeed,
such pleiotropy information boosts the statistical power a lot. Third, functional information (the CNS annotation) further helps improve the statistical power, although its contribution is less than pleiotropy in this real data analysis. This suggests that pleiotropy and functional information are complementary to each other and both of them are necessary.
Table 1 Single-GWAS analysis of SCZ and BPD (with or without the CNS annotation)
No. hits No. hits
0.196 0.596 0.203 0.283 409 902
(0.004) (0.004) (0.001) (0.003) BPD (with
annotation)
0.179 0.697 0.202 0.297 14 43
(0.004) (0.004) (0.001) (0.004)
The values in the brackets are standard errors of the corresponding estimates
Table 2 Integrative analysis of SCZ and BPD (with or without the CNS annotation)
O
00 10O 01O 11O ˛1O ˛2O
Without annotation
0.816 0.006 0.027 0.152 0.579 (0.004) 0.671 (0.007)
(0.004) (0.005) (0.006) (0.006) With
annotation
0.815 0.007 0.029 0.149 0.577 (0.003) 0.670 (0.007)
(0.004) (0.005) (0.007) (0.006)
0.207 0.014 0.103 0.318 818 (SCZ); 1492 (SCZ);
6
Future Directions and Conclusion
Although the analysis result from the GPA approach looks promising, there are some limitations. First, the GPA approach assumed the independence among the SNP markers, implying that the linkage disequilibrium (LD) among SNP markers was not taken into account. Second, the GPA approach assumed the conditional independence among functional annotations, which may not be true in presence of multiple annotations. All these limitations should be addressed in the future. Recently, a closely related approach, the LD-score method [4], has been proposed to analyze GWAS data based on summary statistics, in which LD has been explicitly taken into account. This method can be used for heritability (and co-heritability) estimation, as well as the detection of functional enrichment [19]. However, some empirical studies have shown that the standard error of the LD-score method is nearly twice of that of the REML estimate [65], indicating that this method is far less efficient than REML and thus the large sample size is required to ensure its effectiveness. More statistically efficient methods are still in high demand to address this issue.
In summary, we have provided a brief introduction to integrative analysis of GWAS and functional information, including heritability estimation and risk variant identification. Facing the challenges raised by the polygenicity, it is highly demanded to perform integrative analysis from both biological and statistical per-spectives. Novel approaches which take LD into account when integrating summary statistics with functional information will be greatly needed in the future. There are also many issues remaining in the study of functional enrichment. Recently, more and more functional enrichments have been observed in a variety of studies [19,55]. However, most of the enrichment is often too general to provide phenotype-specific information. For example, coding regions and transcription factor binding sites are generally enriched in various types of phenotypes. We are drown-ing in cross-phenotype functional enrichment but starvdrown-ing for phenotype-specific knowledge—how does a functional unit of human genome affect a phenotype of interest. Adjusting for the common enrichment (viewed as confounding factors here), rigorous methods for detecting phenotype-specific patterns will be highly appreciated.
References
1. Hana Lango Allen, Karol Estrada, Guillaume Lettre, Sonja I Berndt, Michael N Weedon, Fernando Rivadeneira, and et al. Hundreds of variants clustered in genomic loci and biological pathways affect human height.Nature, 467(7317):832–838, 2010.
2. Kristin G Ardlie, David S Deluca, Ayellet V Segrè, Timothy J Sullivan, Taylor R Young, Ellen T Gelfand, Casandra A Trowbridge, Julian B Maller, Taru Tukiainen, Monkol Lek, et al. The Genotype-Tissue Expression (GTEx) pilot analysis: Multitissue gene regulation in humans. Science, 348(6235):648–660, 2015.
3. Christopher M Bishop and Nasser M Nasrabadi. Pattern recognition and machine learning, volume 1. Springer New York, 2006.
4. Brendan K Bulik-Sullivan, Po-Ru Loh, Hilary K Finucane, Stephan Ripke, Jian Yang, Nick Patterson, Mark J Daly, Alkes L Price, Benjamin M Neale, Schizophrenia Working Group of the Psychiatric Genomics Consortium, et al. LD score regression distinguishes confounding from polygenicity in genome-wide association studies.Nature genetics, 47(3):291–295, 2015. 5. Rita M Cantor, Kenneth Lange, and Janet S Sinsheimer. Prioritizing GWAS results: a review of statistical methods and recommendations for their application. The American Journal of Human Genetics, 86(1):6–22, 2010.
6. Peter Carbonetto and Matthew Stephens. Integrated enrichment analysis of variants and pathways in genome-wide association studies indicates central role for il-2 signaling genes in type 1 diabetes, and cytokine signaling genes in Crohn’s disease. PLoS Genet, 9(10):1003770, 2013.
7. Peter Carbonetto, Matthew Stephens, et al. Scalable variational inference for Bayesian variable selection in regression, and its accuracy in genetic association studies. Bayesian Analysis, 7(1):73–108, 2012.
8. Dongjun Chung, Can Yang, Cong Li, Joel Gelernter, and Hongyu Zhao. GPA: A Statistical Approach to Prioritizing GWAS Results by Integrating Pleiotropy and Annotation. PLoS genetics, 10(11):e1004787, 2014.
9. ENCODE Project Consortium et al. An integrated encyclopedia of DNA elements in the human genome.Nature, 489(7414):57–74, 2012.
10. Chris Cotsapas, Benjamin F Voight, Elizabeth Rossin, Kasper Lage, Benjamin M Neale, Chris Wallace, Gonçalo R Abecasis, Jeffrey C Barrett, Timothy Behrens, Judy Cho, et al. Pervasive sharing of genetic effects in autoimmune disease.PLoS genetics, 7(8):e1002254, 2011. 11. Cross-Disorder Group of the Psychiatric Genomics Consortium. Genetic relationship between
five psychiatric disorders estimated from genome-wide SNPs.Nature genetics, 45(9):984–994, 2013.
12. Cross-Disorder Group of the Psychiatric Genomics Consortium. Identification of risk loci with shared effects on five major psychiatric disorders: a genome-wide analysis.Lancet, 2013. 13. Gustavo de los Campos, Daniel Sorensen, and Daniel Gianola. Genomic heritability: what is
it?PLoS Genetics, 10(5):e1005048, 2015.
14. B. Efron. Large-Scale Inference: Empirical Bayes Methods for Estimation, Testing, and Prediction. Cambridge University Press, 2010.
15. Bradley Efron. The future of indirect evidence. Statistical science: a review journal of the Institute of Mathematical Statistics, 25(2):145, 2010.
16. Bradley Efron et al. Microarrays, empirical Bayes and the two-groups model. STAT SCI, 23(1):1–22, 2008.
17. John D Eicher, Christa Landowski, Brian Stackhouse, Arielle Sloan, Wenjie Chen, Nicole Jensen, Ju-Ping Lien, Richard Leslie, and Andrew D Johnson. GRASP v2. 0: an update on the Genome-Wide Repository of Associations between SNPs and phenotypes. Nucleic acids research, 43(D1):D799–D804, 2015.
19. Hilary K Finucane, Brendan Bulik-Sullivan, Alexander Gusev, Gosia Trynka, Yakir Reshef, Po-Ru Loh, Verneri Anttila, Han Xu, Chongzhi Zang, Kyle Farh, et al. Partitioning heritability by functional annotation using genome-wide association summary statistics. Nature genetics, 47(11):1228–1235, 2015.
20. R. A. Fisher. The correlations between relatives on the supposition of Mendelian inheritance. Philosophical Transactions of the Royal Society of Edinburgh, 52:399–433, 1918.
21. Olivia Fletcher and Richard S Houlston. Architecture of inherited susceptibility to common cancer. Nature Reviews Cancer, 10(5):353–361, 2010.
22. Mary D Fortune, Hui Guo, Oliver Burren, Ellen Schofield, Neil M Walker, Maria Ban, Stephen J Sawcer, John Bowes, Jane Worthington, Anne Barton, et al. Statistical colocalization of genetic risk variants for related autoimmune diseases in the context of common controls. Nature genetics, 47(7):839–846, 2015.
23. Eric R Gamazon, Heather E Wheeler, Kaanan P Shah, Sahar V Mozaffari, Keston Aquino-Michaels, Robert J Carroll, Anne E Eyler, Joshua C Denny, Dan L Nicolae, Nancy J Cox, et al. A gene-based association method for mapping traits using reference transcriptome data. Nature genetics, 47(9):1091–1098, 2015.
24. Claudia Giambartolomei, Damjan Vukcevic, Eric E Schadt, Lude Franke, Aroon D Hingorani, Chris Wallace, and Vincent Plagnol. Bayesian test for colocalisation between pairs of genetic association studies using summary statistics.PLoS Genetics, 10(5):e1004383, 2014. 25. Arthur R Gilmour, Robin Thompson, and Brian R Cullis. Average information REML: an
efficient algorithm for variance parameter estimation in linear mixed models.Biometrics, pages 1440–1450, 1995.
26. David Golan, Eric S Lander, and Saharon Rosset. Measuring missing heritability: Inferring the contribution of common variants. Proceedings of the National Academy of Sciences, 111(49):E5272–E5281, 2014.
27. Anthony J.F. Griffiths, Susan R. Wessler, Sean B. Carroll, and John Doebley.An introduction to genetic analysis, 11 edition. W. H. Freeman, 2015.
28. William G Hill, Michael E Goddard, and Peter M Visscher. Data and theory point to mainly additive genetic variance for complex traits.PLoS Genet, 4(2):e1000008, 2008.
29. L.A. Hindorff, P. Sethupathy, H.A. Junkins, E.M. Ramos, J.P. Mehta, F.S. Collins, and T.A. Manolio. Potential etiologic and functional implications of genome-wide association loci for human diseases and traits. Proceedings of the National Academy of Sciences, 106(23):9362, 2009.
30. Jiming Jiang, Cong Li, Debashis Paul, Can Yang, and Hongyu Zhao. High-dimensional genome-wide association study and misspecified mixed model analysis. arXiv preprint arXiv:1404.2355, to appear in Annals of statistics, 2014.
31. Robert J Klein, Caroline Zeiss, Emily Y Chew, Jen-Yue Tsai, Richard S Sackler, Chad Haynes, Alice K Henning, John Paul SanGiovanni, Shrikant M Mane, Susan T Mayne, et al. Complement factor h polymorphism in age-related macular degeneration. Science, 308(5720):385–389, 2005.
32. Siddharth Krishna Kumar, Marcus W Feldman, David H Rehkopf, and Shripad Tuljapurkar. Limitations of GCTA as a solution to the missing heritability problem. Proceedings of the National Academy of Sciences, 113(1):E61–E70, 2016.
33. Anshul Kundaje, Wouter Meuleman, Jason Ernst, Misha Bilenky, Angela Yen, Alireza Heravi-Moussavi, Pouya Kheradpour, Zhizhuo Zhang, Jianrong Wang, Michael J Ziller, et al. Integrative analysis of 111 reference human epigenomes. Nature, 518(7539):317–330, 2015. 34. S Hong Lee, Teresa R DeCandia, Stephan Ripke, Jian Yang, Patrick F Sullivan, Michael E
Goddard, and et al. Estimating the proportion of variation in susceptibility to schizophrenia captured by common SNPs.Nature genetics, 44(3):247–250, 2012.
35. SH Lee, J Yang, ME Goddard, PM Visscher, and NR Wray. Estimation of pleiotropy between complex diseases using SNP-derived genomic relationships and restricted maximum likelihood.Bioinformatics, page bts474, 2012.
37. Cong Li, Can Yang, Joel Gelernter, and Hongyu Zhao. Improving genetic risk prediction by leveraging pleiotropy. Human genetics, 133(5):639–650, 2014.
38. James Liley and Chris Wallace. A pleiotropy-informed Bayesian false discovery rate adapted to a shared control design finds new disease associations from GWAS summary statistics.PLoS genetics, 11(2):e1004926, 2015.
39. John Lonsdale, Jeffrey Thomas, Mike Salvatore, Rebecca Phillips, Edmund Lo, Saboor Shad, Richard Hasz, Gary Walters, Fernando Garcia, Nancy Young, et al. The genotype-tissue expression (GTEx) project.Nature genetics, 45(6):580–585, 2013.
40. Michael Lynch, Bruce Walsh, et al. Genetics and analysis of quantitative traits, volume 1. Sinauer Sunderland, MA, 1998.
41. Robert Maier, Gerhard Moser, Guo-Bo Chen, Stephan Ripke, William Coryell, James B Potash, William A Scheftner, Jianxin Shi, Myrna M Weissman, Christina M Hultman, et al. Joint analysis of psychiatric disorders increases accuracy of risk prediction for schizophrenia, bipolar disorder, and major depressive disorder. The American Journal of Human Genetics, 96(2):283–294, 2015.
42. Teri A Manolio, Francis S Collins, Nancy J Cox, David B Goldstein, Lucia A Hindorff, David J Hunter, Mark I McCarthy, Erin M Ramos, Lon R Cardon, Aravinda Chakravarti, et al. Finding the missing heritability of complex diseases. Nature, 461(7265):747–753, 2009.
43. Geoffrey McLachlan and Thriyambakam Krishnan.The EM algorithm and extensions, volume 382. John Wiley & Sons, 2008.
44. Toby J Mitchell and John J Beauchamp. Bayesian variable selection in linear regression. Journal of the American Statistical Association, 83(404):1023–1032, 1988.
45. Alkes L Price, Nick J Patterson, Robert M Plenge, Michael E Weinblatt, Nancy A Shadick, and David Reich. Principal components analysis corrects for stratification in genome-wide association studies.Nature genetics, 38(8):904–909, 2006.
46. Neil Risch, Kathleen Merikangas, et al. The future of genetic studies of complex human diseases. Science, 273(5281):1516–1517, 1996.
47. Marylyn D Ritchie, Emily R Holzinger, Ruowang Li, Sarah A Pendergrass, and Dokyoon Kim. Methods of integrating data to uncover genotype-phenotype interactions.Nature Reviews Genetics, 16(2):85–97, 2015.
48. Schizophrenia Working Group of the Psychiatric Genomics Consortium. Biological insights from 108 schizophrenia-associated genetic loci.Nature, 511(7510):421–427, 2014.
49. Shanya Sivakumaran, Felix Agakov, Evropi Theodoratou, et al. Abundant pleiotropy in human complex diseases and traits.AM J HUM GENET, 89(5):607–618, 2011.
50. Nadia Solovieff, Chris Cotsapas, Phil H Lee, Shaun M Purcell, and Jordan W Smoller. Pleiotropy in complex traits: challenges and strategies. Nature Reviews Genetics, 14(7): 483– 495, 2013.
51. Doug Speed and David J Balding. Relatedness in the post-genomic era: is it still useful?Nature Reviews Genetics, 16(1):33–44, 2015.
52. Doug Speed, Gibran Hemani, Michael R Johnson, and David J Balding. Improved heri-tability estimation from genome-wide SNPs. The American Journal of Human Genetics, 91(6):1011–1021, 2012.
53. Frank W Stearns. One hundred years of pleiotropy: a retrospective.Genetics, 186(3):767–773, 2010.
54. Aravind Subramanian, Pablo Tamayo, Vamsi K Mootha, Sayan Mukherjee, Benjamin L Ebert, Michael A Gillette, Amanda Paulovich, Scott L Pomeroy, Todd R Golub, Eric S Lander, et al. Gene set enrichment analysis: a knowledge-based approach for interpreting genome-wide expression profiles. Proceedings of the National Academy of Sciences of the United States of America, 102(43):15545–15550, 2005.
56. Shashaank Vattikuti, Juen Guo, and Carson C Chow. Heritability and genetic correlations explained by common SNPs for metabolic syndrome traits. PLoS genetics, 8(3):e1002637, 2012.
57. Peter M Visscher, Matthew A Brown, Mark I McCarthy, and Jian Yang. Five years of GWAS discovery.The American Journal of Human Genetics, 90(1):7–24, 2012.
58. Peter M Visscher, William G Hill, and Naomi R Wray. Heritability in the genomics era-concepts and misconceptions.Nature Reviews Genetics, 9(4):255–266, 2008.
59. Peter M Visscher, Sarah E Medland, MA Ferreira, Katherine I Morley, Gu Zhu, Belinda K Cornes, Grant W Montgomery, and Nicholas G Martin. Assumption-free estimation of heritability from genome-wide identity-by-descent sharing between full siblings.PLoS Genet, 2(3):e41, 2006.
60. Qian Wang, Can Yang, Joel Gelernter, and Hongyu Zhao. Pervasive pleiotropy between psychiatric disorders and immune disorders revealed by integrative analysis of multiple GWAS. Human genetics, 134(11–12):1195–1209, 2015.
61. Danielle Welter, Jacqueline MacArthur, Joannella Morales, Tony Burdett, Peggy Hall, Heather Junkins, Alan Klemm, Paul Flicek, Teri Manolio, Lucia Hindorff, et al. The NHGRI GWAS Catalog, a curated resource of SNP-trait associations. Nucleic acids research, 42(D1):D1001–D1006, 2014.
62. Can Yang, Cong Li, Henry R Kranzler, Lindsay A Farrer, Hongyu Zhao, and Joel Gelernter. Exploring the genetic architecture of alcohol dependence in African-Americans via analysis of a genomewide set of common variants.Human Genetics, 133(5):617–624, 2014.
63. Can Yang, Cong Li, Qian Wang, Dongjun Chung, and Hongyu Zhao. Implications of pleiotropy: challenges and opportunities for mining big data in biomedicine. Frontiers in genetics, 6, 2015.
64. Jian Yang, Andrew Bakshi, Zhihong Zhu, Gibran Hemani, Anna AE Vinkhuyzen, Sang Hong Lee, Matthew R Robinson, John RB Perry, Ilja M Nolte, Jana V van Vliet-Ostaptchouk, et al. Genetic variance estimation with imputed variants finds negligible missing heritability for human height and body mass index.Nature genetics, 2015.
65. Jian Yang, Andrew Bakshi, Zhihong Zhu, Gibran Hemani, Anna AE Vinkhuyzen, Ilja M Nolte, Jana V van Vliet-Ostaptchouk, Harold Snieder, Tonu Esko, Lili Milani, et al. Genome-wide genetic homogeneity between sexes and populations for human height and body mass index. Human molecular genetics, 24(25):7445–7449, 2015.
66. Jian Yang, Beben Benyamin, Brian P McEvoy, Scott Gordon, Anjali K Henders, Dale R Nyholt, Pamela A Madden, Andrew C Heath, Nicholas G Martin, Grant W Montgomery, et al. Common SNPs explain a large proportion of the heritability for human height.Nature genetics, 42(7):565–569, 2010.
67. Jian Yang, S Hong Lee, Michael E Goddard, and Peter M Visscher. GCTA: a tool for genome-wide complex trait analysis.The American Journal of Human Genetics, 88(1):76–82, 2011. 68. Jian Yang, Sang Hong Lee, Naomi R Wray, Michael E Goddard, and Peter M Visscher.
Commentary on “Limitations of GCTA as a solution to the missing heritability problem”. bioRxiv, page 036574, 2016.
Trait Loci Mapping
Wei Cheng, Xiang Zhang, and Wei Wang
Abstract As a promising tool for dissecting the genetic basis of common diseases, expression quantitative trait loci (eQTL) study has attracted increasing research interest. The traditional eQTL methods focus on testing the associations between individual single-nucleotide polymorphisms (SNPs) and gene expression traits. A major drawback of this approach is that it cannot model the joint effect of a set of SNPs on a set of genes, which may correspond to biological pathways. In this chapter, we study the problem of identifying group-wise associations in eQTL mapping. Based on the intuition of group-wise association, we examine how the integration of heterogeneous prior knowledge on the correlation structures between SNPs, and between genes can improve the robustness and the interpretability of eQTL mapping.
Keywords Robust methods • eQTL • Gene expression • Parameter analysis • Biostatistics
1
Introduction
The most abundant sources of genetic variations in modern organisms are single-nucleotide polymorphisms (SNPs). An SNP is a DNA sequence variation occurring when a single nucleotide (A, T, G, or C) in the genome differs between individuals of a species. For inbred diploid organisms, such as inbred mice, an SNP usually shows variation between only two of the four possible nucleotide types [26], which
W. Cheng ()
NEC Laboratories America, Inc., Princeton, NJ, USA e-mail:weicheng@nec-labs.com;chengw02@gmail.com
X. Zhang
Department of Electrical Engineering and Computer Science, Case Western Reserve University, Cleveland, OH, USA
e-mail:xiang.zhang@case.edu
W. Wang
Department of Computer Science, University of California, Los Angeles, CA, USA e-mail:weiwang@cs.ucla.edu
© Springer International Publishing Switzerland 2016 K.-C. Wong (ed.),Big Data Analytics in Genomics, DOI 10.1007/978-3-319-41279-5_2
allows us to represent it by a binary variable. The binary representation of an SNP is also referred to as thegenotypeof the SNP. The genotype of an organism is the genetic code in its cells. This genetic constitution of an individual influences, but is not solely responsible for, many of its traits. Aphenotypeis an observable trait or characteristic of an individual. The phenotype is the visible, or expressed trait, such as hair color. The phenotype depends upon the genotype but can also be influenced by environmental factors. Phenotypes can be either quantitative or binary.
Driven by the advancement of cost-effective and high-throughput genotyping technologies, genome-wide association studies (GWAS) have revolutionized the field of genetics by providing new ways to identify genetic factors that influence phenotypic traits. Typically, GWAS focus on associations between SNPs and traits like major diseases. As an important subsequent analysis, quantitative trait locus (QTL) analysis is aiming at to detect the associations between two types of information—quantitative phenotypic data (trait measurements) and genotypic data (usually SNPs)—in an attempt to explain the genetic basis of variation in complex traits. QTL analysis allows researchers in fields as diverse as agriculture, evolution, and medicine to link certain complex phenotypes to specific regions of chromosomes.
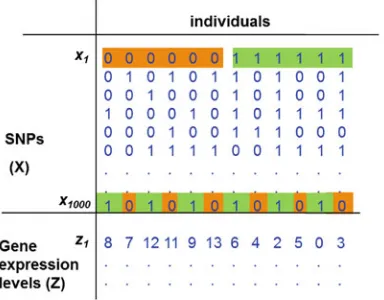
Gene expression is the process by which information from a gene is used in the synthesis of a functional gene product, such as proteins. It is the most fundamental level at which the genotype gives rise to the phenotype. Gene expression profile is the quantitative measurement of the activity of thousands of genes at once. The gene expression levels can be represented by continuous variables. Figure1 shows an example dataset consisting of 1000 SNPsfx1;x2; ;x1000gand a gene expression
levelz1for 12 individuals.
2
eQTL Mapping
For a QTL analysis, if the phenotype to be analyzed is the gene expression level data, then the analysis is referred to as the expression quantitative trait loci (eQTL) mapping. It aims to identify SNPs that influence the expression level of genes. It has been widely applied to dissect the genetic basis of gene expression and molecular mechanisms underlying complex traits [5,45,58]. More formally, let XD fxdj1 d Dg 2RKDbe the SNP matrix denoting genotypes ofKSNPs
ofDindividuals andZD fzdj1d Dg 2RNDbe the gene expression matrix
denoting phenotypes ofNgene expression levels of the same set ofDindividuals. Each column ofXandZstands for one individual. The goal of eQTL mapping is to find SNPs inX, that are highly associated with genes inZ.
Various statistics, such as the ANOVA (analysis of variance) test and the chi-square test, can be applied to measure the association between SNPs and the gene expression level of interest. Sparse feature selection methods, e.g., Lasso [63], are also widely used for eQTL mapping problems. Here, we take Lasso as an example. Lasso is a method for estimating the regression coefficientsWusing`1penalty. The
objective function of Lasso is
min W
1
2jjZWXjj
2
FCjjWjj1 (1)
wherejj jjF denotes the Frobenius norm,jj jj1 is the`1-norm.is the empirical
parameter for the`1penalty.Wis the parameter (also called weight) matrix setting
the limits for the space of linear functions mapping fromXtoZ. Each element of Wis the effect size of corresponding SNP and expression level. Lasso uses the least squares method with`1penalty.`1-norm sets many non-significant elements ofW
to be exactly zero, since many SNPs have no associations to a given gene. Lasso works even when the number of SNPs is significantly larger than the sample size (KD) under the sparsity assumption.
Using the dataset shown in Fig.1, Fig.2a shows an example of strong association between gene expressionz1 and SNPx1. 0 and 1 on the y-axis represent the binary
SNP genotype and the x-axis represents the gene expression level. Each point in the figure represents an individual. It is clear from the figure that the gene expression
Fig. 3 Association weights estimated by Lasso on the example data
level values are partitioned into two groups with distinct means, hence indicating a strong association between the gene expression and the SNP. On the other hand, if the genotype of an SNP partitions the gene expression level values into groups as shown in Fig.2b, the gene expression and the SNP are not associated with each other. An illustration result of Lasso is shown in Fig.3.Wij D 0 means no
association betweenjth SNP andith gene expression.Wij ¤ 0means there exists
an association between thejth SNP and theith gene expression.
2.1
Group-Wise eQTL Mapping and Challenges
In a typical eQTL study, the association between each expression trait and each SNP is assessed separately [11,63,72]. This approach does not consider the interactions among SNPs and among genes. However, multiple SNPs may jointly influence the phenotypes [33], and genes in the same biological pathway are often co-regulated and may share a common genetic basis [48,55].
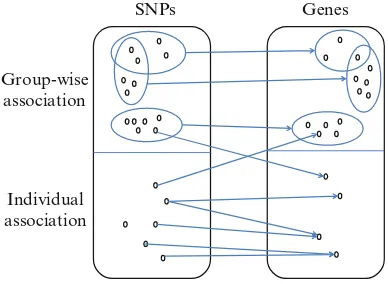
To better elucidate the genetic basis of gene expression, it is highly desirable to develop efficient methods that can automatically infer associations between a group of SNPs and a group of genes. We refer to the process of identifying such associations as group-wise eQTL mapping. In contrast, we refer to those associations between individual SNPs and individual genes as individual eQTL mapping. An example is shown in Fig.4. Note that an ideal model should allow overlaps between SNP sets and between gene sets; that is, an SNP or gene may participate in multiple individual and group-wise associations. This is because genes and the SNPs influencing them may play different roles in multiple biological pathways [33].
Fig. 4 An illustration of individual and group-wise associations
SNPs Genes
Group-wise association
Individual association
multi-domain heterogeneous data sets is able to improve the accuracy of eQTL mapping since more domain knowledge can be integrated. In literature, several methods based on Lasso have been proposed [4,32,35,36] to leverage the network prior knowledge [28,32,35,36]. However, these methods suffer from poor quality or incompleteness of this prior knowledge.
In summary, there are several issues that greatly limit the applicability of current eQTL mapping approaches.
1. It is a crucial challenge to understandhow multiple, modestly associated SNPs interact to influence the phenotypes[33]. However, little prior work has studied the group-wise eQTL mapping problem.
2. The prior knowledge about the relationships between SNPs and between genes is often partial and usually includes noise.
3. Confounding factors such as expression heterogeneity may result in spurious associations and mask real signals [20,46,60].
2.2
Overview of the Developed Algorithms
This book chapter proposes and studies the problem of group-wise eQTL mapping. We can decouple the problem into the following sub-problems:
• How can we detect group-wise eQTL associations with eQTL data only, i.e., with SNPs and gene expression profile data?
• How can we incorporate the prior interaction structures between SNPs and between genes into eQTL mapping to improve the robustness of the model and the interpretability of the results?
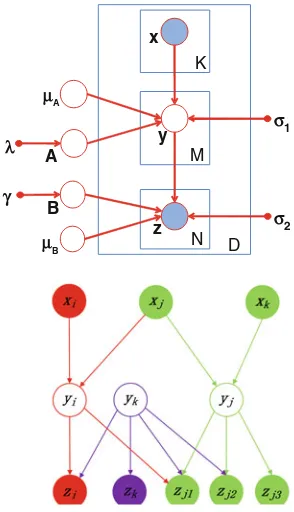
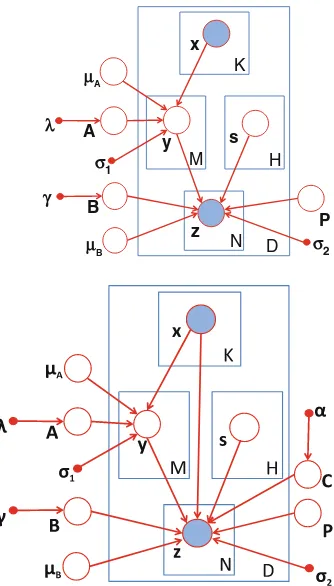
between SNP sets and gene sets. In literature, many efforts have focused on single-locus eQTL mapping. However, a multi-single-locus study dramatically increases the computation burden. The existing algorithms cannot be applied on a genome-wide scale. In order to accurately capture possible interactions between multiple genetic factors and their joint contribution to a group of phenotypic variations, we propose three algorithms. The first algorithm, SET-eQTL, makes use of a three-layer sparse linear-Gaussian model. The upper layer nodes correspond to the set of SNPs in the study. The middle layer consists of a set of hidden variables. The hidden variables are used to model both the joint effect of a set of SNPs and the effect of confounding factors. The lower layer nodes correspond to the genes in the study. The nodes in different layers are connected via arcs. SET-eQTL can help unravel true functional components in existing pathways. The results could provide new insights on how genes act and coordinate with each other to achieve certain biological functions. We further extend the approach to be able to consider confounding factors and decouple individualassociations andgroup-wiseassociations for eQTL mapping.
To address the second sub-problem, this chapter presents an algorithm, Graph-regularized Dual Lasso (GDL), to simultaneously learn the association between SNPs and genes and refine the prior networks. Traditional sparse regression problems in data mining and machine learning consider both predictor variables and response variables individually, such as sparse feature selection using Lasso. In the eQTL mapping application, both predictor variables and response variables are not independent of each other, and we may be interested in the joint effects of multiple predictors to a group of response variables. In some cases, we may have partial prior knowledge, such as the correlation structures between predictors, and correlation structures between response variables. This chapter shows how prior graph information would help improve eQTL mapping accuracy and how refinement of prior knowledge would further improve the mapping accuracy. In addition, other different types of prior knowledge, e.g., location information of SNPs and genes, as well as pathway information, can also be integrated for the graph refinement.
2.3
Chapter Outline
The book chapter is organized as follows:
• The algorithms to detect group-wise eQTL associations with eQTL data only (SET-eQTL, etc.) are presented in Sect.3.