Original Article
Development and Testing of a Computerized
Pain Body Map in Patients With Advanced
Cancer
Ellen Anna Andreassen Jaatun, MD, Marianne Jensen Hjermstad, PhD, Odd Erik Gundersen, MSc, Line Oldervoll, PhD, Stein Kaasa, MD, PhD, and Dagny Faksv!ag Haugen, MD, PhD, on behalf of the European Palliative Care Research Collaborative (EPCRC)
European Palliative Care Research Centre (E.A.A.J., M.J.H., L.O., S.K., D.F.H.), Department of Cancer Research and Molecular Medicine, Faculty of Medicine; Department of Computer and Information Science (O.E.G.); and Research Centre for Health Promotion and Resources (L.O.), Norwegian University of Science and Technology, Trondheim; Department of Otolaryngology and Head and Neck Surgery (E.A.A.J.) and Department of Oncology (S.K.), St. Olavs Hospital, Trondheim University Hospital, Trondheim; Regional Centre for Excellence in Palliative Care (M.J.H.), South Eastern Norway, Oslo University Hospital, Oslo; Verdande Technology AS (O.E.G.), Trondheim; and Regional Centre of Excellence for Palliative Care (D.F.H.), Western Norway, Haukeland University Hospital, Bergen, Norway
Abstract
Context.Pain localization is an important part of pain assessment.
Development of pain tools for self-report should include expert and patient input, and patient testing in large samples.
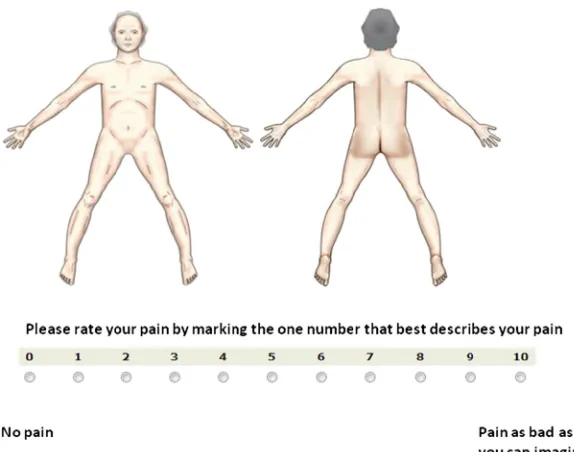
Objectives.To develop a computerized pain body map (CPBM) for use in patients with advanced cancer.
Methods.Three studies were conducted: 1) an international expert survey and a pilot study guiding the contents and layout of the CPBM, 2) clinical testing in an international symptom assessment study in eight countries and 17 centers (N¼533), and 3) comparing patient pain markings on computer and paper body maps (N ¼92).
Results.Study 1: 22 pain experts and 28 patients participated. A CPBM with anterior and posterior whole body views was developed for marking pain locations, supplemented by pain intensity ratings for each location. Study 2: 533 patients (286 male, 247 female, mean age 62 years) participated; 80% received pain medication and 81% had metastatic disease. Eighty-five percent completed CPBM as intended. Mean"SD number of marked pain locations was 1.8"1.2. Aberrant markings (15%) were mostly related to software problems. No
differences were found regarding age, gender, cognitive/physical performance, or previous computer experience. Study 3: 70% of the patients had identical
Address correspondence to: Marianne Jensen Hjerm-stad, Prof, Department of Oncology, Regional Centre for Excellence in Palliative Care, Oslo Uni-versity Hospital, Ullev!al, P.O. Box 4956, Nydalen,
N-0424 Oslo, Norway. E-mail: marianne.j. [email protected]
Accepted for publication: March 19, 2013.
!2014 U.S. Cancer Pain Relief Committee. Published by Elsevier Inc. All rights reserved.
0885-3924/$ - see front matter
markings on the computer and paper maps. Only four patients had completely different markings on the two maps.
Conclusion.This first version of CPBM was well accepted by patients with
advanced cancer. However, several areas for improvement were revealed, providing a basis for the development of the next version, which is subject to further international testing. J Pain Symptom Manage 2014;47:45e56.!2014 U.S. Cancer Pain Relief Committee. Published by Elsevier Inc. All rights reserved.
Key Words
Advanced cancer, symptom assessment, computer technology, patient-reported outcomes, computers, pain body map
Introduction
Pain is a common symptom in cancer,1and a European pain survey showed that 69% of the respondents reported pain-related difficul-ties with everyday actividifficul-ties.2Pain management is thus an inherent and important part of com-prehensive cancer care.3e5 Previous studies have established a need for consensus regard-ing pain assessment in cancer,6,7and interna-tional expert surveys have defined pain location as a core dimension in pain assess-ment tools.7,8Pain location and
radiation/ex-tension have important implications for
treatment as these factors may indicate the cause of the pain. Therefore, these pain di-mensions require specific and valid assessment methods that are feasible for clinical use.
Pain body maps (PBMs) have been used for pain assessment over the past 30e40 years. A PBM (also called pain map/chart/diagram/ drawing) is a body diagram on which patients mark the locations of their pain. PBMs have been used in research for different pain types such as postoperative, rheumatic, cancer, and chronic nonmalignant pain,9e12 but specific reports from clinical studies are few. In gen-eral, PBMs have demonstrated high validity and high test-retest and inter-rater reliabil-ity;9,10they also may be used by elderly and dis-abled persons.13,14
Pain maps are included in a number of fre-quently used paper- and pencil-based question-naires in cancer, for example, the McGill Pain Questionnaire,15 the Brief Pain Inventory (BPI),16and the Edmonton Symptom Assess-ment System (ESAS).17Nevertheless, no inter-national consensus has been established on the ideal contents of a PBM for use in general
cancer or palliative cancer care or on how it should be presented.18
Advanced technology facilitates electronic symptom registration by patients and health care providers and promotes data sharing be-tween care teams, which makes follow-up of patients not in physical proximity to the care team possible. Rapid presentation of results
may improve doctor-patient
communica-tion.18,19 Computerized versions of pain body maps (CPBMs) make detailed pain markings possible, for example, with incorporation of pain intensity ratings for each location and de-scriptions of pain quality, depending on the so-phistication of the software. A CPBM may be integrated into other computerized tools and used in combination with different software sys-tems, Web applications, and hand-held devices. User-friendliness and needs and limitations of the target group are crucial factors to con-sider in the development of all tools, both on pa-per and computers, especially in patients with a high symptom burden.7,8,19 One study dem-onstrated good feasibility and discriminant val-idity of a CPBM in chronic pain patients and healthy controls.20So far, few studies have
The European Palliative Care Research Collaborative (EPCRC) was a four year transla-tional research project funded by the Euro-pean Commission.19,25 A main objective was to develop a computerized tool for assessment and classification of cancer pain, including the development of a CPBM. Development of CPBM was a stepwise process comprising three studies with the following aims: Study 1: con-ducting an international expert survey and a pi-lot study to guide the selection of the contents and body projections of CPBM; Study 2: testing the feasibility of CPBM in an international, multicenter study, in relation to age, perfor-mance status, cognitive function, educational level, and computer experience; and Study 3: comparing patient pain markings on CPBM vs. a paper version of PBM.
Study 1. Expert Survey and Pilot Study
Methods
Expert Survey. Ten international and 26 Nor-wegian pain and palliative care experts were invited to participate in a Web-based survey re-garding the contents and clinical requirements of a CPBM for patients with advanced cancer. The international experts were recruited from within EPCRC,25 and the national experts were physicians and researchers from pain clinics and palliative care programs in Norway. In addition, an open invitation to participate was posted on the EPCRC Web site. The experts were approached on the basis of their longtime clinical and research experience regarding pain assessment. No prior knowledge about computerized assessment was required.
Experts were asked to rate the importance of using a CPBM for assessment of pain location and the relevance of including the following three dimensions: pain intensity, pain radia-tion, and pain character. These dimensions were selected based on a review rating impor-tant dimensions for pain assessment in pallia-tive care.8The experts also were asked if they wanted a pain intensity score for every location that was marked. Answers were rated on a 0e10 numeric rating scale (NRS) (0, no
agree-ment; 10, best possible agreement). The survey could be accessed for two weeks with a re-minder after one week. All responses were anonymous.
Pilot Study. The study was conducted with a convenience sample of 28 oncology inpa-tients and outpainpa-tients at St. Olavs Hospital, Norway, who had incurable metastatic or loco-regional disease and tumor-related pain. Patients were presented with three different software versions of CPBM and asked which one they preferred for marking pain locations. First, black and white, shaded gray, and shaded color versions, respectively, of a body drawing were presented separately to the patients on the computer screen. Second, three options for the actual marking of painful areas were tested, all using a stylus on the touch-sensitive screen: 1) circling the area by drawing an outline on the screen, 2) shading the area by scrawling on the screen, having the com-puter automatically and simultaneously creat-ing a correspondcreat-ing outline, or 3) shadcreat-ing the area by scrawling, with the computer envel-oping the area on completion of the drawing. Patients also were presented with two op-tions for scoring pain intensity. When a painful area was marked, a 0e10 NRS popped up for
scoring the pain intensity in that particular lo-cation. This automatically led to a change in the color of the already marked pain location, based on a predefined color for each number on NRS. Two different layouts of NRS with dif-ferent sizes of the buttons for marking pain in-tensity were tested.
Standard descriptive statistics were used, us-ing the PASW 18 statistical package (SPSS Inc., Chicago, IL).
Results
Expert Survey. Seven international and 15 na-tional experts (58%) responded. There was high consensus, with a mean score of 9.6 on the 0e10 NRS, that a CPBM should be used
for assessing pain location. The importance of assessing pain radiation received a mean rat-ing of 8.0, intensity 7.8, and pain character 6.6. The two projectionsdanterior view of the
whole body and posterior view of the whole bodydreceived ratings above 9 (9.6 and 9.3,
respectively). Lateral views of the head and neck were rated 5.9; all other projections were rated less than 5. Fourteen (64%) experts preferred a compulsory rating of pain intensity as part of the map. There was no consensus re-garding the use of different CPBM versions for different levels of cognitive functioning (yes, 10; no, 12).
Pilot Study. The software options were tested by 15 male and 13 female patients with advanced cancer, mean age 61 years (range 32e80) and mean Karnofsky Performance
Sta-tus (KPS) score of 79 (range 60e100) (data
not tabulated). Nineteen patients (68%) pre-ferred the shaded color version of CPBM. Thir-teen patients (46%) preferred marking the painful area by scrawling on the touch-sensitive screen with the computer automati-cally enveloping the area while drawing, whereas six wanted to scrawl and have the com-puter envelop the area when the drawing was completed. Eight preferred just to circle the area, and one patient expressed no prefer-ence. All patients preferred the version with the larger radio buttons for scoring the pain intensity on NRS.
Study 2. Testing CPBM in
EPCRC-Computerized Symptom Assessment
(CSA) Study
Methods
Based on the results from the pilot, a re-fined version of CPBM was developed. This version supported scrawling of pain locations and indicating pain intensity through line
color. As with the prototype, the refined ver-sion was developed iteratively in an evolution-ary development process that included feedback from health care providers.27,28 The final version was quality assured by pro-fessional testers.
This application was tested as part of a large international multicenter study, EPCRC-Computerized Symptom Assessment (CSA), which included more than 1000 patients from 17 centers in eight countries from Octo-ber 2008 through 2009.27 Four language groups were included: English, Norwegian, German, and Italian. The inclusion criteria were a verified cancer diagnosis, incurable metastatic or locally advanced disease, age $18 years, ability to complete the survey, and provision of written informed consent.27
All data collection was performed on touch-sensitive computers. The registration consisted of two parts, one to be filled in by the health care professionals, the other by the patients. All data were entered by tapping directly on the screen with a stylus. The health personnel part encompassed sociodemographic and medical variables, the Mini-Mental State Exam-ination (MMSE),29 and KPS.30 The patient part comprised one set of items, primarily fo-cusing on cancer-related symptoms, physical functioning, depression, and preferences for computerized or paper-based symptom assess-ment. All patients were presented with one screening item about worst pain intensity from BPI.16 If they reported pain intensity of $1 on the 0e10 NRS, patients were
automati-cally routed to a set of pain questions, which also included CPBM. The questionnaire matrix is described in detail elsewhere.27 No specific training beyond a very simple, intro-ductory demonstration was provided, but the research nurse was present to assist if neces-sary. The same ethical considerations applied as in the pilot study.
evaluation. Examples of two CPBMs from this study are shown inFig. 1.
Differences across the patient groups (‘‘ac-ceptable’’ vs. ‘‘not ac(‘‘ac-ceptable’’ CPBMs) were investigated using Pearson’s Chi-square and in-dependent sample t-tests for categorical and continuous variables, respectively. Because of the exploratory nature of this cross-sectional, descriptive study, sample size and power calcu-lations were not performed. The scoring of pain intensity for each pain site was not subject to specific analyses in the two clinical studiesd
EPCRC-CSA and the study comparing CPBM and the paper mapdbecause of the small
sample size in each subgroup. The same applied to differences across countries, as a result of an overrepresentation of Norwegian maps. AP-value of 0.05 or less was considered statistically significant. Analyses were per-formed using IBM SPSS Statistics 19 (SPSS Inc., Chicago, IL).
Results
A total of 1017 patients provided records that could be analyzed.27Among these, 535 pa-tients scored$1 on the initial pain screening question and were presented with CPBM. Two body maps were excluded because they had no marked areas. The patient sample (n ¼ 533) comprised 286 males and 247 fe-males, with a median age of 63 years (range
20e90 years). The majority (70%) were
inpa-tients (Table 1). The most prevalent diagnoses were gastrointestinal (22%), lung (18%), and breast (15%) cancer.
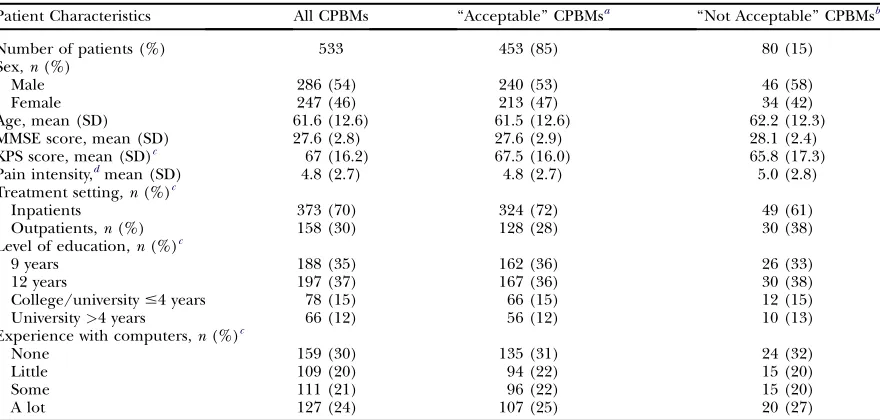
A total of 453 maps (85%) were judged to be acceptable, that is, the painful areas had been marked in a way that conveyed unequivocal in-formation to the two physicians evaluating CPBMs with respect to both pain location and intensity. The number of marked areas varied from one to eight, with a mean " SD of 1.8 " 1.2. Eighty maps (15%) displayed one or more aberrant markings resulting in ambiguous or no information for the physi-cian. These maps were labeled ‘‘not accept-able.’’ In 49 cases, the area marked on the anterior view was not consistent with the area marked on the posterior view. In most of these cases, the patients obviously had mixed up right and left on the body drawings on the screen.
point or a line within or outside the body outline.
No statistically significant differences were found between the patients with ‘‘acceptable’’ vs. ‘‘not acceptable’’ CPBMs with respect to age, sex, KPS, and MMSE scores (Table 1), nor in relation to prior experience with computers.
Study 3. Comparing CPBM and the
Paper PBM
Methods
The comparative study was performed in a subgroup of patients included in the EPCRC-CSA study at St. Olavs Hospital, Nor-way, supplemented by a few patients who were too frail to complete the EPCRC-CSA study. These patients also underwent an MMSE.
The two maps were presented to the patients in a pre-assigned random order. The time span between completion of the two maps was 20e30 minutes. This gap was chosen to try to
reduce possible recall bias between assess-ments, while at the same time ensuring a stable pain condition to avoid inconsistent markings
because of pain fluctuations. The patients marked the location of their pain on CPBM be-fore or after completing a regular paper PBM from BPI,16which is used daily in the hospital. All patients were asked if they preferred the pa-per version or CPBM after completing the registrations.
The two versions underwent independent evaluations by two physicians. They counted the marked areas and described each pain lo-cation using conventional anatomical terms. The descriptions were then compared to ascer-tain if the two maps had conveyed the same in-formation, and each pair of maps (paper and CPBM) was rated as either ‘‘identical’’ or ‘‘dif-ferent.’’ The two sets of descriptions were then evaluated by the physicians together. In cases of doubt, the original body maps were re-viewed once more. Simple descriptive statistics were used. The ethical considerations were the same as in Studies 1 and 2.
Results
Ninety-two patients were included in the comparative study; 83 were recruited from the EPCRC-CSA study (Fig. 2). In 65 cases (71%), the physicians found that the patients
Table 1
Patient Characteristics in the EPCRC-CSA Study
Patient Characteristics All CPBMs ‘‘Acceptable’’ CPBMsa ‘‘Not Acceptable’’ CPBMsb
Number of patients (%) 533 453 (85) 80 (15)
Sex,n(%)
Male 286 (54) 240 (53) 46 (58)
Female 247 (46) 213 (47) 34 (42)
Age, mean (SD) 61.6 (12.6) 61.5 (12.6) 62.2 (12.3)
MMSE score, mean (SD) 27.6 (2.8) 27.6 (2.9) 28.1 (2.4)
KPS score, mean (SD)c 67 (16.2) 67.5 (16.0) 65.8 (17.3)
Pain intensity,dmean (SD) 4.8 (2.7) 4.8 (2.7) 5.0 (2.8) Treatment setting,n(%)c
Inpatients 373 (70) 324 (72) 49 (61)
Outpatients,n(%) 158 (30) 128 (28) 30 (38)
Level of education,n(%)c
9 years 188 (35) 162 (36) 26 (33)
12 years 197 (37) 167 (36) 30 (38)
College/university#4 years 78 (15) 66 (15) 12 (15)
University>4 years 66 (12) 56 (12) 10 (13)
Experience with computers,n(%)c
None 159 (30) 135 (31) 24 (32)
Little 109 (20) 94 (22) 15 (20)
Some 111 (21) 96 (22) 15 (20)
A lot 127 (24) 107 (25) 20 (27)
EPCRC¼European Palliative Care Research Collaborative; CPBM¼computerized pain body map; MMSE¼Mini-Mental State Examination;
KPS¼Karnofsky Performance Status.
aComputerized pain body maps that provided unequivocal information about the pain location. bCPBMs that did not provide unequivocal information about the pain location.
cMissing: treatment setting:n
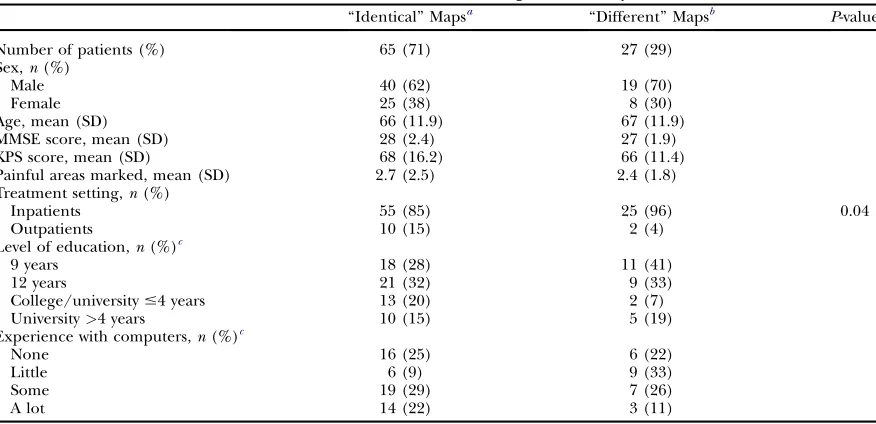
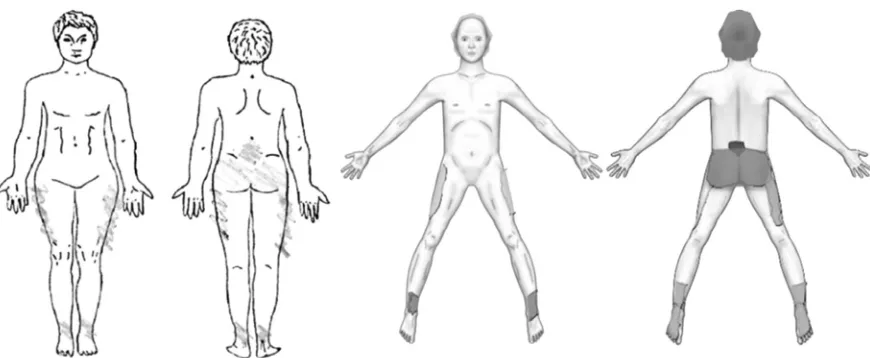
had marked the same number of areas and the same anatomical locations on CPBM and the paper PBM. Mean number of marked areas were 2.7 and 2.4 on the ‘‘identical’’ and ‘‘differ-ent’’ maps, ranging from 0 to 7 and 1e12,
re-spectively (Table 2) (Fig. 3).
The remaining 27 pairs differed in various aspects. In seven cases, the markings on CPBM and the paper PBM were completely dif-ferent and conveyed difdif-ferent information;
three of these patients had obviously mixed up left and right. In the remaining 20 cases, relatively similar anatomical locations were marked, but there were still slight differences; most often, fewer areas were marked on the computerized maps. In one case only, CPBM had more marked areas than the paper PBM.
The main characteristics of the groups with ‘‘identical’’ and ‘‘different’’ maps are shown in Table 2. No statistically significant
Fig. 2. Overview of the computerized and paper pain maps evaluable for comparison. CPBM¼ computerized
pain body map; PBM¼pain body map; EPCRC¼European Palliative Care Research Collaborative.
Table 2
Patient Characteristics in the Comparative Study
‘‘Identical’’ Mapsa ‘‘Different’’ Mapsb P-value
Number of patients (%) 65 (71) 27 (29)
Sex,n(%)
Male 40 (62) 19 (70)
Female 25 (38) 8 (30)
Age, mean (SD) 66 (11.9) 67 (11.9)
MMSE score, mean (SD) 28 (2.4) 27 (1.9)
KPS score, mean (SD) 68 (16.2) 66 (11.4)
Painful areas marked, mean (SD) 2.7 (2.5) 2.4 (1.8)
Treatment setting,n(%)
Inpatients 55 (85) 25 (96) 0.04
Outpatients 10 (15) 2 (4)
Level of education,n(%)c
9 years 18 (28) 11 (41)
12 years 21 (32) 9 (33)
College/university#4 years 13 (20) 2 (7)
University>4 years 10 (15) 5 (19)
Experience with computers,n(%)c
None 16 (25) 6 (22)
Little 6 (9) 9 (33)
Some 19 (29) 7 (26)
A lot 14 (22) 3 (11)
MMSE¼Mini-Mental State Examination; KPS¼Karnofsky Performance Status. aMaps that showed identical markings on the computerized and paper versions. bMaps that showed different markings on the computerized and paper versions. cMissing: level of education: identical maps,n
¼3 (5%); experience with computers: ‘‘identical maps,’’n¼10 (15%), ‘‘different maps:’’n¼2
differences were found between the two groups, except for a significantly higher pro-portion of inpatients in the group with
‘‘differ-ent’’ maps (P¼0.04). A closer examination of
the maps, however, revealed that the patients with ‘‘different’’ maps obviously had had more difficulties marking CPBM than the pa-tients with ‘‘identical’’ maps, as shown by aber-rant shapes, markings outside the body contour, and markings with single points or straight lines only. The order in which the body maps were presented to the patients had no influence on the results: ‘‘different’’ vs. ‘‘identical’’ maps, or on which version the patient preferred.
Sixty-two (73%) of the 92 patients preferred CPBM to the paper map. Only four patients preferred the paper map; 16 patients ex-pressed no preference. Those who preferred CPBM had a mean age of 64 years (range
20e83 years), a mean KPS score of 65 (range
40e90), and a mean MMSE score of 28 (range
16e30), not significantly different from the
re-maining patients. Both physicians found CPBMs easier to read and evaluate than the pa-per maps.
Discussion
This article describes the development of a first version of a CPBM for use in patients with advanced cancer. The development was conducted according to the stepwise, interna-tional methodology used in the EPCRC
project19,25and included an expert survey, a
pi-lot study, and two clinical studies, after a thor-ough examination of the existing literature. This or similar methodologies have been used in the development of several
well-validated questionnaires31,32 to ensure a
uni-form high quality.33 This is also the best way
to achieve consensus and ensure widespread use. The patient studies of CPBM showed that this form of assessing pain location was well accepted by patients with advanced cancer and that the majority were able to complete the maps as intended.
Members of the international expert panel almost all agreed that a CPBM should be used for assessing pain location, in line with previous reports emphasizing pain location as one of the key variables in a pain classification
system34and for pain assessment in palliative
care cancer patients.7,8This and other results
from the panel led to the development of the first version of a CPBM that provided op-tions for distinct markings of multiple pain lo-cations, thereby also indicating pain radiation. CPBM was supplemented with the automatic presentation of scales for rating pain intensity for each location. We believe that this results in a better and more detailed pain assessment, es-pecially in patients with fluctuating pain of varying intensity that may be the result of tu-mor invasion, bone metastases, neuropathic pain, etc.
The prototype was then pilot-tested in a pa-tient sample with advanced disease. Because
any symptom measure should be easy to ad-minister and process, yield precise and imme-diate results, and, above all, be acceptable to patients, patients in the target groups should be involved in the development process.33,35 In our study, this resulted in useful and accu-rate feedback on the layout and interface of CPBM.
One also can argue that patients could have been involved before the development of the prototype, in line with the user-centered design philosophy used in modern software develop-ment.36,37In hindsight, it could be that some of the shortcomings of the software could have been detected at an earlier stage, despite being time-consuming in the development process. However, the initiation of this project came from clinical work and demonstrated a high de-gree of user-friendliness in the target group.
The feedback from experts and patients guided the development of CPBM, before the international testing in the EPCRC-CSA study. The international acceptability of CPBM was substantiated by the fact that 85% of the sample was able to complete CPBM in a way that gave unequivocal information to the physicians. Furthermore, no significant dif-ferences in any of the well-known variables for study compliance (age, gender, performance status, etc.)26,27 were found across ‘‘accept-able’’ vs. ‘‘not accept‘‘accept-able’’ CPBMs. Although we were surprised that KPS scores did not seem to exert an influence here, one could ar-gue that KPS is primarily a measure of physical performance, whereas interacting with com-puters relies more on cognitive functions. The average MMSE score among participants was high, 28 (maximum 30), indicating that most patients were cognitively intact.
Before study start, we expected that previous experience with computers and level of educa-tion would mirror the computer literacy and influence the ability to use and the preference for CPBM. This was not the case, as there were no differences in previous computer experi-ence associated with these factors. However, we did not ask about the actual use of com-puters and degree of access to the Internet, which may be good indicators of computer lit-eracy. Also, the significance of computer liter-acy for this specific task is difficult to ascertain because similar programs are not in frequent use by patients in general.
The comparative study showed that the ma-jority of the patients had identical markings on the computerized and paper PBMs, regard-less of which one they completed first. Most of the ‘‘different’’ markings were found on CPBMs, with aberrant shapes and dots, making us think that this could be a problem with the software. The screen was relatively sensitive, which might have contributed to unintentional dots and lines. Although an option for erasing erroneous markings was incorporated, thor-ough evaluation of CPBMs revealed that this function was rarely used. The fact that some pa-tients had mixed up the right and left sides of the body on the two versions could have been avoided by clearly marking this on the screen. However, a paper map does not necessarily serve as the gold standard for validating correct markings. To investigate this in more detail, fur-ther comparative studies should use an interac-tive method specifically investigating the process when completing the maps.
The majority of the patients who were asked to participate in the comparative study were in-patients who either aborted or who were not asked to participate in the EPCRC-CSA study. This may indicate a higher disease burden overall in comparison with the patients in the EPCRC-CSA study. In this respect, it is promis-ing that three-quarters had identical markpromis-ings, although we are well aware that the next com-parative study should be part of a larger inter-national validation study that enables more subgroup comparisons with respect to pain in-tensity, cognition, and performance status.
Although a healthy bias cannot be ruled out because of the inclusion procedures in the EPCRC CSA study,27it was promising that the first version of CPBM was so well accepted by patients, although 15% of the patients marked their maps in a way that did not convey un-equivocal pain information. Regardless of the cause, be it technical problems or difficulties on the part of the patients, any pain assess-ment tool should be regarded as a facilitator for symptom evaluation and not a substitute for direct doctor-patient communication. Also, more knowledge about specific variables that reduce patient compliance or increase the validity and reliability of computerized tools is necessary. This warrants large interna-tional studies, with an even distribution of countries, languages, and medical and socio-demographic characteristics. We know that paper- and pencil-based questionnaires might remain the preference for a number of pa-tients and settings. So far we know little about the feasibility of using computerized technol-ogy in, for example, groups with lower educa-tion levels and immigrant subgroups, etc., in the Western world; this also calls for specific validation studies.
The use of different electronic devices, for example, computers, cell phones, and tablets offers several benefits for patients and heath care providers. However, the enthusiasm for rapid results must be viewed against the fact that introducing new technology implies costs in terms of money, training time, and educa-tion and relies on the buy-in from stake-holders. Poor compatibility and ethical restraints often hinder direct transfer to pa-tient records and limit the usability in clinical settings.19,27
Additional body projections may be included in a future CPBM to improve the description of pain extension. Also, three-dimensional inter-active CPBMs have been tested in patients with low back pain, yielding good visual displays of the width, height, and depth of the pain.40,41 Other domains besides pain location and inten-sity, such as pain radiation and pain quality, also may be incorporated into a CPBM. Based on our results, we are in the process of improving CPBM for further patient testing and interna-tional validation in palliative care cancer patients.
Conclusion
Results from the present study show that CPBM worked well and was well accepted in patient samples with advanced cancer. Areas of improvement were revealed and are being incorporated into a new CPBM version that is subject to additional clinical testing.
Disclosures and Acknowledgments
EPCRC (2006e2010) was funded by the
Eu-ropean Commission’s Sixth Framework Pro-gramme (contract no LSHC-CT-2006-037777) with the overall aim to improve treatment of pain, depression, and fatigue through transla-tional research. There are no financial benefits or conflicts of interest that might bias this work.
EPCRC Core scientific group/work package leaders: Stein Kaasa (project coordinator), Frank Skorpen, Marianne Jensen Hjermstad, and Jon H!avard Loge, Norwegian University of Science and Technology (NT NU); Geoffrey Hanks, University of Bristol; Augusto Caraceni and Franco De Conno, Fondazione IRCCS Isti-tuto Nazionale dei Tumori, Milan; Irene Hig-ginson, King’s College London; Florian Strasser, Cantonal Hospital St. Gallen; Lukas Radbruch, RWTH Aachen University; Kenneth Fearon, University of Edinburgh; Hellmut Samonigg, Medical University of Graz; Ketil Bø, Trollhetta AS, Norway; Irene Rech-Weichselbraun, Bender MedSystems GmbH, Austria; Odd Erik Gundersen, Verdande Tech-nology AS, Norway. Scientific advisory group: Neil Aaronson, The Netherlands Cancer Insti-tute; Vickie Baracos and Robin Fainsinger, University of Alberta; Patrick C. Stone, St. George’s University of London; Mari Lloyd-Williams, University of Liverpool. Project man-agement: Stein Kaasa, Ola Dale, and Dagny F. Haugen, NTNU.
References
1. Teunissen SC, Wesker W, Kruitwagen C, et al. Symptom prevalence in patients with incurable can-cer: a systematic review. J Pain Symptom Manage 2007;34:94e104.
treatment, and patient attitudes. Ann Oncol 2009; 20:1420e1433.
3. Hjermstad MJ, Fainsinger R, Kaasa S. Assess-ment and classification of cancer pain. Curr Opin Support Palliat Care 2009;3:24e30.
4. Laugsand EA, Jakobsen G, Kaasa S, Klepstad P. Inadequate symptom control in advanced cancer patients across Europe. Support Care Cancer 2011; 19:2005e2014.
5. Portenoy RK. Treatment of cancer pain. Lancet 2011;377:2236e2247.
6. Caraceni A, Cherny N, Fainsinger R, et al. Pain measurement tools and methods in clinical research in palliative care: recommendations of an Expert Working Group of the European Association of Pal-liative Care. J Pain Symptom Manage 2002;23: 239e255.
7. Hjermstad MJ, Gibbins J, Haugen DF, et al. Pain assessment tools in palliative care: an urgent need for consensus. Palliat Med 2008;22:895e903.
8. Holen JC, Hjermstad MJ, Loge JH, et al. Pain as-sessment tools: is the content appropriate for use in palliative care? J Pain Symptom Manage 2006;32: 567e580.
9. Escalante A, Lichtenstein MJ, Lawrence VA, Roberson M, Hazuda HP. Where does it hurt? Stabil-ity of recordings of pain location using the McGill Pain Map. J Rheumatol 1996;23:1788e1793. 10. Margolis RB, Chibnall JT, Tait RC. Test-retest re-liability of the pain drawing instrument. Pain 1988; 33:49e51.
11. Schanberg LE, Lefebvre JC, Keefe FJ, Kredich DW, Gil KM. Pain coping and the pain ex-perience in children with juvenile chronic arthritis. Pain 1997;73:181e189.
12. Talmi YP, Horowitz Z, Pfeffer MR, et al. Pain in the neck after neck dissection. Otolaryngol Head Neck Surg 2000;123:302e306.
13. Bromley J, Emerson E, Caine A. The develop-ment of a self-report measure to assess the location and intensity of pain in people with intellectual dis-abilities. J Intellect Disabil Res 1998;42:72e80. 14. Weiner D, Peterson B, Keefe F. Evaluating per-sistent pain in long term care residents: what role for pain maps? Pain 1998;76:249e257.
15. Melzack R. The McGill Pain Questionnaire: ma-jor properties and scoring methods. Pain 1975;1: 277e299.
16. Daut RL, Cleeland CS, Flanery RC. Develop-ment of the Wisconsin Brief Pain Questionnaire to assess pain in cancer and other diseases. Pain 1983;17:197e210.
17. Bruera E, Kuehn N, Miller MJ, Selmser P, Macmillan K. The Edmonton Symptom Assessment System (ESAS): a simple method for the assessment of palliative care patients. J Palliat Care 1991;7:6e9.
18. Jensen MP. The validity and reliability of pain measures in adults with cancer. J Pain 2003;4:2e21. 19. Kaasa S, Loge JH, Fayers P, et al. Symptom as-sessment in palliative care: a need for international collaboration. J Clin Oncol 2008;26:3867e3873. 20. Jamison RN, Fanciullo GJ, Baird JC. Computer-ized dynamic assessment of pain: comparison of chronic pain patients and healthy controls. Pain Med 2004;5:168e177.
21. Huang HY, Wilkie DJ, Zong SP, et al. Develop-ing a computerized data collection and decision support system for cancer pain management. Com-put Inform Nurs 2003;21:206e217.
22. Wilkie DJ, Judge MKM, Berry DL, et al. Usability of a computerized PAINReportIt in the general pub-lic with pain and people with cancer pain. J Pain Symptom Manage 2003;25:213e224.
23. Watanabe SM, Nekolaichuk C, Beaumont C, et al. A multi-center study comparing two numerical versions of the Edmonton Symptom Assessment Sys-tem in palliative care patients. J Pain Symptom Man-age 2011;41:456e468.
24. Quality Care Central LCC. Edmonton Symptom Assessment Survey (ESAS-r), application for iPad. Available from http://www.qccen.com/. Accessed October 12, 2012.
25. European Palliative Care Research Collabora-tive (EPCRC). Available from http://www.epcrc. org/. Accessed October 12, 2012.
26. Fyllingen EH, Oldervoll LM, Loge JH, et al. Computer-based assessment of symptoms and mo-bility in palliative care: benefits and challenges. J Pain Symptom Manage 2008;38:827e836.
27. Hjermstad MJ, Lie HC, Caraceni A, et al. Com-puter-based symptom assessment is feasible in pa-tients with advanced cancer: results from an international multicenter study, the EPCRC-CSA. J Pain Symptom Manage 2012;44:639e654.
28. Sommerville I. Software engineering. Interna-tional computer science series, 6th ed. Boston, MA: Addison-Wesley, 2001.
29. Folstein MF, Folstein SE, McHugh PR. Mini-Mental State: a practical method for grading the cognitive state of patients for the clinician. J Psychiatr Res 1975;12:189e198.
30. Karnofsky D, Burchenal J. The clinical evalua-tion of chemotherapeutic agents in cancer. In: Macleod C, ed. Evaluation of chemotherapeutic agents. New York: Columbia University Press, 1949: 199e205.
33. Johnson C, Aaronson N, Blazeby J, et al. Guide-lines for developing questionnaire modules, 4th ed. Brussels: EORTC Quality of Life Group, 2011. 34. Knudsen AK, Brunelli C, Klepstad P, et al. Which domains should be included in a cancer pain classification system? Analyses of longitudinal data. Pain 2012;153:696e703.
35. Rothman M, Burke L, Erickson P, et al. Use of existing patient-reported outcome (PRO) instru-ments and their modification: the ISPOR Good Re-search Practices for Evaluating and Documenting Content Validity for the Use of Existing Instruments and Their Modification. PRO Task Force Report. Value Health 2009;12:1075e1083.
36. Abras C, Maloney-Krichmar D, Preece J. User-centered design. In: Bainbridge W, ed. Ency-clopedia of human-computer interaction. Thou-sand Oaks: Sage Publications, 2004:763e768.
37. Royce WW. Managing the development of large software systems. Proceedings of IEEE WESCON 26, Los Angeles, 1970). Reprinted in Proceedings of the Ninth International Conference on Software Engi-neering 1987;328e338.
38. European Palliative Care Research Center (PRC). Available from http://www.ntnu.no/prc/. Accessed November 15, 2012.
39. European Association for Palliative Care Re-search Network (EAPC RN). Available fromhttp:// www.eapcrn.org/. Accessed November 15, 2012. 40. Ghinea G, Spyridonis F, Serif T, Frank AO. 3-D pain drawings-mobile data collection using a PDA. IEEE Trans Inf Technol Biomed 2008;12:27e33.