Full Terms & Conditions of access and use can be found at
http://www.tandfonline.com/action/journalInformation?journalCode=vjeb20
Download by: [Universitas Maritim Raja Ali Haji] Date: 12 January 2016, At: 22:52
Journal of Education for Business
ISSN: 0883-2323 (Print) 1940-3356 (Online) Journal homepage: http://www.tandfonline.com/loi/vjeb20
Leadership Behavior of Male and Female
Managers, 1984–2002
Jill L. Robinson & Jean Lipman-Blumen
To cite this article: Jill L. Robinson & Jean Lipman-Blumen (2003) Leadership Behavior of
Male and Female Managers, 1984–2002, Journal of Education for Business, 79:1, 28-33, DOI: 10.1080/08832320309599084
To link to this article: http://dx.doi.org/10.1080/08832320309599084
Published online: 31 Mar 2010.
Submit your article to this journal
Article views: 83
View related articles
Leadership Behavior
of
Male and
Female Managers,
1984-2002
JILL L. ROBINSON
zyxwvutsrqponmlkjihgfedcbaZYXWVUTSRQPONMLKJIHGFEDCBA
University of RedlandsRedlands, California he literature is rife with research
T
exploring various alleged differ- ences between men and women in man- agement. Over the past 3 decades, each gender group has touted the superiority of its own management styles (Chusmir,Koberg,
zyxwvutsrqponmlkjihgfedcbaZYXWVUTSRQPONMLKJIHGFEDCBA
& Mills, 1989; Collingwood, 1995; Gardiner & Tiggemann, 1999;Hegelsen, 1990; Rosener, 1990). These claims tend to exaggerate the differences between men and women, but the dis- parities they fix upon fall within the same, very limited set: collaboration and nurturance versus power and control.
That narrowly based stereotype was both confounded and compounded by
Rosener’s 1990
zyxwvutsrqponmlkjihgfedcbaZYXWVUTSRQPONMLKJIHGFEDCBA
Harvard Business Review article, which was based on anundisclosed number of high-level female executives in the Independent Women’s Forum. That widely heralded paper confirmed the stereotype about women, but asserted that changes in the managerial environment had converted women’s purported liability into an asset. The Rosener argument suggests that, in the new organizational world, “female” behaviors-particularly col- laborativeness and nurturancehad become more appropriate for managers than the stereotypical male predilec- tions for power and control. Nonethe- less, as late as 2002, women still held
only about 1.2% of CEO positions
zyxwvutsrqponmlkjihgfedcbaZYXWVUTSRQPONMLKJIHGFEDCBA
( n =6 ) in the Fortune 500 companies, and
ABSTRACT. Using data collected from 1984 to 2002 from 2,371 male and 1,768 female middle and senior managers in the United States, the authors of this article demonstrate not
only
zyxwvutsrqponmlkjihgfedcbaZYXWVUTSRQPONMLKJIHGFEDCBA
that traditional gender role stereotypes do not hold up, but alsothat counterstereotypical patterns exist. Using the Connective Leader- ship Model, based on nine sets of achieving styles, the authors found that the traditional gender gap in com- petitiveness has decreased sharply, but for an unanticipated reason: Men’s competitive scores have dropped, whereas women’s have remained rather stable. Men’s collaborative and contributory behaviors also have decreased significantly, whereas women’s have increased.
JEAN LIPMAN-BLUMEN
Claremont Graduate UniversityClaremont,
California
71% of Fortune 500 corporations still had no female directors (Glaser, 2002; Morton, 2003). If Rosener’s argument is correct, it is difficult to understand why pragmatic American managers continue to exclude women from the highest managerial ranks.
In this article, we argue that viewing male and female managers through such a restricted lens adds little to our under- standing, no matter how long and hard we stare at them. Rather, to understand what, if any, behavioral differences exist between males and females and how these differences relate to the manageri- al world, it is imperative to develop a broader, more nuanced spectrum of
behavior that is geared toward goal attainment.
Consequently, the burden is fourfold: 1. To present a broader-spectrum model of goal-oriented behavior;
2.Using that model and a sample of over 4,000 managers across a spectrum of industries, to explore whether the much-vaunted difference between male and female managers in collaboration and control exists;
3. To reveal what other behavioral differences, if any, occur in the way that male and female managers go about accomplishing their tasks and achieving their goals; and
4. Given the globalized managerial environment, to examine the trajectory of whatever differences, if any, in such behavior have existed between male and female managers over the past 3 decades.
The Connective Leadership Model
The Connective Leadership Model describes a nine-part spectrum of behaviors that individuals use to accom- plish their tasks (Lipman-Blumen, 2000, 1998, 1997, 1996, 1992). It is based on the presumption that, in the current global, organizational, and polit- ical climate, the greatest challenge that
28 Journal
zyxwvutsrqponmlkjihgfedcbaZYXWVUTSRQPONMLKJIHGFEDCBA
of Education for Businessleaders confront is the need to integrate two major, contradictory global forces: interdependence and diversity.
Global corporations, as well as politi- cal systems, now exist in an interdepen- dent environment, where events occur- ring in one part of the system reverberate rapidly throughout all of its parts. Diver- sity, in this context, is a multidimension- al concept (a) that refers to differences that exist at levels ranging from the multinational to the individual and (b) in which agendas among nations; business organizations; ethnic, racial, and other groups; and individuals vary so much as to appear irreconcilable.’
These forces appear to be contradic- tory because they call for categorically different behavioral strategies. Interde- pendence requires engaging in collabo- ration through alliances and networks, as well as contributing to one another’s tasks. Diversity speaks to the unique- ness of groups or individuals that drives them toward separate, independent, often competitive and controlling action. In a world where diverse groups and nations live cheek by jowl, integrat- ing their frequently opposing agendas will take leaders who can use a far more sophisticated repertoire of sy stem-savvy behavioral strategies. It is just such a behavioral repertoire that underlies the
Connective Leadership Model.
zyxwvutsrqponmlkjihgfedcbaZYXWVUTSRQPONMLKJIHGFEDCBA
Achieving Styles and an
instrument for Measuring Them
The goal-oriented behavioral spec- trum that underlies the Connective Lead- ership Model consists of nine categories of achieving styles; that is, the character- istic behaviors that individuals use to accomplish their goals. The Achieving Styles Model consists of three major
behavioral domains:
zyxwvutsrqponmlkjihgfedcbaZYXWVUTSRQPONMLKJIHGFEDCBA
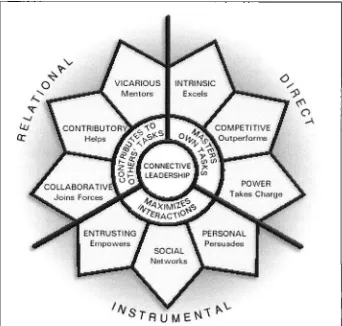
direct, instrumen- tal, and relational (see Figure 1).Each domain, in turn, comprises three distinct styles, resulting in a full behavioral complement of nine styles. The direct set, which speaks primarily to the forces of diversity, focuses on executing and mastering one’s own tasks. The relational set, which address- es issues of interdependence, empha- sizes contributing, actively or passively, to group tasks, as well as to the tasks of others. The instrumental set. a trio of
political, system-oriented behavioral strategies, serves as the bridge between the more oppositional direct and rela- tional styles. The instrumental set focuses on behavioral strategies that use the self to attract others to join in, that create and share networks, and that use the system, its resources, its processes, and the participants as instruments for goal attainment. Ideal- ly, connective leaders are adept at using all nine achieving styles in various degrees to accomplish their goals, depending on the demands of the par- ticular situation.
itive style, guided by an external stan- dard of excellence, involves striving to outperform relevant others. For exam- ple, sales offices frequently reward the sales representative who outperforms his or her fellow sales reps. The power style calls for creating order out of chaos, by taking charge and organizing the task through actions that include controlling other individuals, resources, and system processes. We recognize the power style in individuals who step for- ward to take charge in times of crisis, delegating some tasks to others but con- trolling the overall process and retaining overall responsibility.
The Direct Set
The Instrumental Set
The three styles within the direct set are labeled intrinsic, competitive, and
power. The intrinsic style focuses pri- marily on executing and mastering one’s own tasks, as measured against one’s own previous performance, using an internalized standard of excellence. Athletes who strive to break their own record time exemplify this. The compet-
The three instrumental styles are per-
[image:3.612.226.568.382.708.2]sonal, social, and entrusting. These styles represent more complex, nuanced leadership behaviors that are particu- larly relevant in a globalized environ- ment. The personal style uses all aspects of the self-from intelligence, physical prowess, and attractiveness,
FIGURE 1. Connective leadership model.
September/October 2003 29
along with other personal qualities such as self-deprecating humor and theatrical- ity, to demographic characteristics such as age, race, ethnicity, education, and occupation40 attract others to the task.
Charismatic leaders such as John
zyxwvutsrqponmlkjihgfedcbaZYXWVUTSRQPONMLKJIHGFEDCBA
F.Kennedy epitomize this approach. The social style focuses on accomplishing tasks through creating and sharing net- works of individuals with specific, rele- vant abilities, experience, or connections. Corporate headhunters use these skills to match executives to firms seeking to fill high-level positions. The entrusting style calls for expecting other individuals, with or without pertinent experience, to execute the task. The manager who relies on a new staff person to perform an important task without much oversight is
demonstrating this style.
zyxwvutsrqponmlkjihgfedcbaZYXWVUTSRQPONMLKJIHGFEDCBA
I
zyxwvutsrqponmlkjihgfedcbaZYXWVUTSRQPONMLKJIHGFEDCBA
The Relational Set
zyxwvutsrqponmlkjihgfedcbaZYXWVUTSRQPONMLKJIHGFEDCBA
I
Note. AS1 results were measured on a 7-point Likert scale. Higher numbers indicate greater re- ported use of the behaviors.
* p < .01.
The three styles within the relational
set are called collaborative, contributo-
zyxwvutsrqponmlkjihgfedcbaZYXWVUTSRQPONMLKJIHGFEDCBA
ry, and vicarious. The collaborative style calls for joining forces with others to accomplish a group task and taking one’s share of responsibility for suc- cesses or failures. Many individuals in advertising tap into this behavior as they strive to improve their productivi- ty. The contributory style involves not only contributing directly to the role tasks of another party with whom the contributory achiever identifies, but also deriving a sense of achievement from that contribution to the other’s success. A manager who helps a staff
member complete an important task and a speechwriter who composes the CEO’s address to the Chamber of Com- merce are both exhibiting contributory behavior. The third style within the relational set, vicarious, focuses on contributing indirectly or passively to the success of another with whom the vicarious individual identifies. This behavior is demonstrated by mentors, who enthusiastically guide the training and advancement of their protBgC’s career and experience a sense of achievement from the protCgC’s suc- cess. The vicarious style also is exhibit- ed by fans who support their team, as well as by proud family members, who facilitate the success of the achiever in more general and indirect ways.
The L-BL Achieving Styles Inventory
(ASI- 13)
zyxwvutsrqponmlkjihgfedcbaZYXWVUTSRQPONMLKJIHGFEDCBA
In this study, we used the L-BL Achieving Styles Inventory (ASI-13), developed by Lipman-Blumen and Leavitt in 1973, to assess participants’ Connective Leadership profiles.2 The L- BL Achieving Styles Inventory, revised and validated 14 times over the course of its development, is a 45-item self- report instrument. The nine leadership styles are measured on a seven-point Likert scale that represents how fre- quently individuals call upon these behaviors to accomplish their goals. Each scale ranges from 1 (never) to 7
(always).
Study Sample
To examine differences between male and female managers’ achieving styles, we gathered data from 4,139 upper- and middle-level U.S. managers. This sam- ple consisted of 2,371 men and 1,768 women. The study participants varied across occupations as well as types of employers. The employers represented included government; large, medium, and small corporations; nonprofit orga- nizations; educational institutions; and self-employers. The average age of our sample was 43 years. The percentage of married participants was 52.4%. With regard to education, 25% of the sample group held a bachelor’s degree, 35% a master’s degree, and 17% a doctorate.
Hypotheses and Results
The stereotypical contention is that female leaders use a relationship-oriented management style, encompassing collab- orative, contributory, and vicarious behaviors, to accomplish their tasks. Male leaders, on the other hand, are stereotyped as using task orientation, competition, and power. In opposition to this limited view, ourprimary hypothesis
postulates that men and women will exhibit similar leadership behaviors, except in the competitive area. Second, we hypothesized that male managers
would exhibit more competitive behavior than women.
We conducted a t-test analysis to examine differences between the male and female respondents across the nine achieving styles measured by the AS1 (see Table 1). For 6 of the 9 achieving styles, we found no significant gender differences. We found a significant dif- ference, however, in the competitive achieving style, with men scoring high- er on competitiveness than women. This substantial difference in competitive behavior supported our hypothesis and prompted further analysis.
In addition, small, counterstereotypi- cal but statistically significant differ- ences were seen in two other style^.^
First, on the intrinsic style, which focus- es on executing a task on one’s own and measuring performance against an internal standard of excellence, women scored higher than men. This finding
I
TABLE 1. Comparison t tests of Achieving Styles Inventory (ASI) Means for Male and Female Managers
Men Women Mean
Achieving style
zyxwvutsrqponmlkjihgfedcbaZYXWVUTSRQPONMLKJIHGFEDCBA
(n = 2,371)zyxwvutsrqponmlkjihgfedcbaZYXWVUTSRQPONMLKJIHGFEDCBA
(n = 1,768) difference t value Intrinsic directCompetitive direct Power direct Personal instrumental Social instrumental Entrusting instrumental Collaborative relational Contributory relational Vicarious relational
5.43 4.48 5.31 4.64 4.34 4.62 5.10 5.1 1
5.00
5.58 4.03 5.31 4.59 4.3 I 4.66 5.09
5.08
4.8 1
.I5 .45
.oo
.05
.03
.04
.o
1-03 $19
5.57* 12.56*
* 10
1.23 .92 1.20 .23 .94 5.65*
runs counter to the stereotype that women are more interested in people than tasks. Second, men reported slight- ly greater use of the vicarious style, defined as deriving a sense of achieve- ment through the accomplishments of others with whom one identifies. This finding also counters the gender stereo- type that women are higher on this more passive relational scale.
Taken together, however, the entire pattern of responses contradicts the classic gender stereotypes. More specifically, in the first instance, women are neither more collaborative nor more contributory than men. Sec- ond, men act somewhat more vicarious- ly, using relational behavior more fre- quently than women. Third, women are more task oriented than men, as demonstrated by their higher mean score on the intrinsic style. The only serious gender difference in leadership behavior was in the competitive realm, where men scored significantly higher
than women.
zyxwvutsrqponmlkjihgfedcbaZYXWVUTSRQPONMLKJIHGFEDCBA
Does the Competitive Gap Persist Over Time?
Given the policy and programmatic efforts beginning in the 1970s to encourage women’s competitive behav- ior in education and athletics, we hypothesized an increase in women’s competitive scores over the subsequent decades. To explore the trajectory of this difference in competition between men and women, we examined cohort data by decade, comparing data from 1984 to 1989,1990 to 1999, and 2000 to 2002. Third, we hypothesized that the
largest diTerence in competitive behav-
ior would be seen in the
zyxwvutsrqponmlkjihgfedcbaZYXWVUTSRQPONMLKJIHGFEDCBA
1980s, withmen’s and women’s competitive behav- ior converging over time. Fourth, we further hypothesized that women in
recent years would exhibit more
zyxwvutsrqponmlkjihgfedcbaZYXWVUTSRQPONMLKJIHGFEDCBA
com-petitive leadership behaviors than they had in the past.
Here, we found intriguing differ- ences (see Figure 2). The largest gap between the competitive behavior of men and women was seen in the 1980s as hypothesized. From 1984 to 1989, male managers reported a competitive mean score of 4.62, compared with 4.02 for the female managers (see
Table 2). This difference was signifi-
cant (p
zyxwvutsrqponmlkjihgfedcbaZYXWVUTSRQPONMLKJIHGFEDCBA
zyxwvutsrqponmlkjihgfedcbaZYXWVUTSRQPONMLKJIHGFEDCBA
c .001). During the 1990s, male participants reported a lower averagescore
(M
= 4.33) than they had in the 1980s, although this was still signifi- cantly higher than the reported score for the female managers(M
= 3.94). Between 2000 and 2002, the maleto a mean score of 4.31, compared with a fairly consistent score for the female managers
(M
= 3.97) across the decades. Between 2000 and 2002, the competitive scores for men and women were not statistically different. At this point in time, it is not clear whether this recent lack of difference signals -nanagers’ scores had dropped further that the convergence between male and
zyxwvutsrqponmlkjihgfedcbaZYXWVUTSRQPONMLKJIHGFEDCBA
FIGURE 2. Male versus female cohorts: Comparison of competitive behavior.
TABLE 2. Male and Female Cohorts’ Competitive Behavior: ANOVA Comparison
Competitive
behavior scores 1980-1 989 1990-1999 2000-2002 Men 4.62* 4.33 4.3 1
(n = 921) (n = 519) (n = 347) (n = 5 5 )
Women 4.02 3.94 3.97
(n = 628) (n = 308) (n = 264) (n = 56)
Gender comparison p < .001 p < .001
zyxwvutsrqponmlkjihgfedcbaZYXWVUTSRQPONMLKJIHGFEDCBA
NSNote. Managers in the last column represent a smaller group over fewer years than managers in the other columns. We used post hoc REGWQ analysis to control for unequal sample sizes and reduce Type I errors. Scores were measured on a 7-point Likert scale.
*Significantly different from score for men during 2000-2002; p c .001.
NS = not significant.
September/October 2003 31
female managers on competition is finally complete or if the sample size for those years is too small to reveal a remaining difference.
True, the gap in competitive behavior between men and women managers is declining as hypothesized. Yet, the decline stems from an unexpected source. Our data show that the narrow- ing of the gap between men and women came not as the expected result of
women becoming
zyxwvutsrqponmlkjihgfedcbaZYXWVUTSRQPONMLKJIHGFEDCBA
more competitive,but rather because men are becoming
less competitive. This may be indica-
tive of a changing socialization of males that allows them more flexibility in leading through more relational, tra- ditionally “feminine” behaviors. It may also stem from similar changes in busi- ness education that are promoting
cooperation and team building (Leavitt
zyxwvutsrqponmlkjihgfedcbaZYXWVUTSRQPONMLKJIHGFEDCBA
& Lipman-Blumen, 1980). Our find- ings also may reflect globalization’s demand that organizations work togeth- er, using more complex forms of coop- eration to prosper in the rapidly chang- ing environment.
Note.
zyxwvutsrqponmlkjihgfedcbaZYXWVUTSRQPONMLKJIHGFEDCBA
Female managers after 2000 represent a smaller group over fewer years than female man- agers in the other decades. We used post hoc REGWQ analysis to control for unequal sample sizesand reduce Q p e I errors. Scores were measured on a 7-point Likert scale.
*Significantly different from female managers in the 1980s for same achieving style; p
zyxwvutsrqponmlkjihgfedcbaZYXWVUTSRQPONMLKJIHGFEDCBA
< .05.zyxwvutsrqponmlkjihgfedcbaZYXWVUTSRQPONMLKJIHGFEDCBA
I
Additional Comparisons Across Decades
These findings on competitive behav- ior prompted us to examine other changes across the nearly 3 decades dur-
ing which we collected data. Given the changing socialization of males and females promoted through various gov- ernment programs, including Title
IX,
as well as business schools’ emphasis on teamwork, we expected both men and women’s collaborative and contributory scores to increase over that time span.For this analysis, we used cohort data to hold age constant (the group included only managers in their 40s). Then we examined differences across time. This allowed us to look at sequential genera- tions, which are influenced by different socialization and educational patterns. An analysis of variance (ANOVA) showed statistically significant differ- ences in men’s and women’s collabora- tive and contributory scores. We also conducted a post hoc analysis using a REGWQ (Ryan-Einot-Gabriel-Welsch) to examine further the source of these differences. We used the REGWQ to reduce the likelihood of a Q p e I error
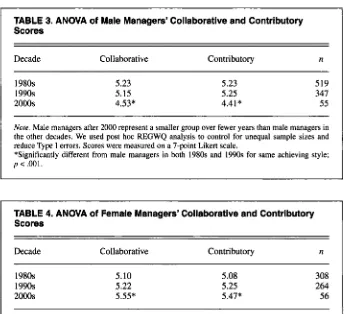
induced by unequal sample sizes. Men’s 1980s scores were statistically different from their 2002 scores on both the col- laborative and contributory achieving styles (p c .001); however, their scores did not increase as predicted. Scores for both collaborative and contributory achieving styles for male managers, in fact, decreased (see Table 3). In contrast,
between the 1980s and 2002 there was a
significant increase in scores (p <
zyxwvutsrqponmlkjihgfedcbaZYXWVUTSRQPONMLKJIHGFEDCBA
.05)for women in both collaborative and contributory achieving styles (see Table 4). The REGWQ analysis, however, did not register this difference in women’s
scores as statistically significant.
zyxwvutsrqponmlkjihgfedcbaZYXWVUTSRQPONMLKJIHGFEDCBA
Conclusions
The nine-style Connective Leadership Model presents a more differentiated conceptualization of goal-oriented behav- ior (see Figure 1). As such, it meets our goal of providing a more nuanced under- standing of potential gender differences among managers. It allows us to go beyond the simple dichotomy of collabo-
ration and nurturance versus power and competition, the scale that has been used in previous research to describe female- male differences.
This research achieved several addi- tional goals. Drawing on a substantial
managerial database, our analysis indi- cates that the purported stereotypical gender differences in the use of collabo- ration and power cannot be substantiat- ed in this U.S. sample. We were able, nonetheless, to demonstrate a signifi- cant gender difference on competition, with men reporting higher scores than women, as the stereotype would predict. The data, however, revealed several counterintuitive, counterstereotypical results. First, males scored higher on vic- arious behavior, traditionally associated with females. Second, females scored higher on intrinsic, or task-focused, behavior, customarily attributed to males. Perhaps the most interesting counterintuitive finding on gender differ- ences came from our time series analy- sis, which indicated a definite narrowing
[image:6.612.225.571.371.685.2](perhaps even closing in the last few
TABLE 3. ANOVA of Male Managers’ Collaborative and Contributory Scores
Decade Collaborative Contributory n
1980s 1990s 2000s
5.23 5.15 4.53*
5.23 5.25 4.41”
5 19 341 55 Now. Male managers after 2000 represent a smaller group over fewer years than male managers in the other decades. We used post hoc REGWQ analysis to control for unequal sample sizes and reduce Type I errors. Scores were measured on a 7-point Likert scale.
*Significantly different from male managers in both 1980s and 1990s for same achieving style;
zyxwvutsrqponmlkjihgfedcbaZYXWVUTSRQPONMLKJIHGFEDCBA
p c . 0 0 1 .
TABLE 4. ANOVA of Female Managers’ Collaborative and Contributory Scores
I
Decade Collaborative Contributory n1980s 1990s 2000s
5.10 5.22 5.55”
5.08 5.25 5.47*
308 264 56
years) of the gender gap in competitive- ness from the mid-1980s through 2002. What makes that finding particularly intriguing is the source of that conver- gence: Rather unexpectedly, male man- agers’ competitive scores were signifi- cantly lower than they had been in the early 1980s, whereas women’s had remained relatively constant. This find- ing occurs despite considerable public policy efforts during this period to increase women’s competitiveness. In addition, women’s collaborative and con- tributory behaviors have increased sig- nificantly during this same time, whereas men’s have significantly declined, despite emphasis on teamwork both in business schools and in the workplace.
As with all research, these conclu- sions must be viewed in terms of the strengths and limitations of this particu- lar study. The large sample size and the availability of nearly 3 decades of data for upper- and middle-level managers in the United States constitute major strengths in the current study. This sub- stantial database lends support not only to the findings presented, but also to their “generalizability” across occupa- tions and industries. At the same time, the greatest limitation lies in the fact that, despite the large sample sizes for the 1980s and 1990s, only a relatively small sample of respondents was avail- able after the year 2000, an inevitable restriction at this point in time. Future research should examine whether these findings hold true as we approach the end of this decade.
Notwithstanding previously conduct- ed studies of the behavioral correlates of the L-BL Achieving Styles Inventory (Lipman-Blumen, 1991), the general limitations of self-report measures apply to this research as well. This means that future research using other types of lead- ership measures is needed to confirm the results presented in this study.
The conclusions drawn from this research have important implications for business education and business practice. They suggest, first, that gender should not be used as a major predictor of narrowly defined leadership behav- iors. This recommendation coincides with other research, including several meta-analyses, suggesting that knowl- edge of individuals’ gender does little to
help predict their subsequent leadership behavior (Eagly &Johnson, 1990; Dob-
bins
zyxwvutsrqponmlkjihgfedcbaZYXWVUTSRQPONMLKJIHGFEDCBA
& Platz, 1986; Lipman-Blumen, Fryling, Henderson, Moore, & Vec-chiotti, 1996). Despite the assertions of previous research, neither men nor women uniquely can claim leadership profiles that represent a better fit for today’s business challenges. Thus, it is critical in business school admissions policies, as well as hiring and promo- tion decisions, to consider people as individuals with their own specific, rather than gender-based, strengths and weaknesses.
Second, it appears unwise for busi- ness school curricula and other leader- ship-development programs to reinforce the “now-you-see-them-now-you-don’t’’ gender stereotypes by encouraging either men or women to adopt styles pre- sented as “natural” for the opposite sex. Third, leadership development programs should take into account the magnitude and speed of ongoing changes in social- ization, business education, and business practice, particularly within the context of globalization. The growing complexi- ty of these current trends necessitates a more differentiated, sophisticated lead- ership repertoire. This is particularly the case if leaders hope to meet the chal- lenge of integrating the opposing global forces of interdependence and diversity. The Connective Leadership Model offers one possible means of addressing
this challenge.
zyxwvutsrqponmlkjihgfedcbaZYXWVUTSRQPONMLKJIHGFEDCBA
NOTES
1. That is, in this usage, diversity speaks to the differences among nation states, organizations, communities, demographic groups, and individu- als. Thus, we extend the meaning beyond the usual limited sense, in which “diversity” is com- monly used to refer to different racial, ethnic, age, and gender groups within the work force.
2. For a description of the L-BL Achieving Styles Inventory and its history, reliability, and validity characteristics, see Lipman-Blumen,
Handley-Isaksen, and Leavitt, 1983. For addition-
zyxwvutsrqponmlkjihgfedcbaZYXWVUTSRQPONMLKJIHGFEDCBA
al technical information, including norms, behav-
ioral validation studies, and so forth, see Lipman- Blumen, 1991.
3. Since 1983, the Achieving Styles Institute, at the Peter F. Drucker Graduate School of Manage- ment, has collected data from over 12,000 men and women across various age, race, ethnic, and occu- pational groups, countries, and industries. The instrument has been translated into 17 languages. In addition, two related instruments have been developed: the L-BL Organizational Achieving Styles Inventory (OASI), for measuring the achiev- ing styles rewarded by organizations, and the L-BL Achieving Styles Situational Evaluation Technique
(ASSET), for assessing the achieving styles most needed to accomplish a particular task or project.
4. Although these two small differences were found in the intrinsic and vicarious styles, it is important to note that they accounted for less than 1% of the variance explained and may be a result
of the large sample size.
REFERENCES
Collingwood, H. (1995). Women as managers:
Not just different-Better.
zyxwvutsrqponmlkjihgfedcbaZYXWVUTSRQPONMLKJIHGFEDCBA
Working Women,November, 14.
Chusmir, L. H., Koberg, C. S., & Mills, J. (1989). Male/female differences in the association of managerial style and personal values. Journal
of Social Psychology, 129( I), 65-78.
Dobbins, G. H., & Platz, S. J. (1986). Sen- differences in leadershipHow real are they?
Academy of Management Review, I I , 1 18-1 34. Eagly, A. H., & Johnson, B. T. (1990). Gender and leadership style: A meta-analysis. Psychologi-
cal Bulletin. 108, 233-256.
Gardiner, M., & Tiggemann, M. (1999, Septem- ber). Gender differences in leadership style, job stress and mental health in male- and female-dominated industries. Journal of Occu- pational and Organizationnl Psychology.
Glaser, C. (2002). Women changing the way American business works. Atlanta Business
Chronicle. Retrieved October 2002 from
zyxwvutsrqponmlkjihgfedcbaZYXWVUTSRQPONMLKJIHGFEDCBA
http://Atlanta.bizjournals.com/Atlanta/storied
2002/10/07/smallb4.html
Hegelsen, S. (1990). The female advantage:
Women’s ways of leadership. New York: Dou- bleday/Currenc y.
Leavitt, H. J., & Lipman-Blumen, J. (1980). A
case for the relational manager. Organizational
Dynamics, Summer, 27-41.
,ipman-Blumen, J. (1991). Individual and orga-
nizational achieving styles: A conceptual hand- book f o r researchers and human resource pro- fessionals (4th ed.). Claremont, CA: The
Achieving Styles Institute.
ipman-Blumen, J. (1 992). Connective leader- ship: Female leadership styles in the 21st cen- tury workplace. Sociological Perspectives, ipman-Blumen, J. (1996). The connective edge:
Leading in an interdependent world. San Fran- cisco: Jossey-Bass.
Lipman-Blumen, J. ( I 997). Connective leader-
ship: A new paradigm. Drucker Magazine,
zyxwvutsrqponmlkjihgfedcbaZYXWVUTSRQPONMLKJIHGFEDCBA
I( 1 ),Lipman-Blumen, J. (1998, JanuaryFebruary). Con- nective leadership: What business needs to learn from academe. Change Magazine, 49-53. Lipman-Blumen, J. (2000). The age of connective
leadership. Leader to Leader, 17(Summer). 39-45.
Lipman-Blumen, J., Fryling, T., Henderson, M. C., Moore, C. W., & Vecchiotti, R. (1996).
Women in corporate leadership: Reviewing a decade’s research. Wellesley, MA: Wellesley College Center for Research on Women. Lipman-Blumen, J., Handley-Isaksen, A,. &
Leavitt, H. J. (1983). Achieving styles in men and women: A model, an instrument, and some findings. In J. T. Spence (Ed.), Achievement und
achievement motives: Psychological and socio- logical approaches (pp. 147-204). San Francis- co: W. H. Freeman.
Morton, L. P. (2003). Targeting CEOs. Public
Relations Quarrerly,
zyxwvutsrqponmlkjihgfedcbaZYXWVUTSRQPONMLKJIHGFEDCBA
48( I), 43-44. Rosener, J. B. (1990). Ways women lead. HarvurdBusiness Review, 68(6), 119-125. 72(3), 301-315.
35(1), 183-203. 12-38.