Procedia - Social and Behavioral Sciences 195 ( 2015 ) 2868 – 2873
1877-0428 © 2015 The Authors. Published by Elsevier Ltd. This is an open access article under the CC BY-NC-ND license (http://creativecommons.org/licenses/by-nc-nd/4.0/).
Peer-review under responsibility of Istanbul Univeristy. doi: 10.1016/j.sbspro.2015.06.409
ScienceDirect
World Conference on Technology, Innovation and Entrepreneurship
Hydrology Properties and Water Quality Assessment of the
Sembrong Dam, Johor, Malaysia
Halizah Awang
a*, Zawawi Daud
b, Mohd. Zainuri Mohd. Hatta
baFaculty of Technical and Vocational Education,Universiti Tun Hussein Onn Malaysia, 86400 Parit Raja, Batu Pahat,
Johor, Malaysia
bFaculty of Civil and Environmental Engineering,Universiti Tun Hussein Onn Malaysia, 86400 Parit Raja, Batu Pahat,
Johor, Malaysia
Abstract
In recent years, monitoring quality of water body or reservoir has become a main concern for the determination of current condition and long-term pattern for future management. This study focused on hydrology properties and water quality of Sembrong Dam in Johor, Malaysia. The result indicated that soil loss about 487.12 kg/km2/day, for rainfall and evaporation records are 1862 mm and 1098 mm for hydrology properties; Sembrong dam categorized as Class III according to NWQS. Sembrong dam need a treatment for further environmental technology in the future.
© 2015 The Authors. Published by Elsevier Ltd. Peer-review under responsibility of Istanbul Univeristy.
Keywords: Hydrology; water quality; sembrong dam; environment.
1.Introduction
All living organisms need water. It plays an important role in many natural processes and is essential in countless physical and chemical reactions (Fang et al, 2005). Water is considered a renewable resource, renewable referring to that portion which circulates through the hydrological cycle. About 70% of the earth’s surface is covered by water, only 2.5% of that water is fresh and only 0.3% of that water is available for human use (Ministry of Agriculture and Agro-base Industry
* Corresponding author. Tel. +600-07-4564223; fax: +600-07-4536588.
E-mail address: [email protected]
© 2015 The Authors. Published by Elsevier Ltd. This is an open access article under the CC BY-NC-ND license (http://creativecommons.org/licenses/by-nc-nd/4.0/).
Malaysia, 2003). Furthermore, pressures on this resource are growing. Sembrong dam reservoir is constructed on large lowland rivers with gradually sloping banks; it can be characterized by inundation of large areas, extreme horizontal variability with extensive shallow riparian vegetation and shallow reservoir (Amneera et al, 2013). The secondary function of the dam was to provide a clean water supply to 240,000 consumers in Kluang district area were used for daily activities (Traskraba et al, 1999). Water from the Sembrong dam reservoir is treated at the West Sembrong Water Treatment Plant before the distribution. Extrapolation beyond the data is often necessary to provide information needed for dam safety risk assessments (Idris et al, 2004). Thus, quality of the water from Sembrong dam important for future.
2.Material and Method
2.1 Study area and sampling method
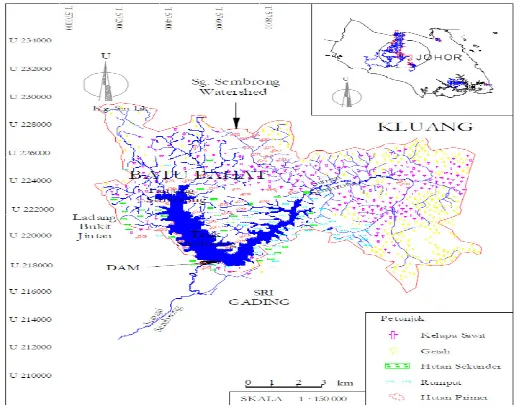
Hydrology properties sampling stations were selected based on criteria of utilization of water and effect nearby activities. Sembrong Lake was located in the districts of Air Hitam and Kluang, within the range of 2°01'35''N 1°58'29''N latitude and 103°09'32''E 103°12'57''E longitude (Fig. 1).
Fig.1 Sembrong dam reservoir 130 km2 catchment area.
The rainfall data were sourced from the Environmental Impact Assessment (EIA) and the Department of Irrigation and Drainage, which was in charge of the reservoir operations whilst reservoir inflow data were extracted using a water balance equation for the reservoir in Tabe 1.
Table 1. Sembrong dam reservoir rainfall and evaporation station
Station no. and name Type of data Period of data obtained
1931003
Empangan Sg. Sembrong, Air Hitam, Johor
Rainfall October 1982 to
December 2009
Stor JPS, Kluang, Johor December 2009
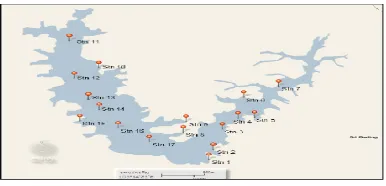
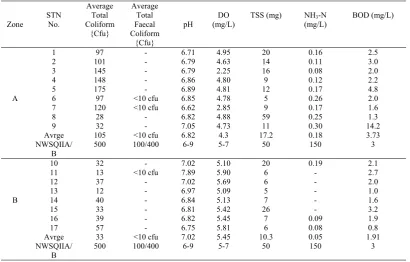
For water quality study, there were a total of 17 water quality-sampling stations of the Sembrong dam reservoir as indicated in Fig.2. The surface water collected 10 cm below water in that river. Each sample station’s water stored in one-liter polyethylene bottles. The water samples kept in ice for further analysis in the laboratory.
Fig. 2 Study area and sampling stations of Sembrong stations.
The water samples were kept in a refrigerator at temperature below 40C. The parameters involved are BOD, COD, N H 3 - N, TSS and turbidity while pH and DO will measure directly at the station by using in-situ method due to process of obtaining the sample might change the measurement. All the result of the laboratory analysis records on the appropriate table.
3.Result and discussion
3.1.Hydrology properties
Fig. 3 Water depth across Sembrong dam reservoir at 12 measuring cross-section
Outlet for the water supply is provided in the upstream guide wall of the flood-regulating outlet. A maximum of 1.0 m3/s of water can be drawn off through an 800 mm diameter pipe at the invert level of 2.870 m M.O.D. for water supply where this effect by the soil loss in dm. The compensation water draw-off is 1.2 m3/s through a 900 mm pipe, built into the flood regulating outlet structure. The compensation draw-off is required to maintain water quality and to keep the river downstream in a viable condition (Caroline and Wardah, 2006). Figure 2 shows the water depths at 12 cross-sections of the Sembrong dam reservoir. The intervals of each cross-section are ranged between 500 m (along Sembrong River) to 1500 m (along Merpo River) intervals. Measurements of the water depths were made on 9th of November 2010 to 10th November 2010. The water levels in the reservoir are 9.0 m M.O.D. during both days. The reservoir bed slopes towards the dam outlet where it gives a depth with the maximum water depth recorded is 4.52 m, upstream of the dam.
The available rainfall and evaporation records, the average annual total rainfall and evaporation recorded at Sembrong dam rainfall station are 1862 mm and 1098 mm, respectively. The rainfall and evaporation records reported in this report are obtained in this study. Generally, heavy rainfall occurs during the months of October to January and again in March and April due to the climate changes of the monsoons by Figure 4. From Fig. 4 and Fig. 5, evaporation rate is quite uniform. The study made by Ministry of Agriculture between years 1964 to 1974, the mean annual evaporation for Sembrong dam reservoir catchment is 1800 mm/year from Fig. 6 (Said et al, 2004).
Fig. 4 Water depth across Sembrong dam reservoir at 12 measuring cross-section
Fig. 5 Water depth across Sembrong dam reservoir at 12 measuring cross-section
3.2.Water quality assessement
Table 2 shows water sampled in Sembrong River contains higher total coliform counts. The lower the pH, the higher the hydrogen ion (H+) activity and the more acidic is the water. The neutral pH is considered as 7.0.
Table 2. Chemical parameter concentration
Zone
proportional to each other (Akkoyunlu and Akiner, 2011).
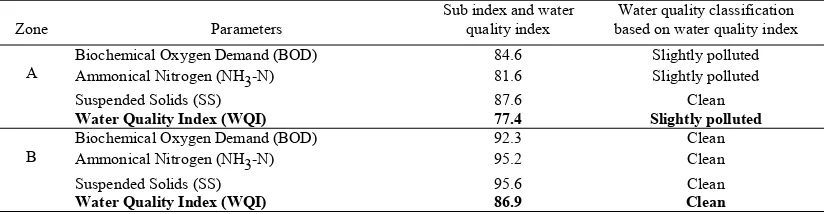
Table 3. Water Quality Index
Zone Parameters
Sub index and water quality index
Water quality classification based on water quality index
A
Biochemical Oxygen Demand (BOD) 84.6 Slightly polluted
Ammonical Nitrogen (NH3-N) 81.6 Slightly polluted
Suspended Solids (SS) 87.6 Clean
Water Quality Index (WQI) 77.4 Slightly polluted
B
Biochemical Oxygen Demand (BOD) 92.3 Clean
Ammonical Nitrogen (NH3-N) 95.2 Clean
Suspended Solids (SS) 95.6 Clean
Water Quality Index (WQI) 86.9 Clean
The classification of water quality of Zone A (Sembrong) and Zone B (Merpoh) followed the Water Quality Index (WQI). The DOE water quality classification based on water quality index refer on Table 4. The WQI of Sembrong River is 77.4, which is categorized as slightly polluted.
4.Conclusion
As conclusion, it can be conclude that Sembrong River Dam slightly shows high soil loss where is consist of soft fine grained silty clay material with organic matter, tree roots and decaying timber. For rainfall and evaporation records are 1862 mm and 1098 mm. Sembrong River (Zone A) generally slightly polluted compared Merpoh River (Zone B) where is clear from pollution in Sembrong Dam. Due to Biological parameter where is Sembrong River shows high of Total Coliform rather Merpoh River. Besides that, all of chemical parameter shows that Sembrong River was not a good condition. According of Water Quality Index, Sembrong River was truly slightly polluted compared Merpoh River in Sembrong Dam.
Acknowledgments
This research was supported by Ministry of Higher Education of Malaysia and scholarship from Universiti Tun Hussein Onn Malaysia (UTHM). The authors are thankful for this financial support.
References
Aggarwal, R. and Arora, S. (2012). A Study of Water Quality of Kaushalya River In The Submountaneous Shivalik Region.
International Journal Of Scientific & Technology Research, 1, 52-68.
Akkoyunlu, A. and Akiner, M.E. (2011). Pollution evaluation in streams using water quality indices: A case study from Turkey’s Sapanca Lake Basin. Ecological Indicators,18, 501-511.
Amneera, W.A., Najib, N.W.A. Z., Yusof, S.R. M. and Ragunathan, S. (2013). Water quality index of Perlis river, Malaysia.
International Journal of Civil & Environmental Engineering, 13, 1-6.
Caroline P.D. and Wardah, T. (2006). Dam flooding caused a prolonged flooding. International Journal of Civil & Environmental Engineering, 12, 71-75.
Davie, T. Fundamentals of Hydrology. London: Routledge. (2003).
Davis, P. and Storm,R.H.M. Water management for smart growth. 1st edition. Springer Science and Business Media. (2005).
Fang, F.K., Easter W. and Brezonik, P.L. (2005). Point-nonpoint source water quality trading: a case study in the Minnesota river basin. Journal of the American Water Resources Association, 41, 645-5.
Idris, W.N.W. Azmin, M.A.M. Som and Al-Mamun, A. The Importance of Sullage (Grey-Water) Treatment for the Restoration and Conservation of Urban Streams. 1st International Conference on Managing Rivers in the 21stCentury:Issues & Challenges - Rivers 2004, 21-23 Sept 2004. (2004).
Ministry of Agriculture and Agro-based Industry Malaysia. Kajian Penilaian Awal Kesan Alam Sekitar (EIA) Projek Pertanian Moden di atas Lot PTD 24651-24655, 14209, 14212, 14213, Lot 8211-8216, 5500, 5569, 5671, 5672, 5844, 9098-9101, 9135-9137 Mukim Sri Gading, Daerah Batu Pahat dan Lot 5502, 5503, 2296, 2297, PTD 14745 Mukim Kluang, Daerah Kluang, Johor Darul Ta’zim. (2003).
Said, D., Stevens, K. and Sehlke, G. (2004). Environmental assessment. Environmental Management, 34, 406–414. Traskraba M. and Tundisi, J.G. Reservoir Water Quality Management. UNEP/ILEC Guidelines of Lake Management Series