26
In this chapter, the writer presents research type, research design, variables of the study, population and sample, research instrument, validity, reliability, data collection procedure, and data analysis procedure.
A. Research Type
The study was classified into quantitative research where, according to Ary et al., it deals with question of relationship, cause and effect, or current status that writer can answer by gathering and statistically analyzing numeric data. It can be devided into experimental and non-experimental.28 Meanwhile Aliaga and Gunderson in Muijs state that Quantitative research is a research which explains phenomena by collecting numerical data that are analyzed using mathematically based method (in particular statistic).29
B. Research Design
The writer was conducted in Ex Post Facto design. According to Ary, et al., ex post facto research is a type of research that attempts to determine the causes for, or consequence of, differences that already exist in groups of individuals.30
28 Donal Ary, et al., Introduction to Research in Education, Wadsworth, 2010., p. 39. 29Daniel Muijs, Doing Quantitative Research in Education with SPSS, SAGE Publications Ltd, London, 2004., p. 1.
The writer did an observation without any manipulation; just choose two classes in writing business letter. The observation was progressed at SMKN 2 Palangka Raya.
The design of this research could be seen at the table bellows: Table 3.1 Ex-Post Facto Design
Group Independent Variable Dependent Variable 1st
2nd
X1 X2
Y1 Y2 Source: Ary, et al.
Explanation:
X1 and X2 : The students with different program. X1 for students of Office Administration Program and X2 for students of Marketing Program
Y1 and Y2 : The students’ ability. C. Variable of the Study
According to Ary, et al., variable is a representation of a construct that takes on a range of values.31 In this study there were two variables. They were office administration and marketing program at the eleventh-grade students of SMKN 2 Palangka Raya.
D. Population and Sample
1. Population
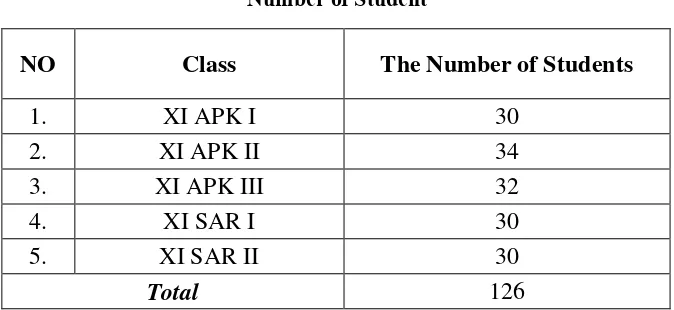
According to Ary population is all members of any well-defined class of people, events, or objects.32 Population in this research was the eleventh grade students of SMK N 2 Palangka Raya.
They consisted on the table as follows:
Table 3.2 Number of Student
NO Class The Number of Students
1. XI APK I 30
2. XI APK II 34
3. XI APK III 32
4. XI SAR I 30
5. XI SAR II 30
Total 126
The population of the study was all of the eleventh grade students in office administration and marketing program of SMKN Palangka Raya year 2013/2014. The number of population was 126 students. It was classified into three classes at office administration program and two classes at marketing program.
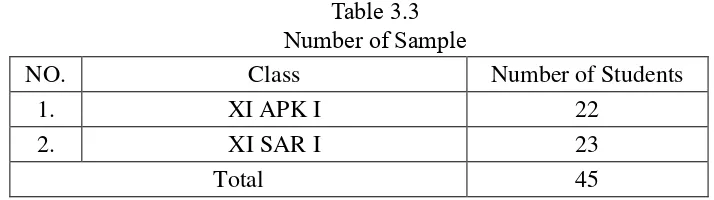
2. Sample
According to Ary, et al., sample is a small group that is observed which is portion of population. So the writer minimized the sample into 2 classes. One class from office administration program and one classes
from marketing program. In this research, the sample was chosen by using cluster sampling.
Cluster sampling is used if the population does not consist of individuals, but groups or cluster.33 The writer was determined two classes for sample.
Table 3.3 Number of Sample
NO. Class Number of Students
1. XI APK I 22
2. XI SAR I 23
Total 45
E. Research Instrument
According to Ary, et al., instrument is a device for operationally defining a variable.34 Selecting appropiate and useful measuring instruments is critical to the success of any research study. One must select or develop scales and instruments that can measure complex constructs such as intellgence, achievement, personality, motivation, attitudes, aptitudes, interests, and self-concept.35
Based on the theory above, the writer decided the instrument of the research as follows:
33 Nurul Zurich, Metodologi Penelitian Sosial dan Pendidikan (TeoriAplikasi), Jakarta:
1. Test
According to Donald Ary et al. Tests are valuable measuring
instruments for educational research. A testis a set of stimuli presented to
an individual in order to elicit responses on the basis of which a
numerical score can be assigned. This score, based on a representative
sample of the individual’s behavior, is an indicator of the extent to which
the subject has the characteristic being measured.36
Based on the explanation above, the research instrument was writing test to get the data. It was to measure the students’ ability of office administration and marketing programs at the eleventh grade of SMKN 2 Palangka Raya.
The writer gave the students’ score by using scoring rubric as follows:37
Scoring Guide: Functional Writing Assignment
ContentContent
Focus
When marking Content appropriate for the Grade 9 Functional Writing Assignment, the marker should consider the extent to which
Ideas and development of the topic are effective
The purpose of the assignment is fulfiled with complete and
Pertinent information is presented, and this information is enhanced by precise details that effectively fulfil the purpose of the assignment.
A tone appropriate for the addressee is skillfully maintained.
Excellent
Pf
The ideas are thoughtful, and development of the topic is enerally effective.
Signifiant information is presented, and this information is substantiated by specifi details that fulfil the purpose of the ssignment.
A tone appropriate for the addressee is clearly maintained.
Proficient
S
The ideas are appropriate, and development of the topic is adequate. Relevant information is presented, and this information is supported by enough detail to fulfil the purpose of the assignment.
A tone appropriate for the addressee is generally maintained.
Satisfactory
L
The ideas are superfiial and/or flwed, and development of the topic is inadequate.
Information presented is imprecise and/or undiscerning.
Supporting details are insignifiant and/or lacking. The purpose of the assignment is only partially fulfiled.
A tone appropriate for the addressee is evident but not maintained.
Limited
P
The ideas are overgeneralized and/or misconstrued, and development of the topic is ineffective.
Information is irrelevant and/or missing. Supporting details are obscure and/or absent. The purpose of the assignment is not fulfiled.
Little awareness of a tone appropriate for the addressee is evident.
Poor
INS
The marker can discern no evidence of an attempt to address the task presented in the assignment, or the student has written so little that it is not possible to assess Content.Scoring Guide: Functional Writing Assignment
Functional Writing Assignment, the marker should consider the extent to which words and expressions are used accurately and effectively
sentence structure, usage, and mechanics (spelling, punctuation, etc.) are controlled
Words and expressions used are consistently accurate and effective. The writing demonstrates confient and consistent control of correct
sentence structure, usage, and mechanics. Errors that may be present do not impede meaning.
The envelope and letter are essentially free from format errors and/or
omissions. Excellent
Pf
Words and expressions used are usually accurate and effective.The writing demonstrates competent and generally consistent control of correct sentence structure, usage, and mechanics. Errors that are present rarely impede meaning. The envelope and letter contain few format errors and/or omissions. Proficient
S
Words and expressions used are generally accurate and occasionally effective.
The writing demonstrates basic control of correct sentence structure, usage, and mechanics. Errors may occasionally impede meaning. The envelope and letter contain occasional format errors and/or
omissions. Satisfactory
L
Words and expressions used are frequently vague and/or inexact.The writing demonstrates faltering control of correct sentence structure, usage, and mechanics. Errors frequently impede meaning. The envelope and letter contain frequent format errors and/oromissions. Limited
P
Words and expressions used are inaccurate and/or misused.The writing demonstrates a lack of control of correct sentence structure, usage, and mechanics. Errors severely impede meaning. The envelope and letter contain numerous and glaring format errorsand/or omissions. Poor
2. Documentation
The writer used documentation as the second instrument of the study. Arikunto’s opinion states that “there are three kinds of source namely paper, place, and people”. This technique used to collect the data in the form of document on the study place. The data that needed such as:
a) The amount, the name, and the student’s sheet
b) The syllabus of English subject of SMKN 2 Palangka Raya c) The Lesson plans of English subject
d) The profile of teachers
e) The student’s score of writing application letter f) Pictures
According Ridwan stated that:
Documentation is indicated to get the data directly from the location of the research, include relevant books, rules, a report of activities, pictures, documenter film and the relevant data in the study.38
F. Validity
The quality that most affects the value of a writing assessment is
validity. Although dependent on reliability, validity is crucial to fair and meaningful writing assessment. It means that:39
1) An assessment task must assess what it claims to assess.
2) An assessment task must assess what has been taught.
38 Riduwan,
A valid test or measure is one which measures what it is intended to measure. Validity must always be examined with respect to the use which is to be made of the values obtained from the measurement procedure.40
1. Content Validity
Content validity refers to whether or not the content of the manifest variables (e.g. items of a test or questions of a questionnaire) is right to measure the latent concept (self-esteem, achievement, attitudes,…) that we are trying to measure.41Content validity also addresses authenticity, but it
draws on evidence of the topics that writers are required to discuss in target
domains, usually through a thorough needs analysis.42
2. Construct Validity
Construct validity is a slightly more complex issue relating to the internal structure of an instrument and the concept it is measuring. Once again, this is related to our theoretical knowledge of the concept we are wanting to measure.43 Construct validity concerns the qualities that the task
measures, how far it actually represents writing abilities.
G. Reliability
Muijs stated that:
Reliability does have a specific meaning when we are talking about statistical measurement. Basically, whenever we are measuring something, there is some element of error called measurement error.
40 T. Neville Postlethwaite, Module Educational Research: Some Basic Concept and Terminology, Paris: International Institute for Educational planing/UNESCO, 2005, p 39.
41 Daniel Muijs, Doing Quantitative Research in Education , London: Sage Publications, 2004, p.68.
Reliability then refers to the extent to which test scores are free of measurement error.44
Reliability refers to the degree to which a measuring procedure gives consistent results. That is, a reliable test is a test which would provide a consistent set of scores for a group of individuals if it was administered independently on several occasions.45 In addition, the writer used Inter-rater reliability to know reliability of the result of the test.
H. Data Collection Procedure
In this study, the writer used some procedures to collect the data. The procedures consists of some steps as follows:
1. The writer gave the test to the students.
The test had given to the students at the eleventh grade of SMKN 2 Palangka Raya, first the students at the office administration program, and second the students at the marketing program. The test was writing test by write the application letter for Hotel Swiss Bell Danum. The students of marketing program did the test on February 14th, the students of office
administration program did the test on March 4th, 2015.
2. The writer gave score to the students’ assignment using rubric for business letter writing.
The students’ score had given by two rathers. First, the writer as rater I, and second Rahmat Setiawan, S.Pd.I. as rater II.
44 Daniel Muijs, Doing Quantitative, p.71.
3. The writer analyzed the obtained data using manual calculation and SPSS 22 program.
4. The writer interpreted the analysis result.
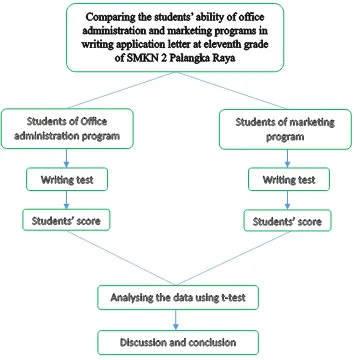
5. The writer concluded the difference on students’ achievement in writing a business letter between Office Administration (APK) and Marketing Program (PJL) in eleventh grade students of SMKN 2 Palangka Raya. Based on the explanation above, the writer concluded into a figure bellow:
I. Data Analysis Procedure
In order to analyze the data after collecting, the writer also did some procedure below:
1. Collecting the students’ score of test using rubric for business letter writing.
2.
Determining the Range of Score, the Class Interval, and Interval of Temporary, using formula46:The Range of Score (R) R = H – L + 1
Where :
H = Highest score L = Lowest sore
Class interval (K) = 1 + (3.3) × 𝐿𝑜𝑔 𝑛
Where:
𝑛 = Number of students
Interval of temporary = 𝑅𝐾
Where:
𝑅 = The range of score
𝐾 = Class Interval
3. Arranging the obtained the score into the distribution of frequency of score table.
4. Calculating mean, median, modus, standard deviation and standard error of students’ score.
a. Mean
Mx = ∑ 𝑓𝑥𝑁
Where:
Mx = Mean value
Σfx = Sum of each midpoint times by it frequency
N = Number of case 47
b. Median
Mdn = ℓ +12𝑁−𝑓𝑘𝑏
𝑓𝑖 𝑋 𝑖
Where :
Mdn = Median
ℓ = Lower limit (lower limit from score that contain Median)
fkb = Cumulative frequency that reside below the score that contain Median
ft = Genuine frequency
N = Number of case
u = Upper limit (upper limit from score that contain Median)
fkb = Cumulative frequency that reside above the score that contain Median.48
c. Modus
Mo = ℓ + (𝑓𝑎+𝑓𝑏𝑓𝑎 ) 𝑥𝑖
Where : Mo = Modus
ℓ = Lower limit (lower limit from interval that contain Modus)
fa = Frequency that reside above interval that contain Modus
fb = Frequency that reside below interval that contain Modus
u = Upper limit (upper limit from interval that contain Median)
I = Interval class.49
d. The writer calculated the standard deviation using the formula:
SD = √∑ 𝐹𝑥2−(∑ 𝐹𝑥)2𝑛 𝑛−1
Where :
SD = Standard Deviation
∑𝑓𝑥2 = Sum of the multiplication result betwen each skor frekuency with the squared deviation score.
N = Number of cases 50
e. The writer calculated the Standard error using the formula:
𝑆𝐸𝑀𝑥1 = 𝑆𝐷 √𝑁−1
5. Calculating error standard of difference mean using the formula:
𝑆𝐸𝑀𝑥1− 𝑆𝐸𝑀𝑥2 = √(𝑆𝐸𝑀𝑥1)2+ (𝑆𝐸𝑀𝑥2)2
Where:
𝑀𝑥1 = the mean of the first group
𝑀𝑥2 = the mean of the second group
𝑆𝐸𝑀𝑥1− 𝑆𝐸𝑀𝑥2 = standard error of the first and second group
6. Calculating t using the formula of t test using the formula as follows:
𝑡 = 𝑋1−𝑋2 𝑆𝐸𝑀𝑥1−𝑆𝐸𝑀𝑥2
Where:
𝑡 = the value of the mean difference will be judge
𝑀𝑥1 = the mean of the first group
𝑀𝑥2 = the mean of the second group
𝑆𝐸𝑀𝑥1− 𝑆𝐸𝑀𝑥2 = standard error of the first and second group
7. Calculating the degree of freedom by using the following the formula:
𝑑𝑓 = 𝑛 − 2 Where:
𝑑𝑓 = degree of freedom
8. Determining the level of significant of tobserved comparing the tobserved with
the ttable. If the result of the tobserved is higher than ttable it mean that Ha is
accepted but if the result of the tobserved is lower than ttable it mean that Ho
is accepted.