Vol. 16 No. 2 Agustus 2009 Abstract
The flow around a circular cylinder mounted normal to the channel bed is essentially a three-dimensional one. The flow upstream undergoes a separation of the turbulent boundary layer and rolls up to form a flow system, known as horseshoe vortex, which is swept around the cylinder. This vortex system plays an important role, if the bed material is movable. The shear stress of the vortex system is responsible to the bed erosion. The shear stress depends on the velocity gradient, may be presented as the vorticity. This study is done to gain a better understanding of the vorticity around a cylinder, especially where the system of vortices exist. Flow measure-ments were used to study the vorticity fields on flow with a horse-shoe vortex system around a pile. The velocity vector plots show the presence of a primary vortex upstream of the cylinder. Based on these velocity vectors, the vorticity can be analyzed by using central finite difference approximations. Results of the vorticity calcula-tion are presented as the vorticity contours. Results of study show the greatest value of the positive-vorticity on the horse-shoe vortex system is in the plane upstream of cylinder. This value decreases in the planes down-stream, attaining the lowest value in the plane downdown-stream, where the wake vortex established. The strength of the positive vorticity increases at larger Reynolds number. Underneath the field of positive vorticity, stretching around the cylinder, it appears a field of negative vorticity. This negative vorticity near the bed is high in front of the cylinder, proportional to the bed shear stress, which is responsible to the development of local scour at the movable bed. The line of zero vorticity is plotted originated at the bed, being as the separation point. It is also concluded that the maximum positive-vorticity is not necessary coincided with the center of the vortex.
Keywords: Horse-shoe vortex system, vorticity, Reynolds number.
Abstrak
Pola aliran di sekitar silinder bulat yang dipasang tegak lurus dasar saluran merupakan aliran tiga dimensi Aliran di hulu silinder membentuk separasi pada lapis batas turbulen, membangkitkan terbentuknya pusaran tapal-kuda yang mengelilingi silinder. Sistem pusaran ini mempunyai peranan penting jika material dasar mudah bergerak. Tegangan geser pada sistem pusaran akan menyebabkan terbentuknya erosi lokal. Besarnya tegangan geser bergantung pada perbedaan kecepatan, yang dapat dipresentasikan dengan nilai vortisitasnya. Studi ini bertujuan untuk mendapatkan pemahaman yang lebih baik tentang vortisitas di sekitar silinder, teru-tama di lokasi dimana terbentuk system vortex. Data hasil pengukuran kecepatan aliran dipakai untuk mempe-lajari system vortisitas pada aliran dengan sistem pusaran di sekitar pilar. Gambar vektor kecepatan di sekitar pilar silinder memperlihatkan keberadaan pusaran utama di depan silinder. Berdasarkan vector kecepatan tersebut, dapat dianalisis vortisitasnya dengan menggunakan metode beda hingga. Hasil hitungan vortisitas di-gambarkan dalam bentuk kontur vortisitas. Hasil studi menunjukkan nilai maksimum dari vortisitas positif (searah jarum jam) dari sistem pusaran tapal kuda adalah pada bidang simetri di hulu silinder. Nilai vortisitas tersebut menurun, mencapai nilai minimum di hilir silinder. Besarnya vortisitas positif meningkat pada angka Reynold yang lebih tinggi. Di bawah bidang vortisitas positif, diperlihatkan terbentuknya system vortisitas nega-tif. Vortisitas negative di dekat dasar di depan silinder mempunyai nilai yang besar, proporsional dengan nilai tegangan geser di dasar, yang bertanggungjawab pada terbentuknya erosi lokal pada saluran dengan dasar bergerak. Garis yang memberikan nilai vortisitas sama dengan nol, merupakan garis separasi antara vortisitas positif dan negative. Dari hasil kajian juga disimpulkan bahwa posisi dari vortisitas positif maksimum tidak se-lalu berimpit dengan pusat pusaran tapal kuda.
Kata-kata Kunci: Sistem pusaran tapal kuda, vortisitas, angka Reynolds.
Vorticity Fields on Flow with Vortex System
Bambang Yulistiyanto
Civil and Environmental Engineering Department, Faculty of Engineering, Gadjah Mada University Jl. Grafika 2 Yogyakarta 55281, E-mail: [email protected]
1. Introduction
The flow field in a shear flow around a circular cylin-der mounted normal to the channel bed is essentially a three-dimensional one. This type of flow is the result of the interaction between the two-dimensional undis-turbed shear flow and the cylinder in the region of the pressure gradient set up by the cylinder. The flow upstream undergoes a separation of the turbulent boundary layer and rolls up to form a flow system, known as horseshoe vortex, which is swept around the cylinder. This vortex system plays an important role, if the bed material is movable. The shear stress of the vortex system may be responsible to the bed erosion. The shear stress depends on the velocity gradient, may be presented as the vorticity.
Yulistiyanto, 1997, studied numerically flow fields around a cylinder and verified by experimental study to find velocity distribution in longitudinal, transversal and vertical directions. It was also presented the turbu-lence intensities, which is moderate in front of the cylinder, but increases enormously behind the cylin-der, due to the fluctuations in the wake vortex. The flow upstream undergoes a separation of the tur-bulent boundary layer and rolls up to form a flow sys-tem, known as horseshoe vortex, which is swept around the cylinder (Yulistiyanto, 2009). The flow around a vertical circular pile exposed to a steady current is studied experimentally. Yulistiyanto, 2009, showed the present of the vertical velocities distribu-tions of the flow around a cylinder, showing a highly three-dimensional picture, being reasonably organized in the front and less organized in the back of the cylin-der, where flow separation takes place. It also shows that a horseshoe-vortex system is established, existing of a measurable vortex with underneath a return flow. This type of flow occurs in a variety of situations, such as flow around bridge piers, around buildings and structures, and at different types of junctions. The horseshoe-vortex system plays an important role, if the bed material is movable. The shear stress of the vortex system may be responsible to the bed erosion. In this paper, this shear stress will be presented as the vorticity, containing the gradient of the velocity distri-butions.
Studies of vorticity fields were performed using numerical and visual methods (Green and Gerrard, 1993; Okude and Matsui 1989). The author investi-gates vorticity around a cylinder based on three dimen-sional velocity measurements in radial directions to the cylinder. This gives a better understanding about the complexity of flow fields around a cylinder.
2. Velocity Measurements
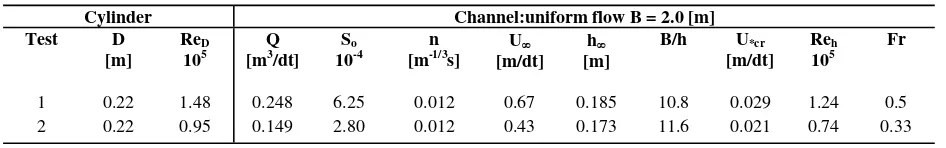
Experiment measurements were conducted by Abdul Barbhuiya and Dey (2003), for flow around a vertical semicircular cylinder attached to the sidewall and at a wing-wall abutment installed at a rectangular channel, and by Andreas Roulund at.al. (2005). Flow fields upstream of an obstacle was explored by Graf and Yulistiyanto (1997), showed development of vortex upstream from the cylinder. Velocities around a cylin-der were investigated experimentally (Dargahi, 1989; Yulistiyanto, 1997 and 2009), results the velocity distributions in different planes upstream and down-stream from a cylinder. Two tests have been per-formed by Yulistiyanto, 1997, and whose hydraulic characteristics are given in Table 1.
The experiments were performed in a 43.0 [m] long and 2.0 [m] wide tilting flume. An Acoustic Doppler Velocity Profiler (ADVP) was used to measure the velocities. Detailed information on the experimental installation and experimental results are found else-where (Yulistiyanto, 1997 and 2009).
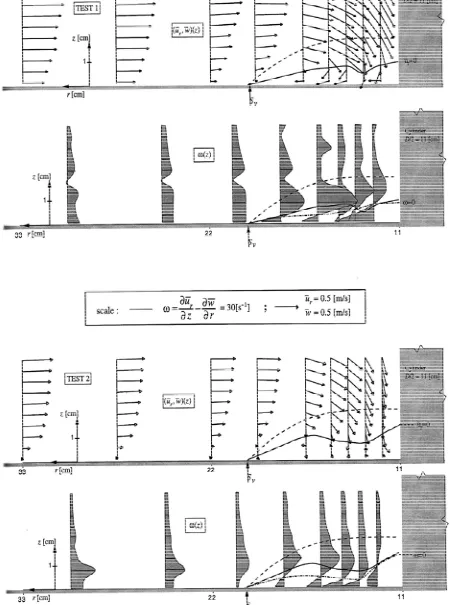
3. Velocity Distributions
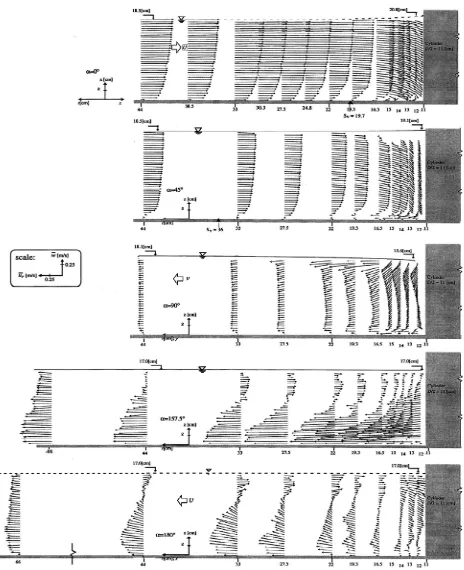
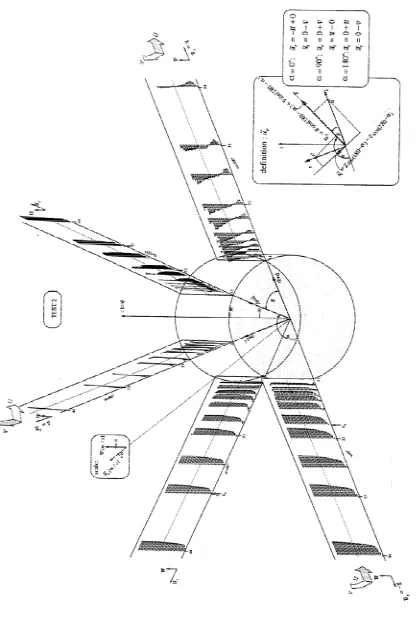
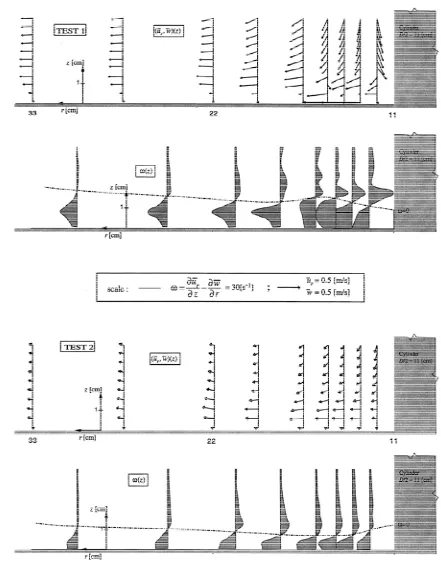
Instantaneous velocities distributions, u(z), v(z), w(z), were measured at different points, P(x,y,z) or P(r,α,z), in the range of 12<r[cm]<44 and 0<α[o]<180 around the cylinder; the origin was positioned in the centre of the cylinder, P(0,0,z), whose radius is r=11[cm]. The vertical distributions of the velocities for Test 1 are presented in Figure 1. For Test 2, they are showed in axonometric form in Figure 2 (Yulistiyanto, 2009).
Table 1. Flow variables and channel parameters
Cylinder Channel:uniform flow B = 2.0 [m]
Vol. 16 No. 2 Agustus 2009
in Planes 0o, 45 o, 90 o, 157.5 o, and 180 o, for Test 1 ur w
Figure 2.
Axono
metric re
pre
sentatio
n
of fl
ow
in pla
n
es
a
round a c
y
lind
e
r, for te
Vol. 16 No. 2 Agustus 2009
4. Discussion
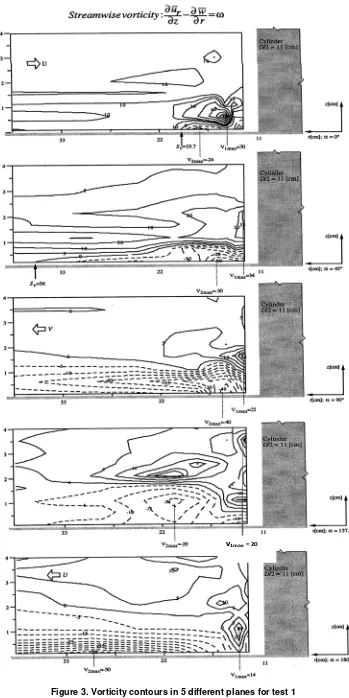
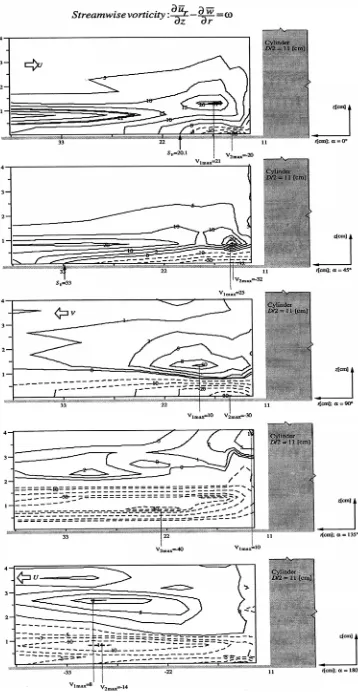
4.1 Streamwise vorticity
From the velocity distributions, it is evident that a vorticity, ωt, exists, to be calculated as :
Using Equation 1, it is possible now to compute the vorticity components, ωt (central finite difference approximations are used). This is illustrated in Figure 3 and Figure 4 for both tests, each is for the five planes. Note, that only a sub domain near the bed, 12 < r [cm] < 44 and 0 < z [cm] < 4, has here been evalu-ated.
In Figure 3 and Figure 4, it can be seen that a system of vorticity of different strength is noticeable. How-ever a positive vorticity shows a pronounced design. The location, C+, of the maximum positive vorticity,
ωtmax(+), is given for : value decreases in the planes downstream, attaining the lowest value in the plane 180°. The ωtmax(+) for Test 1 are bigger than the ones for Test 2. This concludes that the strength of the positive vorticity increases at larger Reynolds number.
Underneath the field of positive vorticity, stretching around the cylinder, is what it appears to be a field of negative vorticity. The location, C-, of the maximum negative vorticity, ωt plane 157.5° which has a smaller value than in plane 135°. The regions of the negative vorticity increase in size in planes downstream, however their strengths are not necessary increased. The existence of the reversal flow very close to the bed, in front of the cylinder (planes 0o and 45o), should give the negative shear stress, presented as the negative vorticity. It was reported that the beginning of the scour is not at the upstream of the cylinder, showed by the highest value of the negative vorticity, located near the bed, in plane 45o for Test 2 and in plane 90o for Test 1. In plane 135o for Test 2, the ωtmax(-) is high, however its location is far from the bed, at z/D = 0.039. For Test 1, in plane downstream, its value is also high, however its loca-tions is far enough from the cylinder, r/D = 1.37.
v1max= 20
Vol. 16 No. 2 Agustus 2009
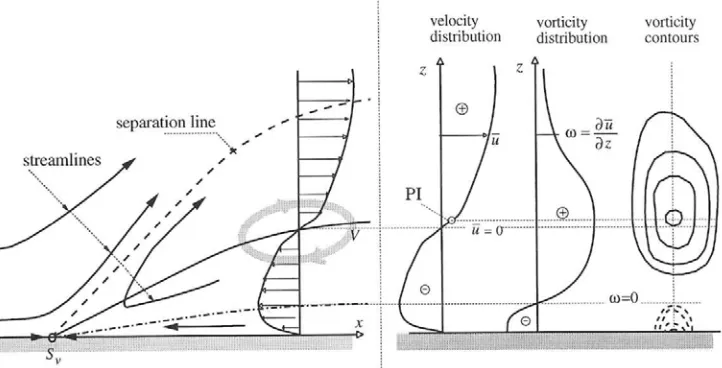
4.2 Connection between the radial velocity the vorticity field
Figure 5 shows the connection between the radial velocity, , and the vorticity field, ω. For the sake of simplificity a parallel flow is considered in Figure 5. Due to the pressure gradient, dp/dx > 0, there exists a point for which the vertical velocity gradient is zero at
the bed, , at which the water close to the
bed is not able to travel along the bed and separates from it. This position is called the separation point, which is defined as a point of transition from the for-ward and reverse flow. The flow upstream of the sepa-ration point is not much affected by sepasepa-ration, but the flow downstream of the separation point changes, showing reverse flow.
From the measured velocity distributions, , the
vorticity distribution, , can becomputed, sub
sequently the vorticity contours are obtained. It can be seen, that a clockwise vortex, V, containing positive vorticity, and a reverse flow in the underneath, contain-ing negative vorticity, are created.
The line of ωt = 0 coincides with the maximum reverse velocity. The regions above and under this line have always positive and negative vorticity, respectively.
Above this line, there is a line of = 0, indicat-ing the centre of the vortex.
The maximum positive vorticity is defined as being as the point of inflexion (PI). The position of this inflexion point is not necessary coincided with the point
of = 0.
Relations between the radial velocity and the vorticity described in Figure 5 can readily be observed in the
ur
Figure 5. Connection between the radial velocity, ur, and the vorticity field, ω
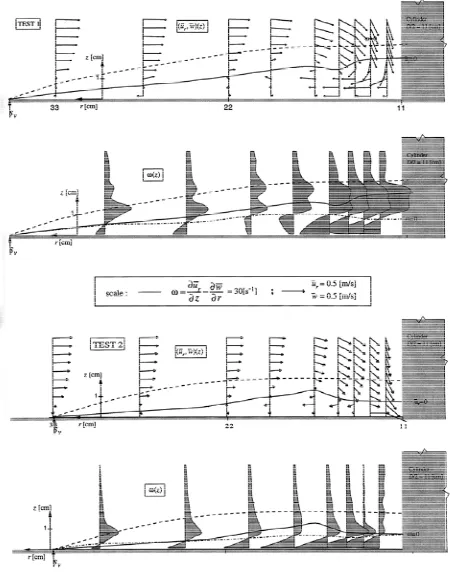
measured velocity and calculated vorticity fields, shown in Figures 6, 7, and and 8 for the both tests in the planes α = 0°, α = 45° and α = 90°. Here the flow is no more parallel, the streamlines are curved. The velocity distributions show clearly the flow rever-sal, while the vorticity distributions show to be the expected shape, given with Figure 5.
The line of = 0 and the line of wt = 0 are also
plotted together with the separation line in Figure 6 to
8. These lines are originated at the bed, being as the separation point, Sv. At region near the leading edge of the cylinder, the gradient of the vertical velocity is
always less then zero, < 0, consequently,
according to equation. 1, the position of wt = 0 is under the maximum reverse velocity. This line slightly
climbs up in planes downstream. The lines of = 0
in planes 0° and 45° are under the maximum positive vorticity (being as the position of the point inflexion). The separation line between the vortex region and the main flow is traced approximatively.
The separation points in planes α = 0° and α = 45° for
Vol. 16 No. 2 Agustus 2009
Vol. 16 No. 2 Agustus 2009
5. Conclusions
Measurements of flow structure upstream and around a cylinder were reported for fully developed turbulent open-channel flow at ReD=105, resulting the three-dimensional velocity profiles. From these velocity distributions, the vorticity distribution can be com-puted, subsequently the vorticity contours are obtained. It can be seen, that a clockwise vortex, con-taining positive vorticity, and a reverse flow in the underneath, containing negative vorticity, are created. The vorticities are presented as vorticity contours at five different planes around a cylinder. It can be seen that a system of vorticity of different strength is noticeable, which a positive vorticity shows a pronounced design. Its greatest value is in the upstream plane, and their value decrease in the planes downstream, attaining the lowest value in the plane 180°. It is also showed the existence of a reverse flow, produced the negative vorticity. If the bed of the chan-nel is mobile, it is probable that the strong of the nega-tive vorticity does the erosion, while the vortex with positive vorticity participates in the transportation of sediments. The line of zero vorticity is also plotted originated at the bed, being as the separation point, Sv.
Notations
a = Distance of the separation point from the
edge of the cylinder;
D = Diameter of cylinder;
C+, C- = Position of maximum vorticity;
h∞ = Depth of uniform flow;
Q = Discharge;
r = Distance of point from center of cylinder;
Reh = Flow Reynolds number;
Sv = Separation point;
u*x = Longitudinal friction velocity;
U∞ = Longitudinal uniform velocity;
x, y, z = Longitudinal, transversal, and vertical coor dinates;
α = Radial direction of plane;
ωt = Tangential vorticity;
References
Barbhuiya, A.B. and Dey, S., 2003, Measurement of Turbulent Flow Field at a Vertical Semicircular Cylinder Attached to the Sidewall of a
Rectangular Channel, Flow Measurement and
Instrumentation, Volume 15, Issue 2, April 2004, Pages 87-96, Elsevier.
Andreas, R, Sumer, B.M., Jorgen, F., and Jess, M.,
2005, Numerical and Experimental
Investiga-tion of Flow and Scour Around a Circular Pile,
Journal of Fluid Mechanics, 534:351-401, Cambridge.
Dargahi, B., 1989, The Turbulent Flow Fields Around a Circular Cylinder, Experiments in Fluids, Vol. 8, pp. 1-12.
Graf, W.H. and Yulistiyanto, B., 1997, Experiments on Flow Upstream of a Cylinder, San Francisco, USA: PROC., XXVII Congr., Int. Assoc. Hydr. Res., Vol. 1.
Green, R.B., and Gerrard, J.H., 1993, Vorticity Measurements in the Near Wake of a Circular Cylinder at Low Reynolds Numbers, Journal of Fluid Mechanics.
Okude, M., and Matsui, T., 1989, Vorticity Distribu-tion of Vortex Street in the Wake of a Circular Cylinder, Japan Society for Aeronautical and Space Sciences. Japan: Journal (ISSN 0021-4663), Vol. 37, No. 431.
Yulistiyanto, B., 1997, Flow Around a Cylinder Installed in a Fixed-bed Open Channel, Ph.D Dissertation 1631, Ecole Polytechnique Federale, Lausanne, CH.
Yulistiyanto, B., 2009, Velocity Measurements on Flow Around a Cylinder, Indonesia: Dinamika Teknik Sipil, Vol. 10.
u
,v
,w
= Longitudinal, transversal, and vertical point velocities;r