JEJAK
Journal of Economics and Policy http://journal.unnes.ac.id/nju/index.php/jejak
The Evaluation Study of the Determination of the Sub-District IMB
Retribution Revenue in Bandung District
Fernandes Simangunsong1
1Institute of Public Administration, Indonesia
Permalink/DOI: http://dx.doi.org/10.15294/jejak.v8i2.6170
Received: Juli 2015; Accepted: Agustus 2015; Published: September 2015
Abstract
The aim of this study is for knowing the realization of IMB levy achieved by all districts in Bandung regency and their potency. This study implemented qualitative and quantitative approach with triangulation technic. After analizing the data, there are some findings. First, there are only five districts that can achieve the target of 100%. They are Pasir jambu, Cicalengka, Soreang, Kutawaringin and Cimenyan. Next, the average realization of IMB levy in Bandung regency is Rp Rp. 820.034.365,00 or 72,53% of total target. It is is still
far from the target due to some factors. They are limited human resources, low monitoring, low society’s participation in having IMB and low motivation from implementers for carrying out the policy. Further, based on high , moderat, and low approach, the potency of receiving IMB levy is good enough. If the assumption of IMB levy is 5%, the estimation of levy target is 47.849.901.114 with high approach, Rp 41.969.646.924 with high moderate and, Rp 36.099.392.733. with low approach.
Keywords: levy target, levy, IMB
How to Cite: Simangunsong, F. (2016). The Evaluation Study of the Determination of the Sub-District IMB Retribution Revenue in Bandung District. JEJAK: Jurnal Ekonomi Dan Kebijakan, 8(2), 183-199.
doi:http://dx.doi.org/10.15294/jejak.v8i2.6170
© 2015 Semarang State University. All rights reserved Corresponding author :
Address: Ir. Soekarno Street, Miles 20, Cibeusi Village, Jatinangor, Sumedang District, West java
E-mail: [email protected]
INTRODUCTION
The implementation of regional autonomy carries enormous consequences in regional management paradigm. One of its component is fiscal decentralization by which it states that the region has high financial management authority (Setiaji and Adi, 2007). In the autonomy era, the area is required to further enhance the independence of the (financial) to finance various regional expenditure. According to Section IV, Article 7, paragraph 1 of Law No. 32/2004, Regional Authority covers authority in all areas of government except for authority in the field of foreign policy, defense and security, justice, monetary and fiscal, religion, and authority of other fields. Whereas the Article 2 states the Authority in other areas include policies on national planning and national development control and control of macro national development, financial balance, the system of state administration and economic institutions, the acceptance and empowerment of human resources, the efficient use of natural resources and strategic high technology, conservation and national standardization.
The paradigm of financial management at both the provincial and district / town experienced a very significant change in line with the implementation of regional autonomy since the beginning of 2001. This is reinforced by Law No. 32 of 2004 Regarding Regional Government and Law No. 33 of 2004 On Financial Balance Between Central and Local Government. The enactment of both laws provides greater opportunities to region to further optimize its potential, both related to human resources, funds and other resources that the regional wealth. The essence of decentralization is the greater role in the administration and areas management including financial management.
Mardiasmo (2002) argues that regional autonomy is no longer simply to execute the instructions of the center government, but actually has the discretion to increase creativity in developing the potential for autonomy could be said to be chained. The local government is expected to become more independent, to reduce dependence on the central government, not only related to financing, but also associated with the (ability) of area management. Related to this, the local government is expected to be closer in various public service activities in order to improve the level of public confidence. Along with the increasing levels of confidence, the expected level of participation (support) public against local governments is also higher.
Dreams and national goals provide direction for the implementation of development in order to be effective, efficient, and in accordance with the objectives to implement regional autonomy and fiscal decentralization. The purpose of decentralization is to provide better public services and create public decision making process more democratic, then it is required to have a policy which is capable of realizing the dreams and objectives. One of the policies taken by the government is to implement regional autonomy and fiscal decentralization. Decentralization is basically made up of political decentralization, administrative decentralization, fiscal decentralization, economic or market decentralization (Finance Department, 2008: 1). The implementation of decentralization is realized through the provision of assistance in the form of transfers from the central
2009: 2). Centralized system run by the central government, so far, gives birth to the economic crisis and the confidence that struck and positive and negative impact on the efforts to improve the welfare of all the people of Indonesia and led to the dependence of local governments in drawing policies taken in the focused area because of always waiting for policies that set of central government and generally applicable in the area, including the assistance provided by the central government in the form of subsidies and transfers for funding development undertaken in the area. In accordance, it is required the granting of authority to local governments to manage its own family in order to realize the independence of the region (Mardiasmo, 2004: 3).
The change of mindset from centralization to decentralization in the meaning of delegation of authority within the meaning of the central government to autonomous regions, is needed at this time. If it had to take the decision to wait pointer and direction from the center in the form of proposals for strategic, in line with that led to legislation to manage the local administration and the empowerment of local finance to be more useful for regional development from planning, organizing, implementation and supervision of the collection and distribution are instruments to increase local revenue sources (Yustika, 2006: 9)
In revamping and giving alternative on the construction of a policy, there needs to giving flexibility to local governments to run the government and responsible for the implementation of regional development in accordance with applicable rules in governance in the region through Act No. 32 of 2004 on local authorities and Law No. 33 of 2004 on the financial balance of central and
local government (Finance Department, 2008: 2). Moreover, the sources reception area refers to the law on financial balance between the central and regional magnitude adjusted and harmonized with the division of authority between the central government and local governments. In this case the local authorities are given the right to obtain the certainty of availability of financial resources in the form of funding from the government according to government affairs which are submitted, namely the authority of collecting and utilizing taxes and levies, the right to earn a share of national resources that are in the area and other equalization funds as well as to manage the wealth of the area and get financing resources with the basic principle of money follow function (Yuwono, 2008: 46).
The main characteristic of a region is located in the area of financial capability. It means that the autonomous region should have the authority and ability to dig their own financial resources to carry out the functions of government. Financial factor is a very important thing because, virtually, there is almost none of government activities that do not cost a cent. The local government is not only expected to be able to explore the sources of finance but also be able to manage and use
value for money in relation to the
implementation of local government, so that the dependence on central government aid should be reduced to a minimum. By reducing the dependence on the central government, the own-source revenue (PAD) can be the greatest financial resources. This activity should be supported by policies of financial balance of central and local government as a prerequisite in the system of government (Koswara, 2000: 50).
Fiscal capacity is measured by looking at two important aspects that are reviewed by Degree of Fiscal Decentralization (DDF) to see the comparison between the amount of own-source revenue (PAD) with the magnitude of the reception area as a whole and in addition, they can also be reviewed by Index ability routine (IKR) by viewing the comparison of the percentage of the value of the regional own-source revenue by standardized routine expenditure area with the respective criteria, but in fact, the majority of regions are still in the range of 10% to 50% (Kuncoro, 1995: 9). Local autonomy and decentralization require the readiness of all parties in the executive, legislative and community in the area. One important aspect of local autonomy and decentralization which should be regulated carefully is the issue of financial management to explore the sources of potential areas that have not been optimized by the region in containers fiscal
decentralization of regional autonomy under decentralization comprehensive, realistic and responsible. Thus, the financial management of particular area that is able to control the financial policy of regional economic, efficient, effective, transparent and accountable is needed. (Kaho, 1991: 123)
The indicators of the poor ability of the area to finance the development can be seen from Routine Capabilities Index (IKR) obtained from the ratio change in own-source revenue (PAD) against routine expenditure area.
development potential of the region is to devise a Master Plan revenue (PAD).
The availability of potential data of PAD and PAD development master plan are also a manifestation of budget transparency so that the public can access them widely and can oversee and advocate the use of the public budget. In general, levies according to law No. 28 of 2009 on Local Taxes and Levies are local taxes as payment for services or certain special permits provided and / or granted by the regional government for the benefit of private persons or entities. In Act No. 25 of 1999 stated that the source of revenue in the implementation of decentralization, are classified into four (4) sources, namely: (i) the PAD (Regional Income); (ii) Balance Fund; (iii) Regional Loan; and (iv) Other Revenue legitimate. Especially, with regard to PAD, it can be said that the role / contribution to the overall budget (Budget Revenue and Expenditure) is still relatively small. Later in Act No. 33 of 2004 as a refinement of Law No. 25 of 1999 explained that the reception area is composed of two sources, namely: (1) Regional Revenue, and (2) Acceptance of the Regional Funding. Local revenues consist of: (1) revenue, (2) Balance Fund, and (3) Other legal area income. Meanwhile the area's lending is categorized as a part of the
Regional Funding Acceptance. Funeral Service and Ashing corpse, Service Fees for Parking at the Public bank Road, Service of Fees Market, Levy of Testing Motor
Vehicles, Levy of the Inspection extinguisher, Levy of the Replacement Cost of Printing Maps, Levy of provision and / or suctioning latrines, Levy of Liquid Waste Processing, Service Fees of Calibration / Recalibration, Education Service Fees and Levies of the Control of Telecommunication Tower. On the one hand, other types of levies which are included within the category of charges for services are: Retribution of Local Resources, Levy of Wholesale Markets and / or Shops, Levy of auction place, Levy of Terminal, Levy of Special Place Parking, Levy of licensing levies are: Building Permits, Licenses Point of Sale of Alcoholic Beverages, Disturbance Permits, Licenses Route and Fisheries Business Permits. Determination of Target Acceptance Levy Building Permit (IMB) based on the Bandung Regulation Number 16 of 2009 on the Building and Bandung District Regulation No. 13 Year 2012 on certain licensing levies. Based on the above both the regulation explains that the building permit in the administration building structure includes; a) Building; b) Change the Function of Buildings; and c) Change Building.
the activities that do not require Building Permits are: a) The facility for Indonesia army (TNI) / Police And secret Government documents; b) Emergency building For The temporal Purposes or Not More Than 100 (one hundred) days; and c) Road And Building for the sewage Funded And Executed by the Government with the Exception on the commercial business.
Government can regulate and increase the levy by a variety of efforts. Shackelford et al (2010) stated that in the policy of environment, the traditional approach to do is to perform commands through regulation. Taylor (2013) suggested that the public is willing to pay a levy when needed and against - the vulnerable in society. Nevertheless, there are still obstacles if it is to intensify the levy, namely incomes. If the people's income increases, the possibility of intensification levies could be easier. This is similar delivered Daughter (2013) where there is a positive correlation between the per capita income to tax, where tax similar to a levy. Based on the background of the problems outlined above, there are various problems that can be identified as not achieving the target of retribution which permit the District to the fullest achievement in Bandung regency and yet unexplored and untapped potential of IMB held by sub-districts for achieving the target of IMB retribution in Bandung. Therefore, the focus of research is on the evaluation of targeting the IMB District retribution so that later can increase the Regional Revenue (PAD) of Bandung regency. Based on the background described above, then the problem can be defined as how is the mechanism of achieving the maximum target of retribution done by the Bandung Regency and how are the procedures for digging and utilizing the potential of IMB owned by sub-districts for achieving the retribution target of sub-district IMB in Bandung district.
RESEARCH METHODS
To obtain accurate data and achieve the objectives of the research, this study needs to be supported by the use of appropriate research methods. The methodology is derived from the word "metos" and "logos" with the meaning of how to set or elaborate, so methodology means a description of the ways to arrange something with the best. While "research" is an activity to locate, record, formulate and analyze to draw up a report. In line with the research term, David H. Hendry (2004: 1) states that: research is a systematic thinking on various types of problems whose solutions require the collection and interpretation of facts.
This study uses descriptive analysis and quantitative analysis. According to Lexy J. Moleong quoted Bagdav and Taylor (2003: 3) that of Qualitative Methods is a research procedure that produces descriptive data in the form of words written or spoken of people and behavior which are observed
its validity is still visible with complete and reliable.
In this study the main assessment instrument is the researchers themselves. But in its development, there will be prepared some research instruments used to collect data on a wider data sources, and sharpen and complement data from interviews and observations. Principally, the focus of research is to reassert what became the central of this current study. In other words, the complexity of the problems that arise and occur in the setting in which the study is carried out would certainly complicate the researchers, because sometimes there are several issues which are almost equal to the final goal of the researcher.
The data required in these studies are quantitative and qualitative data with the basis on the evaluation of the target of retribution of sub-district IMB. Therefore, they are divided into; a) primary data obtained by field studies, carried out by way of seeing, observing, recording and interviewed directly political officials, local officials, community leaders and other target
groups; and b) secondary data, collected to complete the primary data, both available in the counties, districts and other agencies that have information related to the topic of this assessment. Secondary data were obtained with an assessment of documents, reports and other library materials. The data collection techniques selected in the field of research is the use of questionnaires, interviews, observation and study of literature.
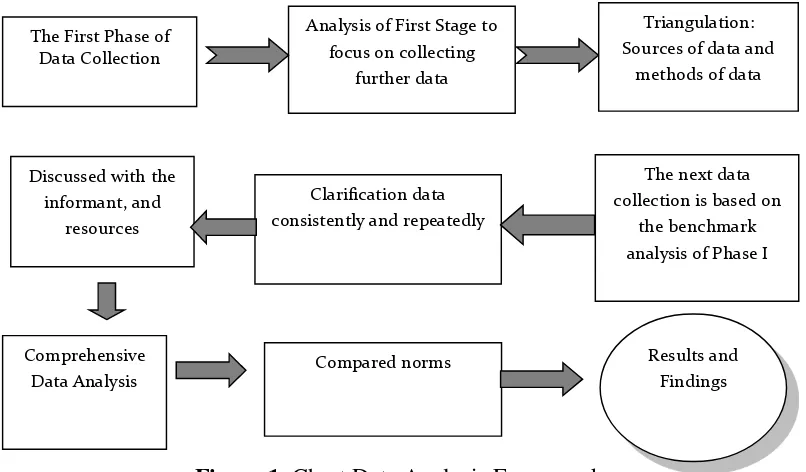
The
analysis of the data can be explained to the
following chart form.
The qualitative data will be analyzed through the content and depth analysis using the applied approach to transfer the phenomena happened to the object of study. It starts from the list of structures of open question, then fitted with a compilation of the results of in-depth interviews, and observations in the field. After that, the variable will be compiled through a structured file. Alternatively, the validation of the data is done by using triangulation techniques that check, recheck and cross-check the data obtained (Bogdan and Biklen, 1986: 192).
Figure 1
. Chart Data Analysis Framework
The First Phase of Data Collection
Analysis of First Stage to focus on collecting
further data
The next data collection is based on
the benchmark analysis of Phase I Discussed with the
informant, and resources
Clarification data consistently and repeatedly
Results and Findings Triangulation: Sources of data and
methods of data
Comprehensive Data Analysis
Triangulation is an examination
technique that utilizes something else beyond the data with purpose of checking and comparing the data. In addition, triangulation can be done by asking for input, suggestions, criticisms and comments from researchers or other observers to identify threats to validity, biases and assumptions of researchers and weaknesses of the logic in the ongoing review. Apart from that, the triangulation techniques used in this study is checking technique that utilizes the use of resources (observations, interviews, literature studies and archives). At last, triangulation by means comparing source and check to return an informant degree of confidence is gained through time and different tools in qualitative methods.
RESULTS AND DISCUSSION
The Determination of Target Acceptance of Levy Building Permit (IMB) in Bandung regency is guided by the Bandung District Regulation Number 16 of 2009 on the building. Building permit in the administration building structure includes; a) Building; b) Change the Function of Buildings; and c) Change Building. Each activity of building in the district of Bandung requires to have a building permit. Every person who changes the building function for specific purposes rather than the general function declared in the Building Permit requires to have a permit for changing the function of the building. Each building owners who wants to change the shape of the
building is required to have permits for changes in shape of the building. To obtain a building permit. The purposes of building permits in Bandung Regency are; a) to Provide Legal Validity of Building Management In Any Event, b) to Control any Activity related to the Building Management Implementation, c) to Provide Platform for Rule of Law and Protection Law in Building Management Activity and d) to Protect Public Interests and the Environment.
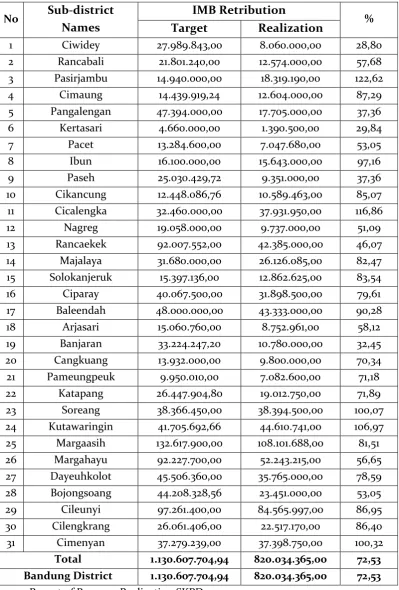
The target and realization of revenues of IMB retribution in Bandung regency in each district of 2014 is shown in Table 1.
The table 1 shows the percentage of achievement realization of IMB retribution om each district from the defined levy targets. Therefore, the achievement realization of IMB retribution between 25% -50%, between 50% -75%, between 75% -100% and above 100%, is presented as follows.
Table 1. Target and Realization of IMB retribution Per Sub-district in 2014
No
Sub-district
Names
IMB Retribution
%
Target
Realization
1 Ciwidey 27.989.843,00 8.060.000,00 28,80 2 Rancabali 21.801.240,00 12.574.000,00 57,68 3 Pasirjambu 14.940.000,00 18.319.190,00 122,62 4 Cimaung 14.439.919,24 12.604.000,00 87,29 5 Pangalengan 47.394.000,00 17.705.000,00 37,36 6 Kertasari 4.660.000,00 1.390.500,00 29,84
7 Pacet 13.284.600,00 7.047.680,00 53,05
8 Ibun 16.100.000,00 15.643.000,00 97,16
9 Paseh 25.030.429,72 9.351.000,00 37,36
10 Cikancung 12.448.086,76 10.589.463,00 85,07 11 Cicalengka 32.460.000,00 37.931.950,00 116,86 12 Nagreg 19.058.000,00 9.737.000,00 51,09 13 Rancaekek 92.007.552,00 42.385.000,00 46,07 14 Majalaya 31.680.000,00 26.126.085,00 82,47 15 Solokanjeruk 15.397.136,00 12.862.625,00 83,54 16 Ciparay 40.067.500,00 31.898.500,00 79,61 17 Baleendah 48.000.000,00 43.333.000,00 90,28 18 Arjasari 15.060.760,00 8.752.961,00 58,12 19 Banjaran 33.224.247,20 10.780.000,00 32,45 20 Cangkuang 13.932.000,00 9.800.000,00 70,34 21 Pameungpeuk 9.950.010,00 7.082.600,00 71,18 22 Katapang 26.447.904,80 19.012.750,00 71,89 23 Soreang 38.366.450,00 38.394.500,00 100,07 24 Kutawaringin 41.705.692,66 44.610.741,00 106,97 25 Margaasih 132.617.900,00 108.101.688,00 81,51 26 Margahayu 92.227.700,00 52.243.215,00 56,65 27 Dayeuhkolot 45.506.360,00 35.765.000,00 78,59 28 Bojongsoang 44.208.328,56 23.451.000,00 53,05 29 Cileunyi 97.261.400,00 84.565.997,00 86,95 30 Cilengkrang 26.061.406,00 22.517.170,00 86,40 31 Cimenyan 37.279.239,00 37.398.750,00 100,32
Total 1.130.607.704,94 820.034.365,00 72,53
Bandung District 1.130.607.704,94 820.034.365,00 72,53
Meanwhile, for the sub-districts whose average has reached 100% and even more than 100% is expected to be given supervision and guidance on a regular basis by the government so that the sub-districts are able to maintain the achievements IMB retribution and if necessary can also be upgraded again in the target of retribution IMB in these sub-districts.
There are several factors which influence the IMB retribution of sub-districts in Bandung. First, the factor of the Human Resources (SDM). SDM is an important factor in carrying out activities in the organization, particularly in implementing policies that have been charged to the organization. Because of the limitations and the inability to have good quality of human resources and superior in terms of technical and theoretical, it would be very difficult for the organization in applying the defined goals. From the input
aspect, it can be realized that the organization have limited human resources to carry out the management of IMB retribution well. As a result, it needs coordination with other public institutions in order to achieve the retribution of IMB well, including coordinating with the sub-districts and villages / wards. It is said so because the limitations of human resources greatly affect the implementation of the instructions, suggestions and so forth that have been set, so that by having supervision, all what is planned can be realized. Therefore, there are standards in the process of monitoring, namely assessment and evaluation. In addition, the fact shows that the supervision process is not yet optimal, especially in monitoring the implementation of development undertaken by the
community who have no IMB. These facts happen many times in the field, so they require extra supervision so that the building activity will only be conducted by those who already own IMB. Hence, by having maximum control, it is expected that the public concern and desire to take care of IMB is getting bigger and higher.
The third factor in the evaluation of the levy is community participation. The community participation is the participation of the public against the government program, either in the mind, mental and funding. The involvement happened means that society is a subject and object in the implementation of government policy. Community participation is urgently needed, especially in the awareness of the management of IMB in implementing physical building. In line with this, in generating the community participation, the intense persuasion is needed so that people will have an understanding of the importance of the maintenance of the IMB and the IMB payments to the government.
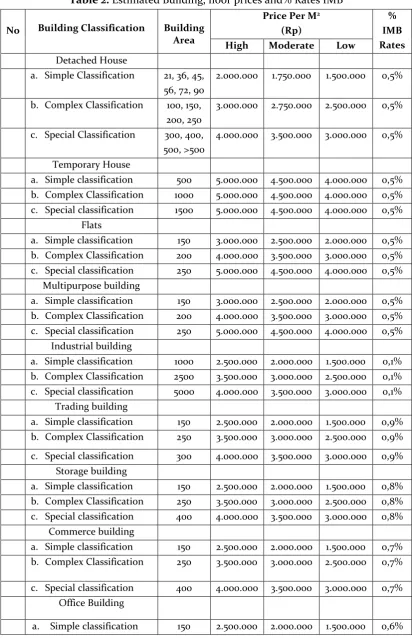
District Regulation No. 19 of 2009 on the building. Meanwhile, the detail is as follows.
Table 2. Estimated Building, floor prices and% Rates IMB
No Building Classification Building Area
Price Per M2
(Rp)
% IMB Rates
High Moderate Low
Detached House
a. Simple Classification 21, 36, 45, 56, 72, 90
2.000.000 1.750.000 1.500.000 0,5%
b. Complex Classification 100, 150, 200, 250
3.000.000 2.750.000 2.500.000 0,5%
c. Special Classification 300, 400, 500, >500
4.000.000 3.500.000 3.000.000 0,5%
Temporary House
a. Simple classification 500 5.000.000 4.500.000 4.000.000 0,5% b. Complex Classification 1000 5.000.000 4.500.000 4.000.000 0,5% c. Special classification 1500 5.000.000 4.500.000 4.000.000 0,5%
Flats
a. Simple classification 150 3.000.000 2.500.000 2.000.000 0,5% b. Complex Classification 200 4.000.000 3.500.000 3.000.000 0,5% c. Special classification 250 5.000.000 4.500.000 4.000.000 0,5%
Multipurpose building
a. Simple classification 150 3.000.000 2.500.000 2.000.000 0,5% b. Complex Classification 200 4.000.000 3.500.000 3.000.000 0,5% c. Special classification 250 5.000.000 4.500.000 4.000.000 0,5%
Industrial building
a. Simple classification 1000 2.500.000 2.000.000 1.500.000 0,1% b. Complex Classification 2500 3.500.000 3.000.000 2.500.000 0,1% c. Special classification 5000 4.000.000 3.500.000 3.000.000 0,1%
Trading building
a. Simple classification 150 2.500.000 2.000.000 1.500.000 0,9% b. Complex Classification 250 3.500.000 3.000.000 2.500.000 0,9%
c. Special classification 300 4.000.000 3.500.000 3.000.000 0,9% Storage building
a. Simple classification 150 2.500.000 2.000.000 1.500.000 0,8% b. Complex Classification 250 3.500.000 3.000.000 2.500.000 0,8% c. Special classification 400 4.000.000 3.500.000 3.000.000 0,8%
Commerce building
a. Simple classification 150 2.500.000 2.000.000 1.500.000 0,7% b. Complex Classification 250 3.500.000 3.000.000 2.500.000 0,7%
c. Special classification 400 4.000.000 3.500.000 3.000.000 0,7% Office Building
No Building Classification Building Area
Price Per M2
(Rp)
% IMB Rates
High Moderate Low
b. Complex Classification 250 3.500.000 3.000.000 2.500.000 0,6% c. Special classification 400 4.000.000 3.500.000 3.000.000 0,6%
Tourism and recreation building
a. Simple classification 150 2.500.000 2.000.000 1.500.000 0,5% b. Complex Classification 250 3.500.000 3.000.000 2.500.000 0,5% c. Special classification 400 4.000.000 3.500.000 3.000.000 0,5%
Transport building
a. Simple classification 150 2.500.000 2.000.000 1.500.000 0,4% b. Complex Classification 250 3.500.000 3.000.000 2.500.000 0,4% c. Special classification 400 4.000.000 3.500.000 3.000.000 0,4%
Education building
a. Simple classification 200 2.500.000 2.000.000 1.500.000 0,2% b. Complex Classification 300 3.500.000 3.000.000 2.500.000 0,2% c. Special classification 400 4.000.000 3.500.000 3.000.000 0,2%
Hospitality building
a. Simple classification 200 2.500.000 2.000.000 1.500.000 0,2% b. Complex Classification 300 3.500.000 3.000.000 2.500.000 0,2% c. Special classification 400 4.000.000 3.500.000 3.000.000 0,2%
Cultural building
a. Simple classification 200 2.500.000 2.000.000 1.500.000 0,2% b. Complex Classification 300 3.500.000 3.000.000 2.500.000 0,2% c. Special classification 400 4.000.000 3.500.000 3.000.000 0,2%
Sports building
a. Simple classification 200 2.500.000 2.000.000 1.500.000 0,2% b. Complex Classification 300 3.500.000 3.000.000 2.500.000 0,2% c. Special classification 400 4.000.000 3.500.000 3.000.000 0,2%
Religious building
a. Simple classification 200 2.500.000 2.000.000 1.500.000 0,2% b. Complex Classification 300 3.500.000 3.000.000 2.500.000 0,2% c. Special classification 400 4.000.000 3.500.000 3.000.000 0,2%
Referring to the estimated number of homes and buildings, and estimated price and size of building, it can be obtained that the IMB Retribution estimation of 31 Sub-districts in Bandung regency needs to be pursued by government officials at the district, sub-districts and village by usingmthree approaches: the achievement of retribution with low estimation, moderate and high. If the local government decides to use the model of
a moderate, then each sub-district has an obligation that must be achieved in accordance with the calculation of the above targets, so as to when government uses a low approach or approaches the highest.
low approach is Rp 428,179,260,695. See appendix of the IMB Estimated Retribution Target of Detached House Table per sub-district in 2014. Meanwhile, the result of IMB retribution of temporary house in Bandung district in 2014 achieves Rp 180, 042, 096,000 for the high approach, Rp155,805,660,000 for moderate approach and Rp 131,569,224,000 for the low approach. In detail, the estimation per sub-district can be seen in the Appendix Table of the Estimated Target of IMB retribution for temporary houses per sub-district in 2014.
The IMB estimated Retribution Target for the Flats reaches Rp 36,354,654,000 for the high approach, Rp 31,204,411,350 for moderate approach and Rp 26,054,168,700 for the low approach. Again, the IMB estimated Retribution Target for the multipurpose building is Rp 12,983,805,000 for the high approach, Rp 11,144,432,625 based on the moderate approach and Rp 9,305,060,250 for the low approach.
The result of the IMB estimated Retribution Target for the industrial buiding reaches Rp 142,821,855,000 for the high approach, amounting to Rp 120,749,386,500 for the moderate approach and Rp 98,676,918,000 for the low approach.
The IMB estimated Retribution Target for the trading building is Rp 35,800,245,527 for the high approach, Rp 29,365,471,769 for the moderate approach and Rp 22,930,698,011 for the low approach. The IMB estimated Retribution Target for the storage building is Rp 657,000,000 for the high approach, amounting to Rp 538,800,000 based on the moderate approach and Rp 420,600,000 for the low approach. The IMB estimated Retribution Target for the Hospitality building is Rp 202,125,00 for the high approach, amounting to Rp 173,250,000 based on the moderate approach and Rp 144,375,000 for the low approach.
The IMB estimated Retribution Target for Office Building achieves Rp 2,188,200,000 for the high approach, amounting to Rp 1,819,200,000 for the moderate approach and Rp 1,450,200,000 for the low approach. Meanwhile, the IMB estimated Retribution Target for Tourism and Recreation Building is Rp 56,250,000 for the high approach, amounting to Rp 45,000,000 based on the moderate approach and Rp 33,750,000 for the low approach. Moreover, the IMB estimated Retribution Target for the Transport Building is Rp 62,000,000 for the high approach, Rp 49,600,000 for the moderate approach and Rp 37,200,000 for the low approach.
The IMB estimated Retribution Target for the Education Building achieves Rp 1,763,300,000 for the high approach, amounting to Rp 1,451,800,000 for the moderate approach and Rp 1.140,300,000for the low approach. In addition, The IMB estimated Retribution Target for the Health Care Building is Rp 177.600,000 for the high approach, amounting to Rp 146,400,000 based on the moderate approach and Rp 115,200,000 for the low approach. Accordingly, the IMB estimated Retribution Target for the cultural building is Rp 31,000,000 for the high approach, amounting to Rp 24,800,000 based on the moderate approach and Rp 18,600,000 million for the low approach.
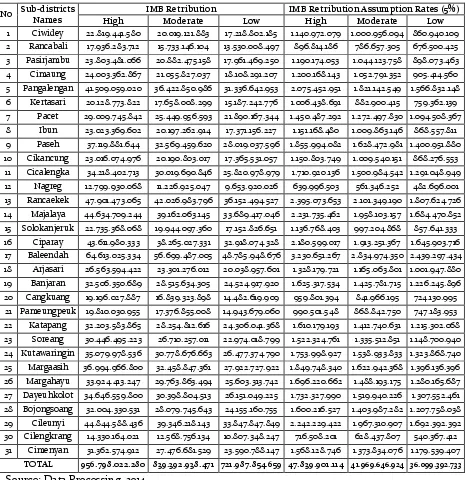
recapitulation of the sub-district IMB Retribution revenue targets is presented in the following Table 3.
Table 3. Summary of the Sub-district's Estimated IMB Retribution Target in Bandung
No Sub-districts
Names
IMB Retribution IMB Retribution Assumption Rates (5%)
High Moderate Low High Moderate Low
1 Ciwidey 22.819.441.580 20.019.121.883 17.218.802.185 1.140.972.079 1.000.956.094 860.940.109 2 Rancabali 17.936.283.712 15.733.146.104 13.530.008.497 896.814.186 786.657.305 676.500.425 3 Pasirjambu 23.803.481.066 20.882.475.158 17.961.469.250 1.190.174.053 1.044.123.758 898.073.463 4 Cimaung 24.003.362.867 21.055.827.037 18.108.291.207 1.200.168.143 1.052.791.352 905.414.560 5 Pangalengan 41.509.059.020 36.422.850.986 31.336.642.953 2.075.452.951 1.821.142.549 1.566.832.148 6 Kertasari 20.128.773.822 17.658.008.299 15.187.242.776 1.006.438.691 882.900.415 759.362.139 7 Pacet 29.009.745.842 25.449.956.593 21.890.167.344 1.450.487.292 1.272.497.830 1.094.508.367 8 Ibun 23.023.369.602 20.197.262.914 17.371.156.227 1.151.168.480 1.009.863.146 868.557.811 9 Paseh 37.119.881.644 32.569.459.620 28.019.037.596 1.855.994.082 1.628.472.981 1.400.951.880 10 Cikancung 23.016.074.976 20.190.803.017 17.365.531.057 1.150.803.749 1.009.540.151 868.276.553 11 Cicalengka 34.218.402.713 30.019.690.846 25.820.978.979 1.710.920.136 1.500.984.542 1.291.048.949 12 Nagreg 12.799.930.068 11.226.925.047 9.653.920.026 639.996.503 561.346.252 482.696.001 13 Rancaekek 47.901.473.065 42.026.983.796 36.152.494.527 2.395.073.653 2.101.349.190 1.807.624.726 14 Majalaya 44.634.709.244 39.162.063.145 33.689.417.046 2.231.735.462 1.958.103.157 1.684.470.852 15 Solokanjeruk 22.735.368.068 19.944.097.360 17.152.826.651 1.136.768.403 997.204.868 857.641.333 16 Ciparay 43.611.980.333 38.265.027.331 32.918.074.328 2.180.599.017 1.913.251.367 1.645.903.716 17 Baleendah 64.613.025.334 56.699.487.005 48.785.948.676 3.230.651.267 2.834.974.350 2.439.297.434 18 Arjasari 26.563.594.422 23.301.276.012 20.038.957.601 1.328.179.721 1.165.063.801 1.001.947.880 19 Banjaran 32.506.350.689 28.515.634.305 24.524.917.920 1.625.317.534 1.425.781.715 1.226.245.896 20 Cangkuang 19.196.027.887 16.839.323.898 14.482.619.909 959.801.394 841.966.195 724.130.995
21 Pameungpeuk 19.810.030.955 17.376.855.008 14.943.679.060 990.501.548 868.842.750 747.183.953 22 Katapang 32.203.583.865 28.254.812.616 24.306.041.368 1.610.179.193 1.412.740.631 1.215.302.068 23 Soreang 30.446.495.223 26.710.257.011 22.974.018.799 1.522.324.761 1.335.512.851 1.148.700.940 24 Kutawaringin 35.079.978.536 30.778.676.663 26.477.374.790 1.753.998.927 1.538.933.833 1.323.868.740 25 Margaasih 36.994.966.800 32.458.847.361 27.922.727.922 1.849.748.340 1.622.942.368 1.396.136.396 26 Margahayu 33.924.413.247 29.763.863.494 25.603.313.742 1.696.220.662 1.488.193.175 1.280.165.687 27 Dayeuhkolot 34.646.559.800 30.398.804.513 26.151.049.225 1.732.327.990 1.519.940.226 1.307.552.461 28 Bojongsoang 32.004.330.531 28.079.745.643 24.155.160.755 1.600.216.527 1.403.987.282 1.207.758.038 29 Cileunyi 44.844.588.436 39.346.218.143 33.847.847.849 2.242.229.422 1.967.310.907 1.692.392.392 30 Cilengkrang 14.330.164.021 12.568.756.134 10.807.348.247 716.508.201 628.437.807 540.367.412 31 Cimenyan 31.362.574.912 27.476.681.529 23.590.788.147 1.568.128.746 1.373.834.076 1.179.539.407
TOTAL 956.798.022.280 839.392.938.471 721.987.854.659 47.839.901.114 41.969.646.924 36.099.392.733
Estimated Target recapitulation of Sub-district IMB Retribution in Bandung , based the high approach, is Rp 956,798,022,280, the moderate approach is as much as Rp 839,392,938,471, and the low approach is Rp 721,987,854,659. If the assumption of IMB Retribution rates is by 5%, then the recapitulation of Estimated Target of Sub-district IMB Retribution in Bandung, according to the high approach is Rp 47,839,901,114, moderate approach is Rp 41,969,646,924 and low approach is Rp Building Permits in Bandung regency is pretty good based on the high, moderate or low approach. Thus, appropriate strategies are needed to increase the acceptance of the Building Permits in Bandung regency. Therefore, the writer suggests several tips to achieve the estimated levy, namely; 1) In the following years, Bandung regency government is suggested to set the revenue targets of Building Permit Levy in the APBD using the number on potential calculation and leave the methods of incremental whose results are lower than they should be achieved, 2) Set up of the good quality of human resources and superior in technical and theoretical things to make the process of socialization, voting and supervision, as well as the management of IMB retribution run
well, and 3) supervise actively and regularly to prevent the possibility of deviation from the plans, instructions, suggestions and any other things that have been set. In addition, the extra supervision is also needed so that any buildings owned by the community is legal based on IMB. As a result, it is expected that the community awareness on registering their IMB will much more improve.
REFERENCES
Act No. 33 of 2004 on Financial Balance Between Central and Local Government.
Agustino,E, Kinerja Keuangan dan Strategi
Pembangunan Kota di Era Otonomi Daerah:
Journal : CURES Working Paper No 05/01 January 2005, Fakultas Ekonomi Universitas Airlangga, Surabaya .
Ahmad, Jamaluddin, 1990, Hubungan Keuangan Antara Pusat dan Daerah, Studi Kasus DI Aceh, Jawa timur dan DKI Jakarta, Desertasi Doktor UGM, Yogyakarta (Tidak Dipublikasikan).
Arsyad, Nurjaman, 2004, Hubungan Fiskal Antar Pemerintahan di Indonesia, Peranan dan Masalahnya, Journal : Analisis CSIS, Jakarta. Badan Penelitian dan Pengembangan Depdagri dan
Fisipol UGM,1991, Pengukuran Kemampuan Keuangan Daerah Tingkat II dalam Rangka Otonomi Daerah yang Nyata dan Bertanggung Jawab, Jakarta.
Bawazier, Fuad, 1996. “Pungutan Pada Dunia Usaha”.
Seri Kajian Fiskal dan Moneter, No.19, hal. 5-14.
Binder, Briant, 1984. “A Possible Concept for
Equalization, Grant for Indonesia Regional
Development”. Ekonomi Keuangan Indonesia, Vol. 12, hal. 13-25.
Boadway dan Wildasin, 1984, Public Sector Economic, Second, Litle Brown, Boston, Torronto.
Booth, Anne, 2001. “Pembangunan: Keberhasilan dan Kekurangan”. Dalam Donald K Emmerson, (Ed.),
2001. Indonesia Beyond Soeharto: Negara,
Ekonomi, Masyarakat, Transisi. Jakarta:
Gramedia Pustaka Utama.
Davey, Kenneth,1988, Pembiayaan Pemerintah Daerah, Praktek dan Relevansinya bagi Dunia Ketiga, terjemahan Amanullah, UI Press, Jakarta. David, FR, 1997. Strategic Management 6th Edt. New
Deny, Junanto, (2002) Penerapan Desentralisasi Fiskal Untuk Meningkatkan Sektor Pariwisata, Journal Bunga Rampai LAN, Jakarta.
Devas Nick, Brian Blinder Anne Booth, Kenneth Davey, Roy Kelly, Penterjemah Masri Maris, 1989, Keuangan Pemerintah Daerah di Indonesia, UI Press, Jakarta.
Halim, Abdul, 2004. Manajemen Keuangan Daerah. Yogyakarta: UPP AMP YKPN.
Ichsan, dkk,1997, Administrasi Keuangan Daerah :
Pengelolaan dan Penyusunan Anggaran
Pendapatan dan Belanja Daerah (APBD), cetakan pertama, PT Danar Wijaya, Brawijaya University Press, Malang.
Instruksi Presiden RI Nomor 7 Tahun 1999 Tentang Akuntabilitas Kinerja Instansi Pemerintah.
Ismail, Tjip, 2003. “Peran Pendapatan Asli Daerah
Sebagai Pendamping Dana Perimbangan Dalam Pembiayaan Pembangunan Guna Mewujudkan
Kemandirian Daerah”. Bunga Rampai Desentralisasi Fiskal. Jakarta: Departemen Keuangan.
Kristiadi,J.B.,1988, Masalah Sekitar Pendapatan Daerah, Prisma No 12, LP3ES, Jakarta.
Lains, Alfian, 1985. “Pendapatan Daerah Dalam Ekonomi Orde Baru”. Prisma, No. 4, 40.
Lewis, Blane D, 2003. Some Empirical Evidence On New Regional Taxes And Charges In Indonesia. Laporan Penelitian, Research Triangle Institute, Nort Carolina, USA.
Mamesah, 1997 Sistem Administrasi Keuangan Daerah, PT Gramedia Pustaka Utama, Jakarta.
Mardiasmo,2002, Otonomi dan Manajemen Keuangan Daerah, Penerbit : Andi Offset, Yogyakarta. Meliala, Tulis S, 1991. Perpajakan Dalam Teori dan
Praktek. Bandung: Yama Widya Dharma.
Musgrave Richard A and Musgrave Peggy B,1989, Public Finance Theory and Practice, Journal : Analisis CSIS, Jakarta.
Pasalbessy,Victor,2005. Analisa Sumber-sumber PAD yang Potensial Dalam Meningkatkan Pendapatan Asli Daerah Kota Jayapura, Tesis.Pascasarjana Unibraw, Malang.Tidak dipublikasikan. Peraturan Pemerintah Nomor 65 Tahun 2001 Tentang
Pajak Daerah Peraturan Pemerintah Nomor 66 Tahun 2000 Tentang Retribusi Daerah. Peraturan Pemerintah Nomor 25 Tahun 2000
Tentang Kewenangan Pemerintah dan
Kewenangan Provinsi sebagai Daerah Otonomi. Peraturan Pemerintah Nomor 19 Tahun 2007 Tentang Pajak Daerah.
Peraturan Daerah Kabupaten Bandung Nomor 16 Tahun 2009 Tentang Tata Bangunan.
Peraturan Daerah Kabupaten Bandung Nomor 13 Tahun 2012 Tentang Retribusi Perizinan Tertentu. Prihanto Eko Y, 2001, Laporan Penelitian, Pendapatan
Asli Daerah Pasca UU No 18 Tahun 1997, Fakultas Ekonomi Universitas Merdeka, Malang Radianto, Elia,1997, Otonomi Keuangan Daerah Tangkilisan, Hessel Nogi S., 2005. Manajemen Tingkat II Suatu Studi di Maluku, Journal : Prisma, VOL.IX, No.3.24-37.
Putri, Phany Ineke. 2013. Analisis Faktor-Faktor yang Mempengaruhi Penerimaan Pajak. JEJAK Journal of Economics and Policy. Vol 6 No 2 (2013). Septiawan,Dwi, 2004. Kemampuan Keuangan Daerah
Ditinjau Dari Kontribusi Pendapatan Asli Daerah
Pemerintah Kabupaten Pasuruan, Tesis,
Pascasarjana Unibraw, Malang.Tidak
dipublikasikan.
Shackelford, Douglas A., Shaviro, Daniel N., and Slemrod, Joel. 2010. Taxation And The Financial Sector. National Tax Journal, December 2010, 63 (4, Part 1), 781–806.
Soeratno dan Suparmoko, 2002, Urgensi Pajak Daerah dan Penghasilan Daerah dalam Struktur Pendapatan Asli Daerah Propinsi Daerah Istimewa Yogyakarta, Jurnal Akuntansi dan Manajemen Edisi I, Agustus 2002, Hal 13-21 Sutrisno,PH, 1982, Dasar-dasar Ilmu Keuangan Negara,
Cetakan III, BPFE UGM, Yogyakarta.
Syahroni, 2002. Pengertian Dasar dan Generik Tentang
Perencanaan Pembangunan Daerah. Jakarta:
German Technical Cooperation (GTZ).
Swasono, Sri Edi, 2004. “Pembangunan Menggusur Orang Miskin Bukan Menggusur Kemiskinan”.
Mimeo, makalah pada seminar bulanan ke 20 Pustep-UGM.
Taylor, Madeline. 2013. Is it a levy, or is it a tax, or both? Revenue Law Journal. Vol 22 Issues 1.
Todaro, Michael P., 1991. Economic Development in The Third World, 4th edition. New York dan London: Longman Publishing.
Yuwono,Sony, 2008, Memahami APBD dan
Permasalahannya (Panduan Pengelolaan
Keuangan Daerah), Bayumedia Publishing, Jawa
Timur.