NITROGEN DYNAMICS IN THE RUMEN AND ABOMASUM OF SHEEP
DETERMINED WITH
15N-LABELLED AMMONIA OR
15N-LABELLED DUCKWEED
Damry1 and J.V. Nolan2
1Department of Animal Science, Tadulako University, Palu 94118
2School of Environmental and Rural Science, UNE, Armidale, NSW 2351, Australia E-mail: [email protected]
Received February 2, 2009; Accepted February 28, 2009
ABSTRACT
An experiment was carried out to investigate the dynamics of nitrogen (N) in the rumen and abomasum of rumen and abomasum-cannulated sheep using 15N dilution techniques. The 15N tracer was administered
into the rumen as 15N-ammonia or 15N-labelled duckweed and the transfer of the 15N label to various N
pools was followed. Flow of digesta from the rumen into the abomasum was ascertained by double marker technique with cobalt and acid insoluble ash as liquid digesta and particle digesta marker, respectively. Results showed that the average of rumen water volume was 4.5 l ± SEM 0.57 and the mean water flow through the abomasum (8.6 ± 0.45 l/d) was higher than outflow from the rumen (7.4 ± 0.55 l/d). Nitrogen intake tended to be higher, but total-N passing the abomasum tended to be lower when the sheep were infused by 15N-ammonia than when they were ingesting 15N-duckweed. The ammonia concentration in
abomasal digesta was about 93 mg N/kg and non ammonia N (NAN) was about 1.58 g N/kg. The rates of flow of total-N as ammonia-N and as NAN did not differ (P>0.05) between animals or diets, with means (± SEM) of 57.7 ± 0.96 and 964 ± 2.13 mmol/d (or 0.81 and 13.5 g N/d), respectively. About 34-59% of the dietary N was removed from the rumen as ammonia (absorbed and in digesta). The enrichments of rumen ammonia N appeared to have reached plateau values after about 10 h of 15N-ammonia infusion. The percentage
of bacterial-N derived from ammonia-N (from the period of 15N-ammonia infusion) was 53.63 % (ratio of
plateau enrichments) and thus 37.47% of bacterial-N was derived from NAN sources in the rumen. The total 15N flow through the abomasum was higher (P<0.001) when 5N duckweed was given rather than 15
N-ammonia (2.40 0.02 versus 1.29 0.02 mmol/d). The 15N in NAN flowing to the abomasum (mmol/d) was
also significantly higher (P<0.001) when 15N-duckweed was given rather than 15N ammonia, with means of
2.31 0.02 and 1.16 0.00, respectively. The flow of 15N in ammonia, on the other hand, was lower
(P<0.01) when sheep ingested 15N-duckweed than when they were infused with 15N-ammonia (0.09 0.00 v. 0.13 0.09 mmol/d).
Keywords : Nitrogen Dynamics, Rumen, Abomasum, 15N-Labelled Duckweed, Ammonia-N, Non Ammonia-N, Bacterial-N
INTRODUCTION
Quantitative models of nitrogen (N) transaction in the rumen (e.g Nolan, 1975; Oldick et al., 2000) have been made using data obtained from in vivo experiments carried out using 15N dilution techniques.
In such experiments, 15N-labelled ammonia or urea
is introduced into the rumen and the appearance of the 15N label in secondary N pools such as
microbial-N can be determined. The 15N isotope dilution
technique has proved to be a powerful means of
understanding the dynamics of N in the rumen. For example, the finding that more than 50 % of microbial-N was derived directly from nitrogenous sources more complex than ammonia (i.e. non ammonia-N, [NAN]) when sheep were given lucerne diets was obtained from such experiments (Nolan and Leng, 1972). However, the utilisation of plant NAN materials by microorganisms was determined indirectly after
15N ammonia utilisation by microbes had been
Our current understanding of plant N behaviour and N transactions among various N pools in the rumen may be further enhanced by the use of 15
N-labelled feed as the source of the tracer. However,
there have not been many in vivo studies done using
this technique, probably because of economical consideration and time that is needed to produce the
15N-labelled plant at sufficient quantities as required.
Ideally, the 15N should be incorporated by the plant
efficiently during the labelling process and significant quantities of 15N-labelled materials can be obtained
in short time.
In the rumen, the 15N from the labelled plant will
appear in rumen N pools at rates depending on the original distribution of the 15N in plant N and on the
rates of plant degradation. Since ammonia is the end product of degradation of N-containing substances, the appearance of 15N label in this pool can then be
used to estimate the degradation of plant N materials (Chapman and Norton, 1984). Under steady state conditions, all the 15N present in the plant should enter
the ammonia pool if the plant N materials is completely degradable in the rumen. In another words, if the amount of 15N entering the ammonia pool is less than
the 15N amount available from the plant, this means
that some of the plant N materials is never degraded to ammonia.
For such studies, it is necessary to perform two experiments with similar conditions in which 15
N-ammonia is used in one experiment and 15N-feed in
the other. Some data (such as irreversible loss of ammonia) are obtained from the 15N-ammonia
experiment and assumed to be applicable to the experiment with 15N-labelled feed as the source of
the tracer. If rumen bacterial sample is isolated in these experiments, its enrichment and the ratio of this enrichment to that of rumen ammonia can be compared. This ratio should be similar in both experiments if the bacterial N is only synthesised from ammonia. The bacterial sample isolated should not be contaminated with 15N from non-bacterial
substances and inspection on this matter should be performed.
This experiment was carried out to investigate the dynamics of N in the rumen and abomasum of sheep using 15N dilution techniques. However, 15N was
administered into the rumen as 15N-labelled
duckweed, a rapidly growing aquatic plant, as well
as 15N-labelled ammonia. The transfer of the 15N label
to various N pools was then followed. In this way it was possible to determine, by direct means, the fate of plant-N in the rumen and abomasum including the extent of its assimilation in different forms for synthesis of bacterial protein.
MATERIALS AND METHODS
Experimental Animals and Diets
Duckweed (Spirodella punctata) was labelled with 15N by growing it on a synthetic medium (Damry,
2006). Two ruminally and abomasally cannulated Merino x Border Leicester crossbred sheep (designated as Sheep C and D) were used as experimental animals. They were kept in individual metabolism crates in a temperature-controlled, continuously lit room in Animal House Complex at the University of New England, Australia. The animals were accustomed to the environment and to a daily experimental ration of 400 g oaten chaff (91.2 % DM, 1.14 g N/100 g DM) and 300 g lucerne chaff (89.4 % DM, 3.40 g N/100 g DM). The feed was provided in approximately equal portions at hourly intervals by means of an automatic belt feeder. The sheep had a continuous access to drinking water.
Experimental Procedures
The experiment involved a study of digesta flow using the dual marker technique of Faichney (1975) in which cobalt as cobalt-ethylene diamine tetra acetic acid (Co-EDTA) complex was used as a liquid digesta marker and acid insoluble ash (AIA) as particle digesta marker. The Co-EDTA complex was prepared according to the method of Uden et al. (1980).
The experiment was carried out in two periods using a cross-over design. During the two experimental periods, one week apart, the sheep received either an intra-ruminal continuous infusion of 15N-ammonia
or continuous feeding of 15N duckweed for 72 h. For
the sheep receiving 1 5N-ammonia, a solution
containing 1.48 mg N/ml (2.96 mol 15N/100 mol
total-N above natural abundance) and 116.5 mg Co/ml, was continuously infused into the rumen at a mean rate of 0.82 g/min. For the other sheep, 16 g 15
diet and delivered hourly by the automatic, overhead belt feeders. To ensure an equal and steady delivery of the 15N tracer, the 15N-duckweed was divided into
4 portions of 4 g each, and each 4 g was distributed evenly over the feed allocated for each 8-h period on the delivery belt. A Co solution (115.9 mg Co/ml) was also continuously infused into the rumen while the sheep was being offered the 15N-duckweed.
During the 15N-ammonia infusion, rumen fluid
samples were collected, processed and analysed for rumen ammonia-N, NAN and bacteria l-N. Abomasum digesta samples were also collected and to avoid effects on digesta flow due to sampling and possible disturbance of the animals, only five samples of abomasum digesta were collected.
In Period 2, the routes of administration of 15N were
reversed. After the period of 15N administration was
terminated, five more samples of rumen contents and abomasum digesta were collected.
Sample Preparation
The rumen fluid samples were immediately centrifuged (20,000 x g, 15 min, 4°C) to obtain a supernate which was acidified with 0.25 ml 18 M H2SO4 and stored at -18°C until analysed. Bacteria were isolated from the residue by twice resuspending the residue in 20 ml physiological saline (9 g NaCl/l), recentrifuging and removing the top (bacteria-rich) layers of residue. The final bacterial isolate was suspended in about 3 ml saline solution and stored at -18°C. The abomasum digesta sample was separated into liquid-enriched and particle-enriched fractions by allowing the original digesta (as collected) to stand at room temperature. The more liquid fraction was poured into different container leaving the particle fraction in the original container.
Laboratory Analysis
Ammonia-N (NH3-N) was removed from the rumen fluid supernate (3 ml) and liquid and particle-enriched abomasum digesta (2 gr) by steam distillation after the rumen fluid was made alkaline with saturated Na-tetraborate (4 ml). The NH3-N was collected into 3 ml 0.025 M H2SO4 and titrated to pH 5 with 0.025 M NaOH. It was then re-acidified to pH 3 and dried in an analytical oven at 95°C. The non-ammonia-N (NAN) left was subjected to microkjehdahl digestion using concentrated H2SO4 (3.5 ml) and a low Se
catalyst tablet. The bacterial isolate (0.5 ml) was similarly digested and the digests were distilled after being made alkaline with 40 % NaOH and then dried as for NH3-N. Ethanol was distilled between all samples to avoid 15N cross-contamination. To prepare
samples for 15N analysis, the dried (15NH4)2SO4
was re-dissolved with double distilled H2O and a
solution containing 80-100 µg N was transferred into
an 8x5 mm tin capsule (Elemental Microanalysis Ltd.). The solution was then re-dried in a vacuum desiccator and the capsule was closed and folded. The 15N enrichment was analysed using a mass
spectrometer (Tracermass; Europa Scientific) linked to an N analyser (Carlo Erber).
Cobalt-EDTA infusion solution and in liquid-enriched and particle-liquid-enriched fractions of abomasum digesta were subjected to Co analysis following a perchloric acid (HClO4) / hydrogen peroxide (H2O2) digestion. The Co concentration was analysed on an Inductively Coupled Plasma Optical Emission Spectroscopy (ICP-OES; Varian, Model MPX). The AIA concentration in ground (1 mm sieve) feed samples and abomasum digesta was determined according to a method described by Choct and Annison (1990) and Vogtmann et al. (1975).
Analysis and Calculation
All enrichment versus time curves were normalised to represent a rate of administration of 15N into the
rumen of 2.88 mmol/d above natural abundance (either as 15N-ammonia or 15N-duckweed). The resulting
data for ammonia and NAN in rumen fluid supernate and abomasum digesta as well as bacterial N were fitted by curves with two exponential functions using GraphPad Prism version 3.02 for Windows (Motulsky, 1999).
The difference between the total 15N administered
and the total 15N flowing to the abomasum was a
measure of the net 15N absorption from the rumen. It
was assumed that this 15N was removed by diffusion
of ammonia through the rumen wall, and thus ammonia-N absorption rate (mmol/d) was determined by dividing net 15N absorption (mol 15N/d) by
ammonia-N enrichment (mol 15N/mol total N). The
total 15N flow through the abomasum was calculated
as the sum of 15N in the outflowing ammonia-N and
NAN (the latter being bacterial and non-bacterial [dietary and endogenous] 15N). The bacterial-15N
flow was calculated from the rumen bacterial-N enrichment and the flow of the bacterial-N fraction in the abomasum NAN. The latter was calculated from the enrichment ratio, abomasum NAN : rumen bacterial-N, when the animals were infused with 15
N-ammonia. The 15N found to be flowing out in the
non-bacterial NAN fraction when the 15N-duckweed
was being ingested was considered to represent the rate at which duckweed was escaping undegraded from the rumen: the latter rate divided by the rate of
15N ingestion gave the proportion of duckweed-N that
was escaping degradation in the rumen. (For this calculation, it was assumed that 15N of endogenous
origin in the non-bacterial NAN entering the abomasum was negligible). All data were analysed with an analysis of variance on a personal computer using S-Plus 2000.
RESULTS AND DISCUSSION
The DM contents (g/kg air-dry) of the oaten chaff and the lucerne chaff were 912 and 894 g/kg,
respectively, while the corresponding N contents (g/ kg DM) were 11.4 and 34.0. The DM intake (g/d) averaged 641 ( SEM 4.57) g DM/d during the periods when 15N was administered. The mean DM
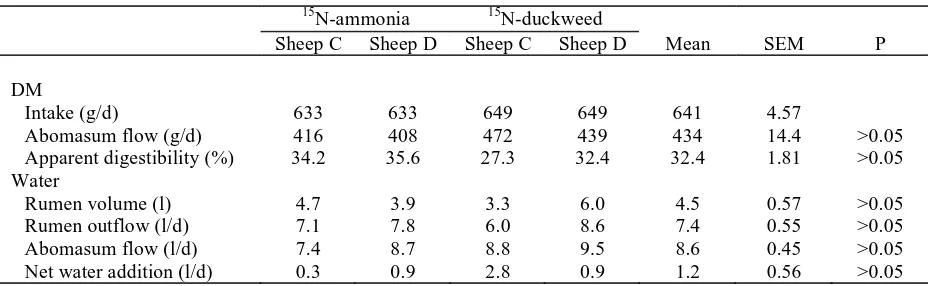
content of the ‘true’ abomasum digesta was about 50 g/kg digesta. Between 64 and 73 % of the dietary DM intake was apparently recovered in the digesta flowing through the abomasum (Table 1), but the mean true feed DM digestibility in the forestomachs was calculated to be 45-71 %. (after allowance for the contributions of bacterial and endogenous DM to the abomasal DM, made by assuming the concentration of N in microbial materials was 0.8 g/kg DM and the endogenous N flow was 2 g N/d in materials containing 16 g N/kg DM). Rumen water volume averaged 4.5 l ± SEM 0.57 and the mean water flow through the abomasum (8.6 ± 0.45 l/d) was higher than outflow from the rumen (7.4 ± 0.55 l/d), indicating there was a net post-ruminal addition of water to the digesta (Table 1)
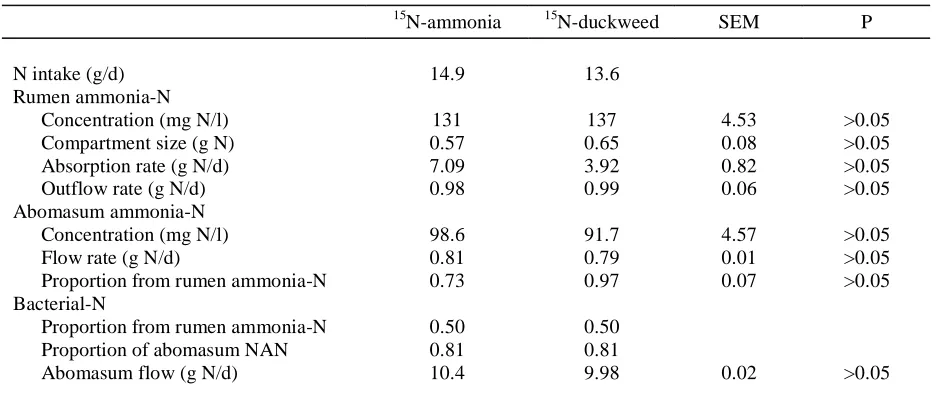
Nitrogen intake tended to be higher, but total-N passing the abomasum tended to be lower when the sheep were infused with 15N-ammonia than when
they were ingesting 15N-duckweed (Table 2). The
ammonia concentration in abomasal digesta was about 93 mg N/kg and of NAN was about 1.58 g N/kg. The rates of flow of total-N as ammonia-N and as NAN did not differ (P>0.05) between animals or diets, with means (± SEM) of 57.7 ± 0.96 and 964 ± 2.13 mmol/d (or 0.81 and 13.5 g N/d), respectively. About 34-59% of the dietary N was removed from the rumen as ammonia (absorbed and in digesta).
Table 1. Intake of DM And Flows Of DM And Water Out of The Rumen and Through The Abomasum of Sheep Given A Diet of Oaten Chaff (400 g/d as fed) and Lucerne Chaff (300 g/d as fed)
15N-ammonia 15N-duckweed
Sheep C Sheep D Sheep C Sheep D Mean SEM P
DM
Intake (g/d) 633 633 649 649 641 4.57
Abomasum flow (g/d) 416 408 472 439 434 14.4 >0.05
Apparent digestibility (%) 34.2 35.6 27.3 32.4 32.4 1.81 >0.05
Water
Rumen volume (l) 4.7 3.9 3.3 6.0 4.5 0.57 >0.05
Rumen outflow (l/d) 7.1 7.8 6.0 8.6 7.4 0.55 >0.05
Abomasum flow (l/d) 7.4 8.7 8.8 9.5 8.6 0.45 >0.05
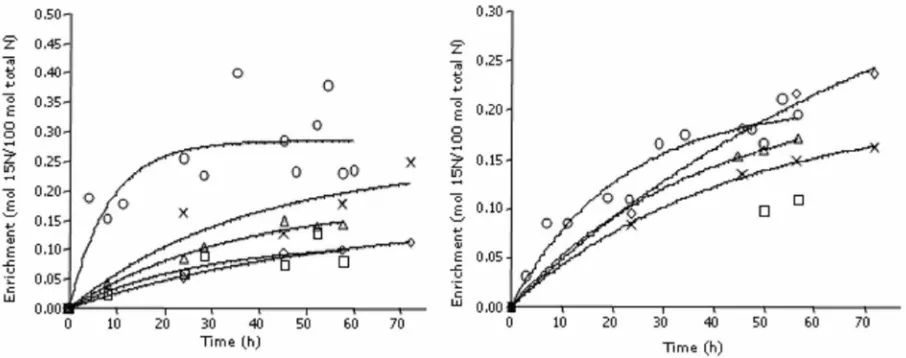
Enrichments versus time in rumen fluid ammonia-N, NAN and bacterial-ammonia-N, and ammonia-N and NAN in abomasal digesta are presented for Sheep C and D in Figures 1 and 2, respectively. The enrichments of rumen ammonia N appeared to have reached plateau values after about 10 h of 15N-ammonia
infusion, although considerable variation in the
enrichments of ammonia was a pparent. The percentage of bacterial-N derived from ammonia-N (from the period of 15N-ammonia infusion) was 53
63 % (ratio of plateau enrichments) and thus 37 47% of bacterial-N was derived from NAN sources in the rumen.
Figure 1 Enrichments (y axis; mol 15N/100 mol total ) versus time (x axis; h) in rumen fluid ammonia (○), rumen fluid NAN (□) rumen bacterial-N (∆),abomasum ammonia (x) and abomasum NAN (◊) during a 72 h administration of 2 µmol 15N/min as 15N-ammonia (top) or 15N-duckweed (bottom) for Sheep C
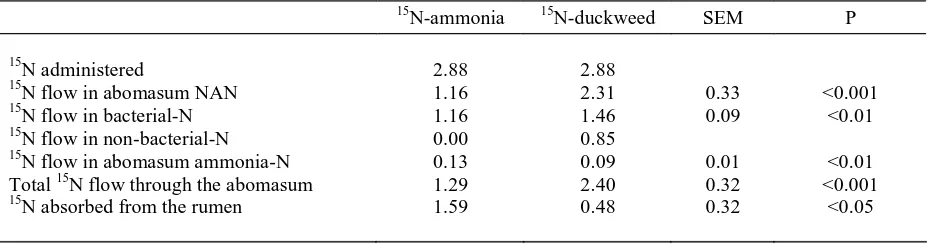
The total 15N flow through the abomasum was
higher (P<0.001) when 5N duckweed was given
rather than 15N-ammonia (2.40 0.02 versus 1.29
0.02 mmol/d). The 15N in NAN flowing to the
abomasum (mmol/d) was also significantly higher (P<0.001) when 15N-duckweed was given rather than 15N ammonia, with means of 2.31 0.02 and 1.16
0.00, respectively. The flow of 15N in ammonia, on
the other hand, was lower (P<0.01) when sheep ingested 15N-duckweed than when they were infused
with 15N-ammonia (0.09 0.00 v. 0.13 0.09 mmol/
d).
Mean DM intake and DM flow through the abomasum was 641 and 434 g/d, respectively. Thus, about 32.4 % of the ingested DM was apparently digested in the rumen. However, further calculations suggested that the true digestibility of DM in the rumen was about 71 %, a coefficient that is similar to values obtained in comparable published studies (SCA, 1990). The rumen water outflow rate, calculated from the rate of decline in Co concentration after the infusion was terminated, was 7.4 l/d. There was a slightly higher flow rate of water (8.6 l/d) through the abomasum suggesting a net post-ruminal water addition, probably as gastric secretions, of about 1.2 l/d: the actual water input may have been higher than the net estimate if water is also absorbed in this part of the gut of the sheep (e.g. in the omasum). The total N flowing through the abomasum was 15.2 g/d which when compared with a mean N intake of 14.3 g N/d indicated that there was a net addition (i.e. the excess of endogenous input of N over that absorbed as ammonia or other N) between the mouth and abomasum of about 0.9 g N/d. Harrop (1974) estimated that the daily total N secreted in gastric juice was 0.51–2.86 g N, but this amount would not explain the 0.9 g N/d net gain if, as the current results suggest, there was also an absorption of 5-8 g N/d.
About 95 % of the total N flowing through the abomasum in this experiment was NAN, probably consisting mainly of dietary ‘escape’ protein and microbial protein formed in the rumen, but there would also have been a small fraction of endogenous N. Because there was a net loss of ammonia from digesta leaving the rumen and passing through the abomasum (about 0.2 g N/d), the endogenous N added to the abomasum may have been mostly in the form of NAN, e.g. urea and pepsinogen.
Results obtained in when 15N-ammonia was
infused into the rumen indicated that the rumen ammonia enrichment had reached a plateau value 10 20 h after the start of infusion. There was a considerable between-sample variation, however, in the rumen ammonia enrichments. The most likely reason for this variation is the high fractional rate of turnover of ammonia: this is related to the small compartment size and the high rate of flux of ammonia through the compartment. To some extent, the problem could also have been due to non-ideal mixing of the tracer with unlabelled N, but precautions were taken to minimise this effect, e.g. the sampling probe was positioned at a distance from the infusion line to prevent the samples taken being contaminated by the
15N in the infusion solution. Variation due to the
inaccuracies in the mass spectrometer analyses for determining enrichment can be discounted because the variation was apparent only in the rumen ammonia results (i.e. not in other samples) and, in addition, checks showed that the 15N analyses were both
precise and repeatable.
There was considerable variation between animals in the estimates of the proportions of bacterial-N synthesised from ammonia-N when 15N-ammonia
was infused into the rumen. This was probably mainly due to uncertainties about the plateau ammonia enrichments. Additional variation may have been due to different bacterial populations present in the rumen which can occur even when animals ingest the same diet (Armstead and Ling, 1993) or to possible errors associated with predicting the true plateau enrichment of rumen ammonia-N. The proportion of bacterial-N derived from ammonia-N was also lower when 15
N-ammonia was infused than when it was injected into the rumen (Damry and Nolan, 2002). The recycling of the absorbed 15N-ammonia and 15N-bacteria during
the longer period of infusion may have been responsible for lower estimates of the ammonia-derived bacterial-N for the tracer infusion experiments as compared to the tracer injection experiment.
When the sheep were ingesting 15N-duckweed,
the enrichment of rumen ammonia-N also increased exponentially with time, but the rate of increase in enrichment (i.e. from the tangent to the fitted curve) was slower, and the absolute values were much lower than those obtained when the same quantity of 15N
the 15N ingested in duckweed was not quantitatively
degraded all the way to ammonia-N. The 15N must
have been utilised for microbial protein synthesis in NAN forms, or it escaped either undegraded or partially degraded to the abomasum. The ammonia-N enrichment in the sheep ingesting duckweed would have been due, in part, to the direct contribution of ammonia present in the ingested duckweed at the time of its ingestion (about 8 % of total N). However, the slow rate of increase in enrichment also suggests there was a delayed contribution, probably via intra-ruminal (and to a lesser extent extra-intra-ruminal) recycling of labelled microbial-N.
The 15N administered that was not recovered in
the abomasum must have been 15N absorbed from
the rumen. The non-recovered fr action was significantly higher (P<0.001) when 15N-ammonia
was infused than when 15N-duckweed was ingested
because ammonia absorption across the rumen wall is an important route of loss of ammonia that is not assimilated by bacteria. Also, because ingested duckweed N was only partially degraded in the rumen, the undegraded portion escaped to the intestines. Assuming that all the non-recovered 15N (mol 15N/d)
was removed from the rumen as absorbed ammonia, the ammonia absorption rate (mol N/d) could be calculated from knowledge of rumen ammonia-N enrichment at plateau (mol 15N/mol total N). The
estimate of ammonia absorption when 15N ammonia
was administered (0.51 mol/d, 7.1 g N/d) tended to be higher than that obtained when 15N-duckweed was
ingested (4.0 g N/d), but the former value may be more nearly correct because of the earlier and more complete attainment of plateau enrichment in rumen fluid ammonia-N during the 15N-ammonia infusion.
The flow rate of ammonia-N out of the rumen was about 0.2 g/d higher than the rate of ammonia-N flow through the abomasum (Table 2), indicating there was a net loss of ammonia from digesta passing through the omasum or abomasum, although absorption of ammonia from the abomasum is unlikely (Williams et al., 1968). At the same time, however, the ammonia-N enrichment in the abomasum was lower than the rumen ammonia-N enrichment indicating that some unlabelled ammonia-N was added to digesta in one or both of these organs. The proportion of the abomasal ammonia-N derived from the rumen was about 85% implying that about 15% of the ammonia flowing through the abomasum was added post-ruminally, probably from the degradation of blood urea entering the abomasum in gastric juice secretion (Harrop, 1974).
The proportion of bacterial-N in the abomasum NAN was estimated from the ratio of enrichments in abomasum NAN and bacterial-N isolated from the rumen fluid. This ratio was only applicable when
Table 1.Intake of N and Kinetics of Various N-Containing Fractions in The Rumen and Abomasum of Sheep Given a Diet of Oaten Chaff (400 g/d) and Lucerne Chaff (300 g/d)
and Either 15N-ammonia or 15N-labelled Duckweed
15N-ammonia 15N-duckweed SEM P
N intake (g/d) 14.9 13.6
Rumen ammonia-N
Concentration (mg N/l) 131 137 4.53 >0.05
Compartment size (g N) 0.57 0.65 0.08 >0.05
Absorption rate (g N/d) 7.09 3.92 0.82 >0.05
Outflow rate (g N/d) 0.98 0.99 0.06 >0.05
Abomasum ammonia-N
Concentration (mg N/l) 98.6 91.7 4.57 >0.05
Flow rate (g N/d) 0.81 0.79 0.01 >0.05
Proportion from rumen ammonia-N 0.73 0.97 0.07 >0.05
Bacterial-N
Proportion from rumen ammonia-N 0.50 0.50
Proportion of abomasum NAN 0.81 0.81
Abomasum flow (g N/d) 10.4 9.98 0.02 >0.05
15N-ammonia was infused into the rumen (not when
the tracer was provided by the 15N-duckweed as, in
this case, labelled NAN in the abomasum could be non-bacterial in origin). The ratio, which was about
81 %, was assumed to apply throughout the
experiment and was also used in calculations for the duckweed-ingesting animals. The ratio was higher than that obtained for sheep with similar intakes of DM by Siddons et al. (1982), and the estimates of flow of bacterial-N through the abomasum (10.5 g N/d), and the efficiency of bacterial-N synthesis (39 45 g N/kg DM apparently digested in the rumen, or 22 45 g N/kg DM truly digested in the rumen) also seemed to lie at the high end of the range of published values (SCA, 1990).
The proportion of duckweed-N that escaped rumen fermentation was estimated from the data describing the 15N balance across the rumen (Table
3). The 15N flowing through the abomasum would
have been present as both ammonia-N and NAN, the latter consisting of microbial-N and non-microbial-N. The non-microbial-N probably also contained relatively small amounts of labelled endogenous NAN. From the knowledge of bacterial-N enrichment and the proportion of bacterial-N in the abomasal NAN, the amount of 15N in bacterial-N flowing
through the abomasum was calculated. Subtracting the result from the total 15N flow gave an estimate of
the non-bacterial 15N-labelled NAN flow (0.85 mmol/
d). If the non-bacterial-N flow through the abomasum is assumed to be solely from labelled escape duckweed, then about 30 % of the duckweed N ingested escaped digestion in the rumen which also implies that about 70 % of the dietary duckweed-N was degraded in the rumen. About 25 % of the 15N
in the ruminally degraded component of the duckweed was absorbed through the rumen wall, probably as ammonia as mentioned above. The majority of the
15N in duckweed digested in the rumen, however, was
converted to, and recovered as bacterial-N flowing through the abomasum: this bacterial-N would then be available for intestinal absorption and utilisation by the host.
It may be concluded that the use of 15N- labelled
plants such as duckweed, in combination to that of
15N-labelled ammonia, in 15N tracer studies will
enhance further our undertandings of N behaviours and transactions in ruminant nutrition.
REFERENCES
Armstead, I. P. and J. R. Ling, 1993. Variations in the uptake and metabolism of peptides and amino acids by mixed ruminal bacteria in vitro. Appl. Env. Mic. 59: 3360-3366.
Chapman, P. G. and B. W. Norton, 1984. The estimation of feed protein degradability in the rumen using nylon bag, microbial labelling (35S)
and plant labelling (15N) techniques. Anim. Prod.
Aust. 15: 286-289.
Choct, M. and G. Annison, 1990. Anti-nutritive activity of wheat pentosans in broiler diets. Bri. Poult. Sci. 31: 811-821.
Damry, 2006. Growth of duckweed and labelling it with 15N for use in isotope dilution studies.
Agroland 11: 406-412.
Damry and J.V. Nolan, 2002. Degradation of duckweed protein in the rumen of sheep. Ani. Prod. Aust. 24: 45-48.
Table 1. Amounts of 15N Flowing in Various N Materials Through The Abomasum (mmol/d) During a Continuous Provision into The Rumen of 15N-ammonia or 15N-Labelled Duckweed
Faichney, G. J., 1975. The use of markers to partition digestion within the gastro-intestinal tract of ruminants. In Digestion and Metabolism in the Ruminant (Eds. I. W. McDonald and W. C. I. Warner). The UNE Publishing Unit, Armidale, pp. 277-291.
Harrop, C. J. F., 1974. Nitrogen metabolism in the ovine stomach. 4. Nitrogen components of the abomasal secretions. J. Agric. Sci., Camb. 83: 249-257.
Motulsky, H. J., 1999. GraphPad Prism. 3.02. GraphPad Software Inc., San Diego.
Nolan, J. V., 1971. Dynamics of Protein Metabolism in S heep. P hD Thesis. Department of Biochemistry and Nutrition, The University of New England, Armidale, NSW. Australia. Nolan, J. V., 1975. Quantitative models of nitrogen
metabolism in the rumen. In The IV International Symposium on Ruminant Physiology (Eds, I. W. McDonald and A. C. I. Warner). The University of New England Publishing Unit, Armidale, pp. 416-431.
Nolan, J. V. and R. A. Leng, 1972. Dynamic aspects of ammonia and urea metabolism in sheep. Brit. J. Nutr. 27: 177-194.
Oldick, B. S., J. L. Firkins and R. A. Kohn, 2000. Compartmental modeling with nitrogen-15 to determine effects of degree of fat saturation on intraruminal N recycling. J. Anim. Sci. 78: 2421-2430.
SCA, 1990. Feeding Standars for Australian Livestock: Ruminants. CSIRO Publication, Melbourne, Victoria, Australia.
Siddons, R. C., D. E. Beever and J. V. Nolan, 1982. A comparison of methods for the estimation of microbial nitrogen in duodenal digesta of sheep. Brit. J. Nutr. 48: 377-389.
Uden, P., P. E. Colucci and P. J. Van Soest, 1980. Investigation of chromium, cerium and cobalt as markers in digesta. Rate of passage studies. J. Sci. Food Agric. 31: 625-632.
Vogtmann, H., H. P. Pfirter and A. L. Prabucki, 1975. New method for determining metabolisability of energy and digestibility of fatty acids in broiler diets. Brit. Poult. Sci. 16: 531-534.