SPECIAL ISSUE
THE VALUES OF WETLANDS: LANDSCAPE AND INSTITUTIONAL
PERSPECTIVES
Valuing the environment as input: review of applications to
mangrove-fishery linkages
Edward B. Barbier *
Director,Centre for En6ironment and De6elopment Economics,En6ironment Department,Uni6ersity of York,Heslington, York YO1 5DD,UK
Abstract
The following paper reviews recent developments in the methodology for valuing the role of wetlands in supporting economic activity. The main focus will be on mangroves serving as a breeding ground and nursery habitat in support of coastal and marine fisheries. As this particular ecological function of a mangrove system means that it is effectively an unpriced ‘environmental’ input into fisheries, then it is possible to value this contribution through applying the production function approach. The first half of the paper overviews the procedure for valuing the environment as an input, applied to the case of a wetland supporting a fishery. Both the ‘static’ Ellis – Fisher – Freeman approach and the ‘dynamic’ approach developed by Barbier and Strand, incorporating the intertemporal bioeconomic fishing problem, are reviewed. The second half of the paper discusses briefly two recent case studies of mangrove-fishery valuation. An application in South Thailand, which is based on the static Ellis – Fisher – Freeman model, and an application in Campeche, Mexico, which is based on the dynamic approach. © 2000 Elsevier Science B.V. All rights reserved.
Keywords:Ecological functions; Environmental valuation; Fisheries; Habitat-fishery linkages; Mangroves
www.elsevier.com/locate/ecolecon
1. Introduction
The following paper overviews the general methodology for valuing mangrove-fishery link-ages that can be applied to a variety of mangrove and coastal wetland systems found around the world. This approach has been used to assess the
economic value of coastal wetland habitats in support of marine fisheries and other ecological functions, such as determining the value of marsh-lands as habitat for Gulf Coast fisheries in the southern United States (Lynne et al., 1981; Ellis and Fisher, 1987; Farber and Costanza, 1987; Bell, 1989; Freeman, 1991; Bell, 1997) and the value of mangroves for coastal and marine fisheries in Thailand (Sathirathai, 1997) and Mex-ico (Barbier and Strand, 1998). This approach is consistent with other related studies attempting to * Tel.: +44-1904-434060; fax:+44-1904-432998.
E-mail address:[email protected] (E.B. Barbier).
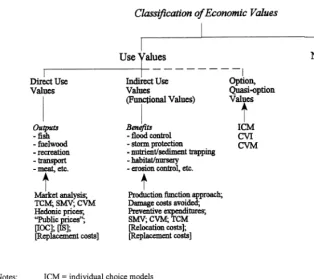
Fig. 1. Valuing wetland benefits. analyze habitat-fishery problems more generally,
such as analyzing the competition between man-groves and shrimp aquaculture in Ecuador (Parks and Bonifaz, 1994), determining the value of a multiple-use mangrove system under different management options in Bintuni Bay, Irian Jaya, Indonesia (Ruitenbeek, 1994), and examining gen-eral coastal system trade-offs, such as the effects of development and/or pollution on habitat-fish-ery linkages (Kahn and Kemp, 1985; Knowler et al., 1997 Strand and Barbier, 1997; Strand and Bockstael, 1990; Swallow, 1990; Swallow, 1994).
Natural wetlands, including mangroves, provide many important functions for hu-mankind, which can be grouped in terms of direct use, indirect use and non-use values. Fig. 1 sum-marizes the standard techniques available for as-sessing the various economic values of wetlands.1
Here, the concern is mainly with indirect use values, i.e. the indirect support and protection provided to economic activity and property by a wetland’s natural ‘services’, or regulatory ecologi-cal functions. The ecologiecologi-cal function of particu-lar interest is the role of a mangrove or coastal estuarine wetland system in serving as a breeding ground or nursery for off-shore fisheries.
The main technique for valuing this ecological function of a wetland has been called, variously, the production function approach, valuing the environment as input and the value of changes in productivity approach (Freeman, 1991; Ma¨ler, 1991; Barbier, 1994). The basic assumption of this
approach is that, because the wetland serves as a breeding ground or nursery for the fishery, this function can be treated as an additional environ-mental ‘input’ into the fishery. In static ap-proaches, the welfare contribution of this input is determined through producer and consumer sur-plus measures of changes in the market equi-librium for harvested fish. In dynamic approaches, the wetland support function is in-cluded in the intertemporal bioeconomic harvest-ing problem, usually as part of the growth function of the fish stock, and any welfare im-pacts of a change in this function can be deter-mined in terms of changes in the long-run equilibrium conditions of the fishery or in the harvesting path to this equilibrium.
The following section reviews both the static and dynamic production function approaches and their suggested applications to the wetland-fishery valuation problem. Two recent case studies of valuing mangrove-fishery linkages are then re-viewed. One applies the static methodology in Southern Thailand (Sathirathai, 1997), and the other applies the dynamic model in Campeche, Mexico (Barbier and Strand, 1998).
2. The production function approach
When a wetland is being indirectly used, in the sense that the ecological functions of the wetland are effectively supporting or protecting economic activity, then the value of these functions is essen-tially nonmarketed. However, economists have demonstrated that it is possible to value such nonmarketed environmental services through the use of surrogate market valuation, which essen-tially uses information about a marketed good to infer the value of a related nonmarketed good. Travel cost methods, recreational demand analy-sis, hedonic pricing and averting behaviour mod-els are all examples of surrogate market valuation that attempt to estimate the derived demand by households for environmental quality.
The following section describes another type of surrogate market valuation that is particularly useful for the valuation of nonmarketed values associated with biological resources and
ecosys-tems, such as coastal wetlands and mangroves, that protect or support economic activity, in par-ticular coastal and marine fisheries. This is the production function approach.2
The general approach consists of a two-step procedure. First, the physical effects of changes in a biological resource or ecological function on an economic activity are determined. Second, the impact of these environmental changes is valued in terms of the corresponding change in the mar-keted output of the corresponding activity. In other words, the biological resource or ecological function is treated as an’input’ into the economic activity, and like any other input, its value can be equated with its impact on the productivity of any marketed output.
More formally, if Qis the marketed output of an economic activity, then Qcan be considered to be a function of a range of inputs:
Q=F(Xi…Xk, S) (1)
For example, the ecological function of particu-lar interest is the role of mangroves in supporting off-shore fisheries through serving both as a spawning ground and a nursery for fry. The area of mangroves in a coastal region,S, may therefore have a direct influence on the catch of mangrove-dependent species, Q, which is independent from the standard inputs of a commercial fishery,
Xi…Xk. Including mangrove area as a determinant
of fish catch may therefore ‘capture’ some element of the economic contribution of this important ecological support function.
The above production function approach could be applied potentially to any of the various indirect use values of wetland systems indicated in Fig. 1. Thus this approach should prove to be a useful method of estimating these nonmarketed — but often significant — economic values. However, in order for this method to be applied, it is extremely important that the relationship between any envi-ronmental regulatory function and the economic activity it protects or supports is well understood. Ma¨ler (1991) distinguishes between applications of the production function approach. When produc-tion,Q, is measurable and either there is a market price for this output or one can be imputed, then determining the marginal value of the resource is relatively straightforward. IfQcannot be measured directly, then either a marketed substitute has to be found, or possible complementarity or substitutabil-ity between S and one or more of the other (marketed) inputs, Xi...Xk, has to be specified
explicitly. Although all these applications require detailed knowledge of the physical effects on pro-duction of changes in the resource, S, and its environmental functions, applications that assume complementarity or substitutability between the resource and other inputs are particularly stringent on the information required on physical relation-ships in production. Clearly, cooperation is required between economists, ecologists and other re-searchers to determine the precise nature of these relationships.
Applications of the production function ap-proach may be most straightforward in the case of single use systems, i.e. resource systems in which the predominant economic value is a single regulatory function, or a group of ecological functions provid-ing support or protection for an economic activity in concert. In the case of multiple use systems — i.e. resource systems in which a regulatory function may support or protect many different economic activities, or which may have more than one regulatory ecological function of important eco-nomic value — applications of the production function approach may be slightly more
problem-atic. In particular, assumptions concerning the ecological relationships among these various multi-ple uses must be carefully constructed. Two major problems are double counting and trade offs be-tween various direct and indirect use values, which appear whenever analysts attempt to aggregate the various direct and indirect use values arising from multiple use resource systems.
Aylward and Barbier (1992) provide an example of both on-site and off-site double-counting in terms of the nutrient retention function of a coastal wetland. Coastal wetlands often absorb organic nutrients from sewage and other waste emitted into waterways further upstream. Suppose that the nutrients held by the wetland are indirectly support-ing both shrimp production within the wetland area and the growth of fish fry that supply an off-shore fishery. If the full value of the shrimp production is already accounted for as a direct use value of the wetland’s resources, adding in the share of the nutrient retention service as an indirect value and aggregating these values would double count this indirect use. In other words, the value of shrimp production already ‘captures’ the value-added con-tribution of nutrient retention.3
If instead one wanted to explicitly account for the value-added contribution to shrimp production of the nutrient retention function, then the direct value of the shrimp must be decreased to account for the return in value now attached to the nutrient retention service.
Similarly, if the fish fry supported through nutri-ents retained in the wetland eventually migrate to an off-shore fishery, then the indirect contribution during the fry’s stay in the wetland is included as on off-site component of the service’s value. That is, the nutrient retention function of the wetland produces an ‘external’ benefit in terms of supporting an off-shore fishery. Again, care must be taken to adjust the value of harvested fish in any companion analysis of the adjoining fishery to avoid misrepre-senting the total economic value of the wetland and the fishery taken together.
Tradeoffs between two or more indirect use values of a given ecosystem may also occur. For example,
Barbier et al. (1993) illustrate why it is necessary to account for such trade-offs in their analysis of the Hadejia – Jama’are floodplain in northern Nigeria. The floodplain supports a number of important agricultural, forestry and fishing activities within the area of natural flooding. The floodplain also con-tributes to the recharge of groundwater, which is in turn drawn off by numerous small village wells throughout the region for domestic use and agricul-tural activities. However, concerns have recently been expressed about the excessive water use of pump-irrigated wheat production within the flood-plain. Increasing use of the floodplain water to support this activity may mean less water available for natural groundwater recharge, and thus for village wells outside the floodplain. If there are tradeoffs between the two environmental support functions, then adding the full value of the wetland’s contribution to pump-irrigated wheat production within the floodplain to the full value of groundwa-ter recharge of wells in neighbouring regions would overestimate the total benefit of these two environ-mental functions. In fact, in their analysis the authors had to adjust their estimates of the flood-plain benefits for the ‘unsustainability’ of much pump-irrigated wheat production within the flood-ing area. The results of the analysis suggest that, even without considering the economic benefits of the groundwater recharge function, diverting water for upstream development does not make much economic sense if it is detrimental to the natural flooding system downstream.
Despite these pitfalls, many recent studies have attempted to employ the production function ap-proach in valuing one or more regulatory functions of wetlands, in particular the role of estuarine wetlands and mangroves in supporting off-shore fisheries. There are two ways in which this approach has been implemented. The first is essentially a static approach, which either ignores the intertemporal fish harvesting process (i.e. assumes single-period or static production) or assumes that fish stocks are always constant (i.e. harvesting always offsets any natural growth in the fish population). Either assumption can be used to derive a market equi-librium for fish harvest, and thus to estimate changes in consumer and producer surplus arising from the impacts of a change in mangrove area on this static
equilibrium. The second is essentially a dynamic approach, which attempts to model the effects of a change in mangrove area on the growth function of the intertemporal fishing problem. By solving for the long-run equilibrium of the fishery, the compar-ative static effects and resulting welfare impacts of a change in mangrove area on the equilibrium levels of stock, effort and harvest can be determined.
3. Static models
The static approach to valuing wetland-fishery linkages owes its development to a number of studies that have tried to determine the value of marshlands as habitat for Gulf Coast fisheries in the southern United States (Lynne et al., 1981; Ellis and Fisher, 1987; Farber and Costanza, 1987; Bell, 1989; Free-man, 1991; Bell, 1997).
The initial method was first developed by Lynne et al. (1981). Their approach was essentially half-way between the ‘static’ and ‘dynamic’ approaches described in this paper. Lynne et al. suggested that the support provided by the marshlands of southern Florida for the Gulf Coast fisheries could be modelled by assuming that marshland area is an additional argument in the bioeconomic growth equation of the fishery. Assuming that the latter function is logistic, and that harvesting of fish offsets any natural growth in fish stock, then the authors obtain the following relationship between fish har-vest, h, fishing effort, E, and marshland area, M
ht=b0+b1Et lnMt−1+b2Et
2lnM
t−1+mt (2)
The parameters of Eq. (2) can be estimated from data on harvest, fishing effort and marshland area for those wetland-dependent species for which such data are available.4Lynne et al. use such estimates
and the price of harvested fish to derive the value
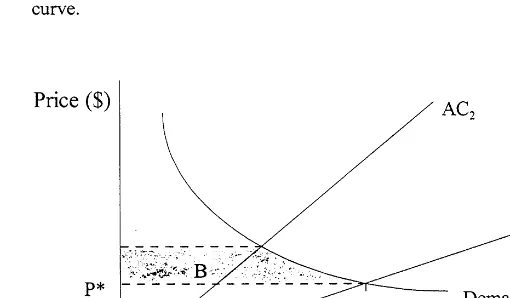
Fig. 2. Welfare measures in optimally managed and open access fisheries in static models. of the marginal productivity of a change in
wet-land area in terms ofh. For example, for the blue crab fishery in western Florida salt marshes, the authors obtain a marginal productivity of 2.3 lb per year for each acre of marshland. Others have applied the Lynne et al. approach and Eq. (2) to additional Gulf Coast fisheries in western Florida (Bell, 1989, 1997; Farber and Costanza, 1987).
However, it is possible to view Eq. (2) as a kind of wetland-effort production function for a fish-ery, and assuming a static or one-period model,
the cost of catch (see Fig. 2). The value of the wetlands’ support for the fishery, which in this case is equivalent to the value of increments to wetland area, can then be imputed from the re-sulting changes in consumer and producer surplus.
An important assumption in the Ellis and Fisher model is that Lynne et al.’s Eq. (2) can be approximated by the Cobb – Douglas form
h=AEaMb (3)
wherehis the quantity of crab catch in pounds,E is catch effort measured by traps set and M is area of wetlands. From the profit-maximizing conditions of the static optimization model for harvesting, the corresponding cost function,C, is
C=WA−1/aM−b/ah1/a (4)
where W is the unit cost of effort. Assuming an iso-elastic demand for crabs and either private ownership or optimal public management (i.e. price equals marginal cost in both cases), Ellis and Fisher are able to estimate the change in con-sumer and producer surplus in the market for blue crabs resulting from a change in marshland area (see Fig. 2).
Freeman (1991) extends further Ellis and Fish-er’s approach to show how the values imputed to the wetlands are influenced by the market condi-tions and regulatory policies that affect harvesting decisions in the fishery, in particular whether it operates under conditions of open access or opti-mal management. For example, under open ac-cess, rents in the fishery would be dissipated, and price would be equated to average and not mar-ginal costs. As a consequence, producer surplus is zero and only consumer surplus determines the value of increased wetland area (see Fig. 2). Free-man demonstrates that when the deFree-mand for crabs is inelastic, the social value of an increase in area is higher under open access than under opti-mal regulation, whereas the wetlands are more valuable under optimal regulation when demand is elastic. This result stems from the role of price changes in allocating welfare gains between pro-ducers and consumers: in the case of optimal regulations, part of the consumers’ gain is a trans-fer from producer surplus, whereas under open
access and zero producer surplus, any reduction in the price of fish associated with the average cost curve shifting down (in response to an in-crease in wetland area) results in a gain in con-sumer surplus and increased wetland value.
Freeman also calculates the social value of the marginal product of marshland area, VMPM,
which from Eq. (3) is
VMPM=Pb
h
M (5)
where P is the price of crabs. As optimal regula-tion should lead to a higher price than open access, an inelastic demand means that VMPM is
higher under optimal regulation.
These different impacts of market conditions and regulatory policies for the production func-tion approach to valuing biological resources and systems, where open access exploitation and im-perfect markets for resources are common. As argued by Barbier (1994), this may be a prevalent feature of resource systems in tropical regions.
Applications of the production function ap-proach to value more than one regulatory func-tion of a wetland that supports or protects many different economic activities are rare. As noted above, assumptions concerning the ecological re-lationships among these various multiple uses must be carefully constructed, and the data for this analysis are often not available.
sedi-mentation, which protects agricultural production in the region; and they have an indirect role in supporting biodiversity. To the extent that the ecological linkages in terms of support or protec-tion of these activities are strong, then the oppor-tunity cost of forestry options that lead to the depletion or degradation of the mangroves will be high. Thus, the ‘optimal’ forest management op-tion — whether clear cutting, selective cutting or complete preservation — depends critically on the strength of the ecological linkages.
In the absence of any ecological data on these linkages, Ruitenbeek develops several different scenarios based on different linkage assumptions. This essentially amounted to specifying more spe-cifically the relationship between Q and S in the simple production function relationship Eq. (1) indicated above. Thus for each productive activity at time t, Qit, the following relationship is
assumed
Qit/Qi0=(St−t/S0)a (6)
where St is the area of remaining undisturbed
mangroves at timet, aandtare impact intensity and delay parameters, respectively, Qi0=Qit(t=
0) and S0=St(t=0). For example, for
fishery-mangrove linkages, a moderate linkage ofa=0.5 and t=5 would imply that shrimp output varies with the square root of mangrove area (e.g. a 50% reduction in mangrove area would result in a 30% fall in shrimp production), and there would be a delay of 5 years before the impact takes effect. If no ecological linkages are present, i.e. there is no indirect use value of mangroves in terms of sup-porting shrimp fishing, then a=0. At the other extreme, very strong linkages imply that the im-pacts of mangrove removal are linear and imme-diate, i.e. a=1 and t=0.
Based on his analysis, Ruitenbeek concludes that the assumption of no or weak environmental linkages is unrealistic for most economic activities related to the mangroves. Moreover, given the uncertainty over these ecological linkages and the high costs associated with irreversible loss, if envi-ronmental linkages prove to be significant, then only modest selective cutting (e.g. 25% or less) of the mangrove area was recommended.
4. Dynamic models
The production function approach can also be incorporated into intertemporal models of renew-able resource harvesting in cases where the eco-logical function affects the growth rate of a stock over time. In such cases, the production function link is a dynamic one, as the ecological function affects the rate at which a renewable resource increases over time, which in turn affects the amount of offtake, or harvest, of the resource. The basic approach to valuation of an environ-mental input to renewable resource production in a dynamic context is outlined by Hammack and Brown (1974), Ellis and Fisher (1987), Freeman (1993), Barbier and Strand (1998).
As shown by Barbier and Strand (1998), adapt-ing bioeconomic fishery models to account for the role of a mangrove system in terms of supporting the fishery as a breeding ground and nursery habitat is fairly straightforward, if it is assumed in the fishery model that the effect of changes in mangrove area is on the carrying capacity of the stock and thus indirectly on production.5Defining
Xt as the stock of fish measured in biomass units,
any net change in growth of this stock over time can be represented as
Xt+1−Xt=F(Xt, Mt)−h(Xt, Et), FX\0,FM
\0 (7)
Thus net expansion in the fish stock occurs as a result of biological growth in the current period, F(Xt, Mt), net of any harvesting, h(Xt, Et). Note
that the standard fish harvesting function is em-ployed; i.e. harvesting is a function of the stock as well as fishing effort,Et. Instead, it is the
biologi-cal growth function of the fishery that is modified to allow for the influence of mangrove area, Mt,
as a breeding ground and nursery. It is reasonable to assume that this influence on growth is posi-tive, i.e.(F/(Mt=FM\0, as an increase in
man-grove area will mean more carrying capacity for the fishery and thus greater biological growth.
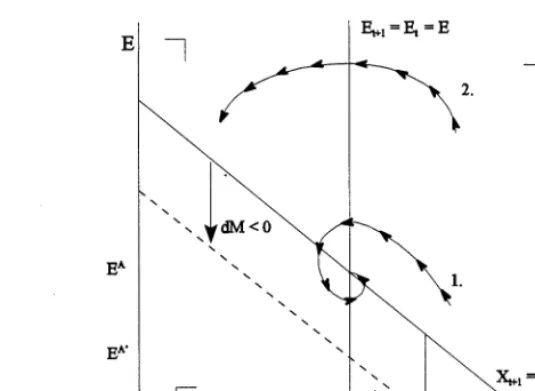
Fig. 3. Mangrove loss and the long-run equilibrium of an open access fishery. Eq. (7) can now be employed in a standard
intertemporal harvesting model of the fishery, where depending on the management regime, har-vesting over time can either be depicted to occur under open access conditions (i.e. effort in the fishery adjusts over time to the availability of profits) or under optimal management conditions (the discounted net returns from harvesting the fishery are maximized over time). The effect of a change in mangrove area can therefore be valued in terms of changes in the optimal path of harvest-ing over the period of analysis and in terms of the changes in the long-run equilibrium of the fishery. Fig. 3 shows the fairly straightforward case analyzed by Barbier and Strand, where the effects of a change in mangrove area is depicted in terms of influencing the long-run equilibrium of an open access fishery. In the figure, the long-run equi-librium of the fishery is depicted in terms of steady values for effort, E, and fish stocks, X. As dis-cussed above, the carrying capacity of the fishery is assumed to be an increasing function of man-grove area, i.e.K=K(M),KM\0. Trajectory one
shows an optimal path to a stable long-run equi-librium for the fishery. In this case, a decrease in mangrove area causes the long-run level of fishing effort to fall. As harvesting levels are generally positively related to effort levels, the consequence of mangrove deforestation is also a decrease in equilibrium fish harvest.
5. A case study of a static model: southern Thailand
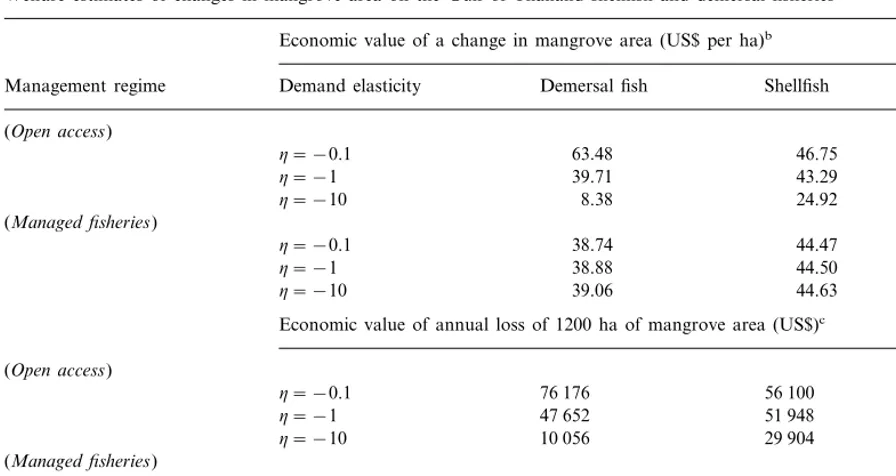
Table 1
Welfare estimates of changes in mangrove area on the Gulf of Thailand shellfish and demersal fisheriesa Economic value of a change in mangrove area (US$ per ha)b
Shellfish All fish
(Managed fisheries)
44.47
Economic value of annual loss of 1200 ha of mangrove area (US$)c (Open access) (Managed fisheries)
46 488 53 364 99 852
h= −0.1
h= −1 46 656 53 400 100 056
100 428
h= −10 46 872 53 556
aBased on Sathirathai (1997).
bCalculations assume an initial equilibrium quantity demand and price based on observed data for Surat Thani Province (Zone three) in 1993. For demersal fish this is harvested output of 1 545 000 kg and price of US$ 1.51/kg, and for shellfish 1 917 000 kg and US$2.58/kg.
cOver 1991–3, the average annual loss of mangroves in Surat Thani province (Zone three) was estimated to be around 12.19 km2, or around 1200 hectares (ha).
be around 3000 ha/year for all of Thailand, and 1200 ha/year in Surat Thani province.
The Gulf of Thailand mangroves are thought to provide breeding grounds and nurseries in sup-port of several species of demersal fish and shellfish, mainly crab and shrimp.6
To analyze the impact of mangrove deforestation on these fisheries in Surat Thani, Sathirathai assumes that harvesting in both demersal and shellfish fisheries is a Cobb – Douglas function of the level of fishing effort and mangrove area, as depicted by Eq. (3).7
A separate harvesting function is assumed to ap-ply to demersal fish as opposed to shellfish.
Sathirathai conducts a panel analysis to esti-mate a log-linear version of Eq. (3) for all shellfish and all demersal fish in the Gulf of Thailand. The analysis combines harvesting, effort and man-grove data across all five zones of the Gulf of Thailand and over the 1983 – 93 time period. This allows estimation of the parametersA,aandbin Eq. (3), for two separate Cobb – Douglas produc-tion funcproduc-tions, one each for demersal fish and shellfish. Combining this information with the estimated unit cost of effort, W, allows the Cobb – Douglas cost function Eq. (4) to be spe-cified for both demersal fish and shellfish for each of these fisheries in Surat Thani Province. This province is an important fishing region in Zone three of the Gulf of Thailand. Following the methodology indicated in Fig. 2, Sathirathai uses the cost functions derived for each fishery to 6Mangrove-dependent demersal fish include those belonging
to theClupeidae,Chanidae,Ariidae,Pltosidae,Mugilidae,Lu -janidaeand Latidae families. The shellfish include those be-longing to the families ofPanaeidaefor shrimp andGrapsidae, OcypodidaeandPortnidaefor crab.
estimate the likely welfare impacts of a change in mangrove area in Surat Thani, assuming alterna-tively open access and managed fishery conditions. Table 1 shows the results of the welfare calcula-tion for the impact of a per ha change in mangrove area on the Gulf of Thailand shellfish and demersal fisheries of Surat Thani Province. For all man-grove-dependent fisheries, the value of a change in mangrove area ranges from US$33-110/ha, de-pending on whether the fisheries are open access or managed. Similar to the outcome reported by Freeman (1991) for the Florida Gulf Coast blue crab fishery, when the demand for Gulf of Thailand fish is inelastic, the value of a change in mangrove area in Surat Thani is higher under open access than under optimal regulation, whereas the wet-lands are more valuable under optimal regulation when demand is elastic. Under managed fishery conditions, different demand elasticity assumptions hardly affect the welfare estimates of a change in mangrove area, which are estimated to be around US$39/ha for demersal fish and US$45/ha for shellfish. In the open access scenario, changes in elasticities affect more the value of mangroves in supporting demersal fisheries as opposed to shellfish. Thus under open access and depending on the elasticity of demand, the value of the mangroves in Surat Thani ranges from US$8-63/ha for demer-sal fish and from US$25-47/ha for shellfish.
Table 1 also shows the estimated welfare impacts associated with the annual loss of 1200 ha of mangroves in Surat Thani, which was approxi-mately the annual rate of mangrove conversion recorded in the early 1990s in the province. Given this rate of deforestation, the economic loss in terms of support of the Gulf of Thailand fisheries in Zone three is estimated to be around US$100 000 per year, if these fisheries were opti-mally managed. Under open access conditions, this economic loss ranges from US$40 000 to 132 000, depending on demand elasticities.
6. A case study of a dynamic model: Campeche, Mexico
Barbier and Strand (1998) employ the dynamic approach to production function analysis to value
the role of mangroves in the Laguna de Terminos in supporting the shrimp fishery of Campeche, Mexico.
Mexico’s gulf coast states account for over half of the country’s shrimp catch, and the state of Campeche is responsible for one-sixth of Mexico’s total output of shrimp. Campeche’s shrimp fishery employs about 13% of the state’s economically active population. In recent years the total number of boats in the fishery have increased substantially, but the composition of the fleet has also changed significantly. There has been a substantial decline in the number of commercial vessels, whereas the artisanal fleet has expanded rapidly. From 1980 – 1987, production in the shrimp fishery fluctuated steadily between 7 – 8 thousand metric tons (KMT), but by 1990 output had fallen to 4.6 KMT.
The mangroves in the Laguna de Terminos are considered by ecologists to be the main breeding ground and nursery habitat for the shrimp fry of the Campeche fishery (Yan˜ez-Arancibia and Day, 1988). Mangrove area was estimated to be around 860 km2 in 1980, declining to about 835 km2 in
1991, a loss of around 2 km2 per annum. The
primary reason for the loss is the encroachment of population from Carmen, the large city adjacent to Laguna de Terminos. Future threats are expected to come from expansion of shrimp aquaculture through conversion of coastal mangroves, and possibly pollution.
Barbier and Strand model the effects of man-grove deforestation in Laguna de Terminos by use of comparative static analysis of the long-run equilibrium, as depicted in Fig. 3. In their model of the Campeche shrimp fishery, they assume that the basic growth function of the fishery is logistic and that shrimp harvesting follows the conven-tional Schaefer production process, ht=qEtXt.
Thus Eq. (7) becomes
Xt+1−Xt=[r(K(Mt)−Xt)−qEt]Xt (8)
where r is the intrinsic growth of shrimp each period,Kis the environmental carrying capacity of the system and mangrove area,Mt, has a positive
impact on carrying capacity, i.e. KM\0.
propor-tional relationship between mangrove area and carrying capacity, i.e. K(M)=aM, a\0. As the
shrimp stock is constant in the long-run equi-librium,Xt=Xt+1=X, then using this condition
in Eq. (8) and the Schaefer production function to substitute for X, the following relationship be-tween shrimp production, mangrove area and ef-fort is derived
The authors estimate Eq. (9) by employing 1980 – 90 time series data on shrimp harvests, effort and mangrove area for Campeche, Mexico, to derive the parametersb1=aq andb2= −q
2
/r. A second condition of the long-run equilibrium of an open access fishery is that profits will be zero, i.e. ph=cE, where p is the price of shrimp catch andcis the cost of fishing effort. In order to simulate the comparative static effects of a change in mangrove area, Barbier and Strand assume that this ‘zero profit’ condition holds for the Campeche shrimp fishery. Using actual price data on shrimp catches over this period, they calculate the costs of effort,cA, necessary for the zero profit
condition to hold for the Campeche fishery over 1980 – 90. Using the estimated parameters of Eq.
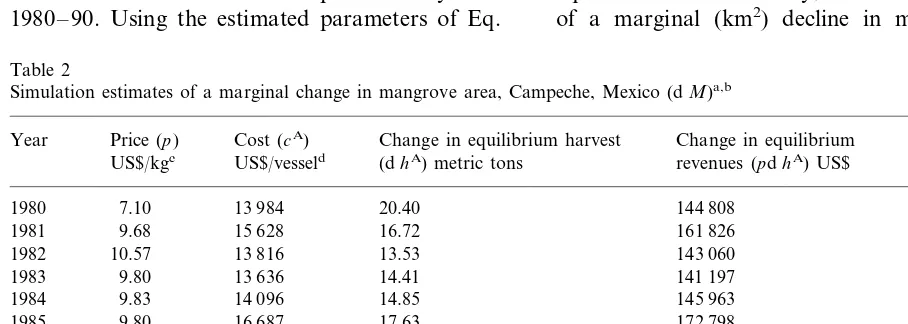
(9) with the price and cost data, the authors simulate the effects of a change of mangrove area on equilibrium harvesting and gross revenues in the Campeche shrimp fishery over 1980 – 90.
The results are depicted in Table 2. On average over the 1980 – 90 period, a marginal (in km2)
decline in mangrove area produces a loss of about 14.4 metric tons of shrimp harvest and nearly US$140 000 in revenues from the Campeche fish-ery each year. However, given the relatively small rate of annual mangrove deforestation in the re-gion over the 1980 – 90 period — around 2 km2
per year — the resulting loss in shrimp harvest and revenues does not appear to be substantial, only around 0.4% per year.
The simulation in Table 2 also demonstrates how the economic losses associated with grove deforestation are affected by long-run man-agement of the open access fishery. As noted above, the early years of the period of analysis (e.g. 1980 – 81) were characterized by much lower levels of fishing effort and higher harvests (e.g. on average around 4800 combined vessels extracting about 8.5 KMT annually). Table 2 shows that, if this earlier period represented the open access equilibrium of the fishery, the economic impacts of a marginal (km2
) decline in mangrove area
Table 2
Simulation estimates of a marginal change in mangrove area, Campeche, Mexico (dM)a,b
Cost (cA) Change %
Year Price (p) Change in equilibrium harvest Change in equilibrium US$/kgc US$/vesseld (dhA) metric tons revenues (pdhA) US$
0.23
7.10 144 808
1980 13 984 20.40
1981 9.68 15 628 16.72 161 826 0.20
10.57 13 816
1982 13.53 143 060 0.18
1983 9.80 13 636 14.41 141 197 0.18
9.83 14 096 14.85 0.19
1984 145 963
172 798 0.20
9.80
1985 16 687 17.63
155 460 0.19
10.00
1986 15 013 15.55
0.20 148 731
14.55 1987 10.22 14 363
1988 10.56 14 132 13.86 146 334 0.20
10.21 10 000
1989 10.14 103 547 0.17
10.40 69 143
1990 6677 6.65 0.14
14.39 13 457
9.83 139 352
Mean 0.19
aSource: Barbier and Strand (1998). bParameter estimates:b
1=4.4491;b2= −0.4297. cUS$/kg, in real (1982) prices.
would be a reduction in annual shrimp harvests of around 18.6 tons, or a loss of about US$153 300 per year. In contrast, the last two years of the analysis (e.g. 1989 – 90) saw much higher levels of effort and lower harvests in the fishery (e.g. around 6700 combined vessels extracting 5.3 KMT annually). As a consequence, if this latter period represents the open access equilibrium, then a marginal decline in mangrove area would result in annual losses in shrimp harvests of 8.4 tons, or US$86 345 each year.
Thus, the value of the Laguna de Terminos mangrove habitat in supporting the Campeche shrimp fishery appears to be affected by the level of exploitation. This suggests that, if an open access fishery is more heavily exploited in the long run, the subsequent welfare losses associated with the destruction of natural habitat supporting this fishery are likely to be lower. Intuitively, this makes sense. The economic value of an over-ex-ploited fishery will be lower than if it were less heavily depleted in the long run. The share of this value that is attributable to the ecological support function of natural habitat will therefore also be smaller.
The management implications are clear: As long as effort levels continue to rise, harvests will fall, even if mangrove areas are fully protected. More-over, any increase in harvest and revenues from an expansion in mangrove area is likely to be short-lived, as it would simply draw more effort into the fishery. Better management of the Campeche shrimp fishery to control over-exploitation may be the only short-term policy to bring production back to respectable levels, as well as realizing the more long-term economic benefits of protecting mangrove habitat.
7. Conclusion
This paper has indicated how the economic value of mangroves in supporting coastal and marine fisheries can be estimated through applica-tion of producapplica-tion funcapplica-tion approaches. Both ba-sic static and dynamic production function models for estimating this value have been reviewed. Case studies of the application of the static and
dy-namic approaches to valuing the support function of mangroves in Thailand and Mexico have also been examined.
The production function approach appears to be well suited to valuing the important ecological role of coastal and estuarine wetlands in support-ing offshore fisheries. As these wetland systems are under considerable threat from coastal develop-ment, it is important to develop reliable economic estimates of the value of their ecological support function role. Failure to consider this value may misrepresent the economic costs associated with wetland conversion, which are too often assumed to be insignificant or zero in coastal development decisions. This is particularly the case in develop-ing countries, where many mangrove systems are threatened with conversion through the expansion in coastal areas of aquaculture, agriculture, tourism, and urban and infrastructural develop-ment.
environment as input, particularly valuing the ecological support functions of wetlands, such as mangrove systems. Ecologists have indicated that the regulatory functions performed by wetlands and other complex natural ecosystems may be highly significant in supporting and protecting economic activity. Perhaps the next phase in the development of production function approaches will be to apply such methodologies not just to valuing single-use functions of wetlands, such as the role of mangroves as nursery and breeding ground habitats for coastal and marine fisheries, but also to valuing simultaneously the diverse range of regulatory functions typically found in a multi-use natural wetland, such as those listed in Fig. 1.
Acknowledgements
A version of this paper was prepared for the 4th Workshop of the Global Wetlands Economics Network (GWEN), Wetlands: Landscape and In-stitutional Perspectives, Beijer International Insti-tute of Ecological Economics, The Royal Swedish Academy of Sciences, Stockholm, Sweden, 16 – 17 November 1997. I am grateful to Jack Ruiten-beek, Tore So¨derquist and an anonymous referee for helpful comments. However, the usual caveat applies.
References
Aylward, B.A., Barbier, E.B., 1992. Valuing environmental functions in developing countries. Biodivers. Conserv. 1, 34 – 50.
Barbier, E.B., 1994. Valuing environmental functions: tropical wetlands. Land Econom. 70, 155 – 173.
Barbier, E.B., Acreman, M. Knowler, D., 1997. Economic Valuation of Wetlands: A Guide for Policymakers. Ramsar Convention Bureau, Geneva, 127 pp.
Barbier, E.B., Adams, W.M., Kimmage, K., 1993. An eco-nomic valuation of wetland benefits. In: Hollis, G.E., Adams, W.M., Aminu-Kano, M. (Eds.), The Hadejia – Nguru Wetlands: Environment, Economy and Sustainable Development of a Sahelian Floodplain Wetland. IUCN, Geneva, pp. 191 – 209.
Barbier, E.B., Strand, I., 1998. Valuing mangrove-fishery link-ages: a case study of Campeche, Mexico. Environ. Resour. Econ. 12, 151 – 166.
Bockstael, N.E., McConnell, K.E., 1981. Theory and estima-tion of the household producestima-tion funcestima-tion for wildlife recreation. J. Environ. Econ. Manag. 8, 199 – 214. Bell, F.W., 1989. Application of Wetland Valuation Theory to
Florida Fisheries. Report No. 95, Florida Sea Grant Pro-gram, Florida State University, Tallahassee.
Bell, F.W., 1997. The economic value of saltwater marsh supporting marine recreational fishing in the Southeastern United States. Ecol. Econ. 21, 243 – 254.
Ellis, G.M., Fisher, A.C., 1987. Valuing the environment as input. J. Environ. Manag. 25, 149 – 156.
Farber, S., Costanza, R., 1987. The economic value of wet-lands systems. J. Environ. Manag. 24, 41 – 51.
Freeman, A.M., 1991. Valuing environmental resources under alternative management regimes. Ecol. Econ. 3, 247 – 256. Freeman, A.M., 1993. The Measurement of Environmental and Resource Values: Theory and Methods. Resources for the Future, Washington DC, pp. 516.
Hammack, J. Brown, G.M. Jr., 1974. Waterfowl and Wet-lands: Towards Bioeconomic Analysis. Resources for the Future, Washington DC, pp 273.
Kahn, J.R., Kemp, W.M., 1985. Economic losses associated with the degradation of an ecosystem: the case of sub-merged aquatic vegetation in Chesapeake Bay. J. Environ. Econ. Manag. 12, 246 – 263.
Knowler, D., Strand, I. Barbier, E.B., 1997. An Economic Analysis of Black Sea Fisheries and Environmental Man-agement. Final Report, The Black Sea Environment Pro-gramme, The World Bank/UNEP Global Enviromental Facility, Istanbul, Rome.
Lynne, G.D., Conroy, P., Prochaska, F.J., 1981. Economic value of marsh areas for marine production processes. J. Environ. Econ. Manag. 8, 175 – 186.
Ma¨ler, K.-G., 1991. The production function approach. In: Vincent, J.R. Crawford, E.W. and Hoehn, J.P. (Eds.) Valuing Environmental Benefits in Developing Countries. Special Report 29. Michigan State University, East Lans-ing, pp. 11 – 32.
Parks, P., Bonifaz, M., 1994. Nonsustainable use of renewable resources: mangrove deforestation and mariculture in Ecuador. Mar. Resour. Econ. 9, 1 – 18.
Ruitenbeek, H.J., 1994. Modelling economy-ecology linkages in mangroves: economic evidence for promoting conserva-tion in Bintuni Bay, Indonesia. Ecol. Econ. 10, 233 – 247. Sathirathai, S., 1997. Economic Valuation of Mangroves and
the Roles of Local Communities in the Conservation of the Resources: Case Study of Surat Thani, South of Thailand. Final report submitted to the Economy and Environment Program for Southeast Asia (EEPSEA), EEPSEA, Singapore.
Smith, V.K., 1991. Household production functions and envi-ronmental benefit estimation. In: Braden, J.B., Kolstad, C.D. (Eds.), Measuring the Demand for Environmental Quality. North-Holland, Amsterdam, pp. 41 – 76. Strand, I.E., Bockstael, N.E., 1990. Interaction between
and Resource Policies in Agricultural Systems. Springer-Verlage, New York, pp. 50 – 61.
Swallow, S.K., 1990. Depletion of the environmental basis for renewable resources: the economics of interdependent re-newable and nonrere-newable resources. J. Environ. Econ. Manag. 19, 281 – 296.
Swallow, S.K., 1994. Renewable and nonrenewable resource theory applied to coastal agriculture, forest, wetland and fishery linkages. Mar. Resour. Econ. 9, 291 – 310. Yan˜ez-Arancibia, A., Day, J.W. Jr. (Eds.), 1988. Ecology of
coastal ecosystems in the southern gulf of Mexico: The Terminos Lagoon Region. UNAM Press, Mexico, 518 pp.