www.elsevier.com / locate / bres
Interactive report
Laterality, somatotopy and reproducibility of the basal ganglia and
1MGH-NMR Center, Department of Radiology, Massachusetts General Hospital and Harvard Medical School, Charlestown, MA 02119, USA b
Department of Neurology, Massachusetts General Hospital and Harvard Medical School, Charlestown, MA 02119, USA c
Department of Diagnostic Radiology, Klinikum Grobhadern, Ludwig-Maximilians-University, Munich, Germany
Accepted 1 August 2000
Abstract
We investigated the basal ganglia, motor cortex area 4, and supplementary motor area (SMA) using functional magnetic resonance imaging (fMRI) and five motor tasks: switching between finger and toe movements, writing, finger tapping, pronation / supination, and saccadic eye movements. We found reliable activation in the caudate nucleus and putamen in single subjects without the need for inter-subject averaging. Percent signal changes in basal ganglia were smaller by a factor of three than those in SMA or motor cortex (1% vs. 2.5–3%). There was a definite foot-dorsal, hand-ventral basal ganglia somatotopy, similar to prior data from primates. Saccadic eye movements activated the caudate nucleus significantly more than the other tasks did. Unilateral movements produced bilateral activation in the striatum even when motor cortex activation was unilateral. Surprisingly, bilateral performance of the tasks led, on average, to consistently smaller basal ganglia activation than did unilateral performance (P,0.001), suggesting less inhibition of contralateral movements during bilateral tasks. Moreover, there was a striking dominance pattern in basal ganglia motor activation: the left basal ganglia were more active than the right for right handers, regardless of the hand used. This lateralization appears much stronger than that previously reported for motor cortex. Comparisons of inter-subject and intra-subject reproducibility indicated a much larger variability in basal ganglia and SMA compared to motor cortex, in spite of similar percent signal changes in the latter two structures. 2000 Elsevier Science B.V. All rights reserved.
Theme: Motor systems and sensorimotor integration
Topic: Basal ganglia
Keywords: Functional magnetic resonance imaging; Striatum; Putamen; Motor control; Laterality; Extrapyramidal system; Inhibition
1. Introduction raphy (PET) or functional magnetic resonance imaging
(fMRI) have become robust tools for identifying brain In spite of much study on the functional role of the basal areas related to motor behavior in humans and can depict ganglia, their specific role in motor control remains activity in the lentiform (putamen, globus pallidus) and unknown [2,3]. Anatomical and electrophysiological de- caudate nucleus. fMRI, with its excellent spatial resolution, scription of the individual nuclei are relatively well is a powerful technique to further study the role of these established, especially in animals, but it is not as easy to subregions of the basal ganglia in motor control
describe their multistage interactions during motor control. However, there are some even simpler, important, Neuro imaging techniques as positron emission tomog- questions related to organization of basal ganglia activity that have not been addressed so far [20,22]. First, is there hemispheric dominance in motor activation of the
len-1
Published on the World Wide Web on 28 August 2000.
tiform and caudate nucleus? In human motor cortex there
*Corresponding author. Tel.: 11-617-726-5816; fax: 1
1-617-736-is evidence for left hem1-617-736-ispheric dominance in right-handed
7422.
E-mail address: [email protected] (B.G. Jenkins). subjects [17] and animal and human studies show basal
ganglia asymmetry [4,11,12,18]. Secondly, to what extent resolution T1-weighted images were acquired for ana-is motor control in these areas bilaterally organized? Thus, tomical location. Flow-sensitive sequences were taken as we wished to determine the degree of activation seen in the well to highlight the vessels, so that the statistical maps lentiform and caudate nucleus comparing the same tasks could be compared with the vessel images. To minimize performed both bilaterally and unilaterally. Lastly, we motion artifacts, the subjects lay supine with their head wished to ask whether the somatotopic organization of the secured by a pillow, foam wedges, and a restraining strap. input zone of the basal ganglia (putamen and caudate) can
be mapped using current techniques and spatial resolution. 2.3. Tasks Although these areas of the basal ganglia have been
somatotopically mapped in non-human primates [7,10,19] Except in the saccadic eye movement task (which was
it has not been done in humans. necessarily bilateral), subjects were studied using their
We have chosen to investigate a series of simple motor right side, their left side, and both sides. We used a block tasks. We deliberately chose motor tasks with little cogni- design in which 6–8 blocks of 30 s of activation alternated tive component, in order to separate out as best as possible with 30 s of rest (described above). In addition, 40–60 s of the motor components of the questions above. In addition, baseline images were collected. Between 16 and 42 blocks we chose to investigate five different tasks, rather than of each task were performed. In each imaging session not exhaustively study one task, to assess whether issues more than five different studies were performed, to limit related to laterality and dominance are general across an fatigue and head movement during the fMRI
measure-array of motor tasks. ments.
The following tasks were performed:
2. Materials and methods
1. Switching between finger and toe movements: The
2.1. Subjects volunteers were asked to alternate self-paced finger
tapping and toe wiggling in response to a verbal cue We studied 22 healthy volunteers ages 23–53, mean age every two seconds. Finger and toe movements were 32.666.0; 14 male, 8 female. Twenty subjects were right- performed at a rate of |2 Hz as confirmed by an handed and two were left-handed. Additional tests of outside observer.
handedness were performed using the Oldfield handedness 2. Writing: The volunteers were asked to repeatedly sign [23] inventory, however, as we suggest below, the fMRI their names during the activation periods. The subjects provides a more objective measure of motor ‘handedness’. looked at their writing and followed it with their eyes. All subjects were drug-free, and had no known nervous In the resting periods the subjects kept their hands system disease or injury. The experiments were undertaken relaxed and did not hold the pencil.
with the understanding and written consent of each subject. 3. Cued finger tapping: The volunteers were told, by numbers 1, 2, 3, 4 which finger (index51, middle52,
2.2. Functional imaging ring53, little54) they were to oppose to the thumb.
The fingers were chosen randomly, at a frequency of All imaging was performed on a General Electric 1.5 about 2 Hz. The rate and performance of the task was Tesla Signa MR unit with an echo planar retrofit by monitored by an outside observer.
Advanced NMR (Woburn, MA). For the functional studies, 4. Eye movements: The subjects performed self-paced gradient echo planar and in a few trials, asymmetric spin voluntary horizontal saccadic eye movements of large echo images were collected in an oblique-coronal or axial amplitudes at approximately 2 Hz. This was done with orientation. The oblique-coronal slice orientation was open eyes. The subjects kept their eyes open during preferred because it allowed motor cortex and basal the rest periods as well, while fixing their gaze upon a ganglia to be covered with fewer slices, at the same time spot on the coil.
omitting the carotid arteries to avoid vascular artifacts. In 5. Pronation / supination: In the activation periods the every study eight to ten slices were acquired, spanning the subjects alternately supinated and pronated their head of the caudate through the globus pallidus and the forearm rapidly at a frequency of about 2 Hz which entire motor cortex. The standard GE quadrature head again, was monitored by an outside observer. radiofrequency coil was used in all studies. Imaging
adequately performed by all the subjects with only a slight Motor cortex was localized on the high-resolution
T1-loss of legibility. weighted images in a coronal plane by identifying the
superior frontal sulcus first [30,32]. Then a right angle
2.4. Analysis between the superior frontal sulcus and the precentral
sulcus defined the precentral gyrus, posterior to the pre-All MR images are presented according to the radiolo- central sulcus. In the sagittal scout image the precentral gical convention in which the left hemisphere appears on motor cortex was identified by the medial axial method: the right side of the image. All data sets were motion The marginal ramus of the cingulate sulcus could be corrected by automated registration and normalization of identified in every scout image. The next sulcus anterior to fMRI time course images, using in-house software [15]. this ramus is the central sulcus. Then the precentral motor Statistical color maps of activation were generated using cortex is located anterior to this gyrus. The hand area in the Kolmogorov–Smirnov statistic. T statistic maps were the motor cortex is located in the posterior bank of the also calculated for some of the images and the maps precentral gyrus. This could be seen in the coronal and looked essentially identical. We chose to measure the axial T1-weighted high resolution images as well. Accord-activations using absolute anatomic segmentation rather ing to the concept of the motor ‘homunculus’ the foot area than transformation to a stereotactic space such as is located in the most superior part of the precentral motor Talairach space. Although this was more labor intensive it cortex. By first identifying the hand and foot area in the avoids errors involved in parcellation of the basal ganglia anatomical images and then comparing the statistical which are quite small. We performed automated segmenta- functional maps to the presumed anatomical area this tion analysis of the statistical maps at a significance location was defined as the ‘functional motor hand or foot threshold of P,0.01. It was adjusted for the number of area’ and the statistically activated volumes were calcu-pixels, in which at least four pixels had to be clustered to lated there. The SMA was considered to be located be considered real. We measured and compared the number superior to the cingulate gyrus covering most of the mesial of activated pixels in the lentiform nucleus (i.e. putamen part of the premotor region in both hemispheres [26,28]. and globus pallidus), caudate nucleus, motor cortex, and No attempt was made to distinguish between pre-SMA SMA. In the anatomical T1-weighted images the volumes and SMA proper, though the area used in our study was of the lentiform and caudate nuclei were measured and the dorsal to a perpendicular to the AC–PC line and therefore following ratio was obtained: (activated pixels in nucleus) / corresponds to the SMA proper.
(anatomical volume of nucleus). Student’s t-tests were applied to the ratios described
The motor cortex activity was also used as a partial above. We compared the activated pixels in the motor internal control. All these tasks should produce robust cortex and SMA to the activated pixels in the basal motor cortical activity. If fMRI activation there is weak, it ganglia, calculated the variances and covariances, and is likely to be due to technical and / or machine problems. applied an F-test. The ratios of activated pixels in the basal Thus, runs that had no motor cortical activity were ganglia to the anatomical volume of the basal ganglia of discarded. Runs in which there was robust motor cortical each hemisphere were compared for evidence of laterality activity, but weak activity elsewhere, were kept in the by student’s t-tests. To look at somatotopy we compared analysis. The measured ratio (activated pixels / anatomical the studies showing functional activation in the caudate volume) helps control for the variation in basal ganglia nucleus, the lentiform nucleus, and the claustrum. Within volume across patients. It also provides the fraction of the the lentiform nucleus we registered the location of func-basal ganglia that is activated by a given task. This ratio tional activity as being in the superior, inferior, lateral, or should thus depend on the amount of the somatotopic map medial parts of lentiform nucleus in each slice.
activated by that task.
In the anatomical T1-weighted high resolution images, the basal ganglia were easy to identify, as they are deep
gray matter structures surrounded by white matter tracts. 3. Results
The head of the caudate nucleus is next to the ventral part
of the lateral ventricle of each hemisphere. The lentiform 3.1. Task performance nucleus is divided into the putamen and the external and
internal part of the globus pallidus. The borders of the All the five motor tasks described in Experimental triangle are the external capsule laterally and the internal Procedures were easily performed by all subjects. Visual capsule medially. We have chosen to refer to the lentiform online monitoring by one of the authors did not reveal nucleus rather than its components, as the spatial res- mirror movements during execution of the unilaterally olution of the fMRI images cannot always differentiate the performed tasks. Further, analysis of the results clearly external pallidum from medial putamen. The internal indicated that the pattern of activation in ipsilateral motor segment of the globus pallidus is readily distinguished cortex that would have been indicative of bilateral task
Table 1 3.2. Reliability of functional activation a
Basal ganglia activation summary
Task Number of % with Activation All the tasks produced functional activation in the basal studies basal ganglia Size ganglia, motor cortex, and supplementary motor area (right / left / both) activation (cc)
(Table 1). However the degree of non observable basal
Switching 41 97.4 2.060.1 ganglia activation varied from 10% to 30% across studies. (16 / 16 / 9) This occurred despite strong motor cortex activation.
Writing 33 90.9 1.960.2
Thalamus activation was observed in nearly all studies.
(12 / 12 / 9)
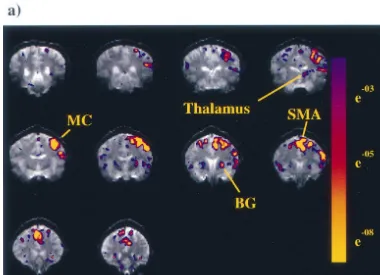
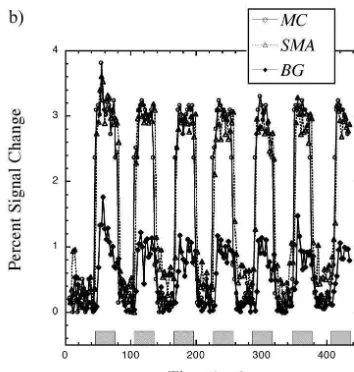
Representative activation maps are shown in Fig. 1 during
Finger tapping 45 75.6 1.160.1
(19 / 15 / 11) a switching task, along with an average time course from
Pronation 27 51.8 0.960.2 10 randomly chosen switching studies. Average percent (9 / 9 / 9) signal change across subjects was larger in motor cortex
Eye movements 16 93.7 1.060.1
(|3%) and in SMA (|3%) than in basal ganglia (|1%),
a
Number of studies are listed by whether they were performed with the this was consistent thorugh all five tasks. right side, left side, or both sides of the body. Percent of studies with
While all the tasks invariably produced primary motor
basal ganglia activations excludes null or artifactual activation. Artifactual
cortical activation, which varied in location according to
activations are described in text, and were eliminated from further
the well known motor homunculus, the basal ganglia and
statistical analysis. Null activations are defined as no detectable activation
in basal ganglia in the presence of robust motor cortical activation. the SMA occasionally showed no activation. We studied Activation size in basal ganglia is determined as described in Experimen- reproducibility by repeating the same tasks in the same tal procedures.
subjects 2–8 times on different days. We then measured the average percent deviation (defined as the standard devia-tion of the number of activated pixels divided by the total unilateral task performance. This was readily checked by number of activated pixels) for each task in basal ganglia, comparison of the motor cortex during bilateral task motor cortex and SMA (Fig. 2). Variability in motor cortex
performance. was substantially smaller than in SMA or basal ganglia.
3.3. Left hemispheric dominance of basal ganglia activation
We systematically compared laterality for all five tasks while subjects performed tasks with left, right, or both hands. Representative maps of activation in motor cortex, SMA and basal ganglia are shown for single subjects performing three tasks (Fig. 3). It is clear that there is activation bilaterally for the performance of the unilateral task, and this was consistently observed in both cortex and LN.
More remarkably, there is a marked tendency towards left hemispheric dominance that is much more pronounced for basal ganglia than for motor cortex. Rather than showing the expected contralateral dominance, in all tasks except the supination / pronation task, average activation was larger in the left basal ganglia than in the right basal
Fig. 1. (continued )
ganglia, regardless of which side the task was performed on. This was not true for primary motor cortex, where the expected contralateral dominance pattern was noted, albeit This is not solely due to the larger signal change in motor with a larger degree of left hemisphere activation overall. cortex, as the percent signal changes in SMA were as large The data for individual tasks are listed in Table 2. The as those in motor cortex (about 3%). The inter-subject degree of left hemispheric dominance varied somewhat percent deviations over all tasks were 56.6 and 55.1% in across tasks, but was seen whether or not the task involved basal ganglia and SMA respectively, significantly different language. The motor cortex activation also controls for from the 23.0% seen in motor cortex (P,0.02 and 0.01, task performance, as the total amount of primary cortical respectively). The intra-subject percent deviations over all motor activation was not significantly different when the tasks were 26.4 and 21.5% in basal ganglia and SMA subjects were performing the tasks with the left or the right compared to 7.2% in motor cortex (P,0.001 and 0.002, side (Table 2). Fig. 4 shows the relative activations by all respectively). Not surprisingly, inter-subject variabilities tasks, for all subjects, combined, clearly demonstrating that were always larger than the intra-subject variabilities. Fig. the left dominance of LN activation. A matrix of statistical 2 shows that the switching and writing tasks activated the comparisons of these tasks is also shown in Fig. 4. lentiform nucleus with the least variability. There was also, Tasks performed with both sides also showed this left in 8% of the studies, what we believe to be artifactual hemispheric dominance pattern (Figs. 4 and 5). Again, activation, discussed elsewhere [29]. there was a tendency for a small increase in left motor
Table 2
Hemispheric dominance and bilaterality for basal ganglia and motor a
cortex activations
Task Right / left Right1left
hemisphere hemisphere
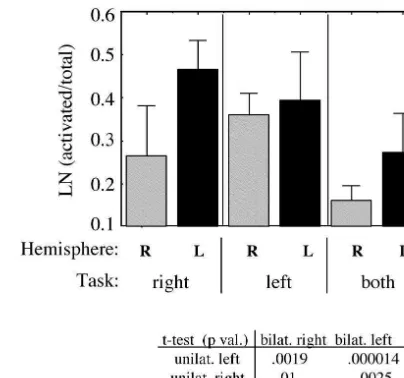
Fig. 4. Left hemisphere dominance and bilateral interactions in basal
Left 1.30 0.90 1003 456
ganglia activation. Bars show the average ratio (6std. dev.) of activated to total lentiform nucleus volume, for left and right hemispheres during Supination /pronation
all tasks, for all subjects, done with the left side, right side, or bilaterally.
Both 0.98 0.81 1664 243
Bilateral task performance causes a suppression of basal ganglia
activa-Right 0.45 0.43 1301 570
tion compared to unilateral performance. Basal ganglia activation is
Left 1.82 1.43 1339 455
strongest in the left hemisphere, regardless of the task side. A table of P values are given for left–right comparisons.
Eye movements
Both 0.84 0.77 1137 387
a
MC5motor cortex activation; LN5lentiform nucleus activation. The tion discussed above, we made a completely unexpected left-most column lists the side of the body with which the task was finding. In the majority of studies basal ganglia activation performed. Right / Left5ratio of right hemisphere to left hemisphere
performed unilaterally elicited larger activation than that
activation (ratios ,1 imply left hemisphere dominance); R1L5total
produced bilaterally. This was clearly not the case for
number of pixels activated. Activation ratios for tasks performed with the
left side of the body are in bold font to emphasize the increased left motor cortex, where the total activation produced for
hemisphere dominance for the lentiform nucleus compared to the motor bilateral activation (summing both hemispheres) was larger cortex. Total LN activations for tasks performed bilaterally are in italics for bilateral tasks than for unilateral tasks (Table 2). This to emphasize the decreased activation compared with unilaterally
per-observation was remarkably consistent for all tasks. There
formed tasks. These comparisons were all highly significant via paired
was a difference between the tasks in the magnitude of this
t-test (see Fig. 3). For the purposes of this table null activations in basal
ganglia (see Table 1 and text) were not included in these data. effect (for instance very strong for the switching task and weaker for the writing task). Examples of the phenomenon are shown in Fig. 5 for the switching and signing tasks. A cortex activation compared to right motor cortex when summary bar graph, with very significant P values is performing tasks bilaterally, but this phenomenon was shown in Fig. 4 for all the tasks averaged together. As much more pronounced in basal ganglia (Table 2). The left mentioned above, left hemispheric dominance was still hemispheric dominance was observed for all tasks, even seen when tasks were performed bilaterally.
the eye movement task. We note that these measurements
are direct correlates of motor ‘handedness’. Although only 3.5. Somatotopy of the basal ganglia two subjects were identified as left-handed on the Oldfield
Fig. 5. Decreased basal ganglia activation with bilateral task performance. Significance maps are shown for four slices representing the basal ganglia and primary motor cortex regions for the switching and writing tasks performed bilaterally. Note the smaller activations in putamen compared to the unilateral activations shown in Fig. 2 even though the motor cortical activations are similar in size (see also Table 2).
the total activated volumes in lentiform and caudate nuclei 4. Discussion
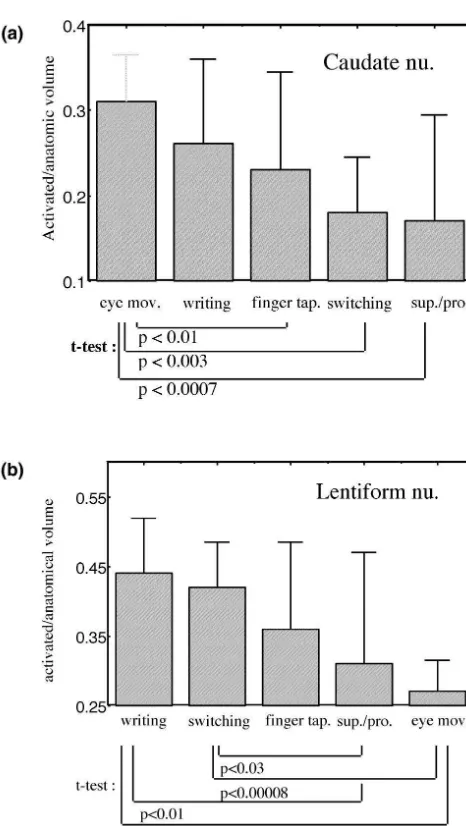
from all the subjects is shown in Fig. 7. Eye movements
produce the largest caudate activation and the least len- Our results demonstrate reliable activation of the basal
tiform activation. ganglia by movement tasks in single subjects, with a signal
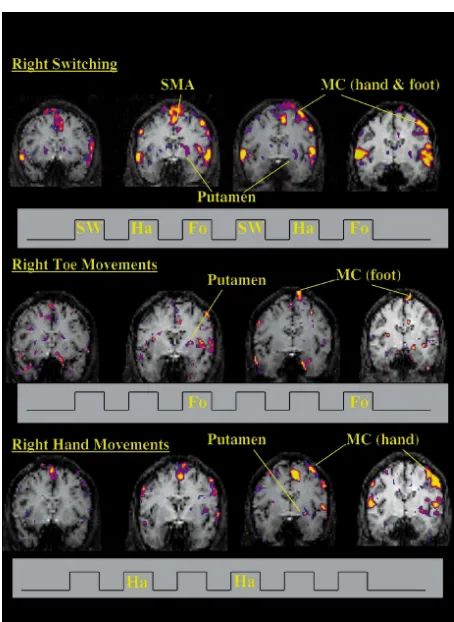
To study somatotopy in the putamen, we analyzed the change of about 1% (Fig. 1). three image slices covering the lentiform nucleus, and
distinguished between dorsal and ventral lentiform
activa-tion. In this analysis only studies with good motor cortical 4.1. Hemispheric dominance activation were included, ensuring that the known motor
cortical somatotopy was obtained for each task. We Based upon prior reports of the left dominance of finger performed a somatotopic evaluation of all the tasks in all tapping in motor cortex [17] we wanted to investigate the subjects by dividing the basal ganglia activation along whether such a phenomenon held true for basal ganglia. the contiguous 7 mm slices as either anterior, medial or Our data reveal pronounced left hemispheric dominance posterior. Eye movements had the most anterior activation in the putamen during movement (Figs. 2 and 3; Table 2). whilst the other tasks had a more medial-posterior location. This is in distinction to the right caudate nucleus activation All lentiform activation was lateral, in what appeared to be seen during the learning of new tasks [1,16,27]. The motor lateral putamen, with little, if any, detectable pallidal activation asymmetry we saw in basal ganglia is even activation. Tasks with hand but not foot movement (writ- stronger than that in the motor cortex, where we found a ing, finger tapping and pronation) mostly activated the laterality index comparable to prior studies [6,17] (Table middle part of the lateral putamen. Toe movements 2). Cerebral lateralization is a common feature of human activated a region which was more dorsal and anterior, and language and motor function. Most right handed indi-the switching task, with both finger and toe movements, viduals have a left hemispheric dominant language and activated both regions. To illustrate the somatotopy the speech function. Very little is known about laterality of switching task was performed in an interleaved fashion in subcortical structures. In intact animals, striatal dopamine a single subject, with the component finger and toe levels are lower contralateral to paw preference and
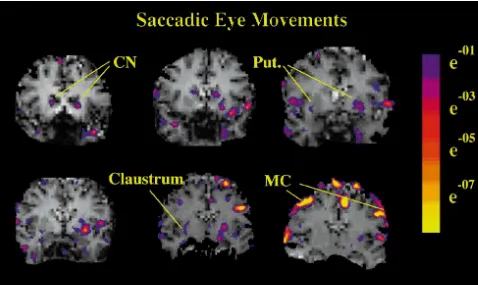
Fig. 6. Caudate nucleus activation by saccadic eye movements. Significance maps of six contiguous slices during saccadic eye movements in a single subject. Horizontal saccades produced bilateral caudate activation, as well as activation in the motor cortex, SMA, putamen, and claustrum. Note the left hemisphere dominance in basal ganglia but not motor cortex activation.
globus pallidus contains less dopamine and may be larger signal changes within lentiform nucleus compared to SMA
[11,18]. and sensorimotor cortex.
Kim et al. found left hemispheric dominance of the This smaller percent signal change may help explain primary motor cortex using fMRI and a sequential finger some of the variability noted in previous studies of the tapping. Because only a single slice was used in that study, basal ganglia [29]. There is still no task which reliably no data concerning subcortical structures were collected. detects activity within the lentiform nucleus or other areas Previous PET studies have not reported hemispheric of the basal ganglia on a single subject basis.
dominance in basal ganglia motor activation, perhaps
because of poor resolution or differing sensitivities of PET 4.3. Bilateral interactions blood flow versus fMRI BOLD measurements. In our
hands only the pronation task, the least reliable basal Our data showed strong bilateral activation of the basal ganglia activator, did not show the left hemispheric ganglia during performance of unilateral motor tasks. dominance. We saw left hemisphere dominance even in the Anatomical and electrophysiological techniques show that eye movement task. Further research is needed, however, whereas the motor cortex has weak bilateral projections to to determine if this left lateralization applies to all motor the striatum [10,19] (i.e. a predominant ipsilateral
map-activity. ping), much stronger bilateral projections exist from the
All except two of our subjects were right-handed as SMA to the striatum [31]. One possible implication of this assessed by the Oldfield inventory. As a side issue, we finding is that the projections from SMA to the striatum note that the fMRI provides a direct, objective, cerebral drive the metabolic response of the basal ganglia more measure of motor dominance compared to the handedness strongly than do those from primary motor cortex. Further inventories (i.e. the fMRI is closer to being a ‘gold support for this observation comes from correlations standard’ for hemispheric dominance [9]). between activation in SMA and basal ganglia and motor cortex. We found that there were strong correlations 4.2. Reliability and differences in percentage signal between the SMA and basal ganglia activation while those changes between SMA and basal ganglia with motor cortex were
not [29].
A possible explanation for this finding could be the hypothesis formulated by Mink and Thach about the role of the basal ganglia in motor control. According to these authors one aspect of basal ganglia function may be to suppress competing movements [21]. Thus, perhaps much of the task-related basal ganglia activation seen during unilateral tasks inhibits contralateral pathways. When the necessity of this inhibition is released by the bilateral tasks, the total activation goes down. If so, much of the putaminal blood flow increase seen by fMRI may be due to inhibitory synapses. This hypothesis suggests fertile ground for future study.
4.4. Somatotopy
It has been difficult to study basal ganglia somatotopy in humans. PET does not have high enough resolution, and intraoperative recording and stimulation are difficult in subcortical structures. Our fMRI techniques show that humans have the same foot-dorsal, hand-ventral somatotopy in the putamen that has been described in the primate literature (Fig. 8). Similarly, our data suggest that saccades in humans are represented primarily in the caudate nucleus (Figs. 6 and 7), as they are in other primates [13,24]. It is thought that the caudate nucleus helps initiate saccadic eye movements by releasing a tonic inhibition on the superior colliculus [5,14]. In a single previous report in humans, Petit et al. [25] described PET activation in the lentiform nucleus during saccadic eye movements. They classified their findings as components of the basal ganglia motor loop which passes through the putamen, in distinction to the oculomotor loop seen in other primates to pass predominantly through the caudate nucleus. Our results, in contrast, suggest that basal ganglia control of saccades is similar in humans and non-human
Fig. 7. Caudate and lentiform nucleus activation ratios by different motor
primates. Although there is also putaminal activation as
tasks. (a) Saccades activated the greatest proportion of the caudate
well, we see the predominant activation in the caudate
nucleus, pronation the least. (b) Writing and switching activated the
nucleus.
greatest proportion of the lentiform nucleus, pronation the least. Ratios
represent size of the activation divided by the anatomic size of the Most or all of the lentiform nucleus activation we saw
nucleus averaged together for all subjects. Error bars represent standard was in the putamen, not the pallidum. The resolution of deviations.
our 1.5 Tesla scanner did not allow us to completely rule out the possibility of activation in the external segment of unilateral tasks activate the basal ganglia more than the globus pallidus which is why we have referred to these bilateral ones do (Figs. 4 and 5). Work in primates suggests activations as occuring in lentiform nucleus. However, it the putamen receives inputs from contralateral motor was clear that there was no detectable activation of the cortex that interdigitate with, but are separate from, the internal segment of the pallidum. There are a number of stronger inputs from ipsilateral motor cortex [10]. One possible explanations. Perhaps only direct glutamatergic might predict from this interdigitation that activating both projections, from both SMA and motor cortex, can in-ipsilateral and contralateral motor cortex through a bilater- crease basal ganglia blood flow enough to produce detect-al motor task would activate more of the putamen than a able fMRI signal. Alternatively, perhaps the regional unilateral motor task would. In fact, however, we saw just cerebral metabolic rate of oxygen consumption increases in the opposite. Bilateral movements produced less activity in the internal globus pallidus during movement enough to either lentiform nucleus. This was not the case in motor ablate the increase in blood oxygen level. Another possi-cortex: with bilateral tasks, motor cortical activity was bility is that the high intrinsic iron content of the pallidum bilateral, robust, and larger than for unilateral tasks (Table may decrease the magnitude of the BOLD response.
detection and correction in functional MR imaging, Human Brain
be too small to create a measurable rCBF / BOLD response
Mapping 3 (1995) 224–235.
using a 1.5 T scanner. This question may be better
[16] M. Jueptner, C.D. Frith, D.J. Brooks, R.S.J. Frackowiak, R.E.
addressed at higher field strengths. Passingham, Anatomy of motor learning. II. Subcortical structures In conclusion, we have demonstrated that the activation and learning by trial and error, J. Neurophysiol. 77 (1997) 1325–
of the cortical-basal ganglia motor loop using fMRI 1337.
[17] S.G. Kim, J. Ashe, K. Hendrich, J.M. Ellermann, H. Merkle, K.
manifests a dramatic left hemispheric dominance, and
Ugurbil, A.P. Georgopoulos, Functional magnetic resonance imaging
shows evidence for inhibition by contralateral movements.
of motor cortex: hemispheric asymmetry and handedness, Science
Even at a field strength of 1.5 Tesla, spatial resolution is 261 (1993) 615–617.
high enough to demonstrate somatotopy similar to that of [18] C.A. Kooistra, K.M. Heilman, Motor dominance and lateral
non-human primates. Utilization of higher field strengths, asymmetry of the globus pallidus, Neurology 38 (1988) 388–390. [19] H. Kunzle, Bilateral projections from precentral motor cortex to the
or technical advances like phased array detection schemes
putamen and other parts of the basal ganglia. An autoradiographic
may enable us to achieve higher signal to noise ratios in
study in Macaca fascicularis, Brain Res. 88 (1975) 195–209.
order to probe the somatotopic mappings of the human [20] K.K. Kwong, Functional magnetic resonance imaging with echo
basal ganglia in further detail. planar imaging, Magn. Reson. Q 11 (1995) 1–20.
[21] J.W. Mink, W.T. Thach, Basal ganglia motor control. II. Late pallidal timing relative to movement onset and inconsistent pallidal coding of movement parameters, J. Neurophysiol. 65 (1991) 301–329.
References
[22] S. Ogawa, R.S. Menon, S.G. Kim, K. Ugurbil, On the characteristics of functional magnetic resonance imaging of the brain [In Process [1] G.S. Berns, J.D. Cohen, M.A. Mintun, Brain regions responsive to Citation], Annu. Rev. Biophys. Biomol. Struct. 27 (1998) 447–474. novelty in the absence of awareness, Science 276 (1997) 1272– [23] R.C. Oldfield, The assessment and analysis of handedness: the
1275. Edinburgh inventory, Neuropsychologia 9 (1971) 97–113.
[2] D.J. Brooks, The role of the basal ganglia in motor control: [24] H.B. Parthasarathy, J.D. Schall, A.M. Graybiel, Distributed but contributions from PET, J. Neurol. Sci. 128 (1995) 1–13. convergent ordering of corticostriatal projections: analysis of the [3] P. Brown, C.D. Marsden, What do the basal ganglia do?, Lancet 351 frontal eye field and the supplementary eye field in the macaque
(1998) 1801–1804. monkey, J. Neurosci. 12 (1992) 4468–4488.
[4] S. Cabib, F.R. D’Amato, P.J. Neveu, B. Deleplanque, M. Le Moal, [25] L. Petit, C. Orssaud, N. Tzourio, G. Salamon, B. Mazoyer, A. M. Puglisi, Paw preference and brain dopamine asymmetries, Berthoz, PET study of voluntary saccadic eye movements in Neuroscience 64 (1995) 427–432. humans: basal ganglia-thalamocortical system and cingulate cortex [5] G. Chevalier, J.M. Deniau, Disinhibition as a basic process in the involvement, J. Neurophysiol. 69 (1993) 1009–1017.
expression of striatal functions, Trends Neurosci. 13 (1990) 277– [26] N. Picard, P.L. Strick, Motor areas of the medial wall: a review of
280. their location and functional activation, Cerebral Cortex 6 (1996)
[6] S.C. Cramer, G. Nelles, R.R. Benson, J.D. Kaplan, R.A. Parker, 342–353.
K.K. Kwong, D.N. Kennedy, S.P. Finklestein, B.R. Rosen, A [27] S.L. Rauch, P.J. Whalen, C.R. Savage, T. Curran, A. Kendrick, H.D. functional MRI study of subjects recovered from hemiparetic stroke, Brown, G. Bush, H.C. Breiter, B.R. Rosen, Striatal recruitment Stroke 28 (1997) 2518–2527. during an implicit sequence learning task as measured by functional [7] M.D. Crutcher, M.R. DeLong, Single cell studies of the primate magnetic resonance imaging, Human Brain Mapping 5 (1997) 124–
putamen. I. Functional organization, Exp. Brain Res. 53 (1984) 132.
233–243. [28] P.E. Roland, K. Zilles, Functions and structures of the motor cortices [9] D.B. FitzGerald, G.R. Cosgrove, S. Ronner, H. Jiang, B.R. Buchbin- in humans, Curr. Opin. Neurobiol. 6 (1996) 773–781.
der, J.W. Belliveau, B.R. Rosen, R.R. Benson, Location of language [29] V.H. Scholz, B.G. Jenkins, J.R. Keltner, K.K. Kwong, B.R. Rosen, in the cortex: a comparison between functional MR imaging and Comparison of different motor tasks for fMRI studies of the basal electrocortical stimulation, Am. J. Neuroradiol. 18 (1997) 1529– ganglia: Reproducibility Specificity and Artifacts, Proceedings
Inter-1539. national Society of Magnetic Resonance in Medicine, 4th Meeting,
[10] A.W. Flaherty, A.M. Graybiel, Two input systems for body repre- New York, NY, 1996, p. 446.
sentations in the primate striatal matrix: experimental evidence in [30] D.F. Sobel, C.C. Gallen, B.J. Schwartz, T.A. Waltz, B. Copeland, S. the squirrel monkey, J. Neurosci. 13 (1993) 1120–1137. Yamada, E.C. Hirschkoff, F.E. Bloom, Locating the central sulcus: [11] S.D. Glick, D.A. Ross, L.B. Hough, Lateral asymmetry of neuro- comparison of MR anatomic and magnetoencephalographic func-transmitters in human brain, Brain Res. 234 (1982) 53–63. tional methods [see comments], Ajnr. Am. J. Neuroradiol. 14 (1993) [12] I. Gordon, M. Rehavi, M. Mintz, Bilateral imbalance in striatal 915–925.
DA-uptake controls rotation behavior, Brain Res. 646 (1994) 207– [31] M. Wiesendanger, E.M. Rouiller, O. Kazennikov, S. Perrig, Is the
210. supplementary motor area a bilaterally organized system?, Adv.
[13] O. Hikosaka, M. Sakamoto, S. Usui, Functional properties of Neurol. 70 (1996) 85–93.
monkey caudate neurons. III. Activities related to expectation of [32] T.A. Yousry, U.D. Schmid, H. Alkadhi, D. Schmidt, A. Peraud, A. target and reward, J. Neurophysiol. 61 (1989) 814–832. Buettner, P. Winkler, Localization of the motor hand area to a knob [14] O. Hikosaka, R.H. Wurtz, Modification of saccadic eye movements on the precentral gyrus. A new landmark, Brain 120 (1997) 141–
by GABA-related substances. I. Effect of muscimol and bicuculline 157. in monkey superior colliculus, J. Neurophysiol. 53 (1985) 266–291.