An exploratory study on the emergence of management
control systems: formalizing human resources in
small growing firms
Tony Davila
*Graduate School of Business, Stanford University, Stanford, CA 94305-5015, USA
Abstract
The adoption of management control systems (MCS) is a key element in managing the tension that growth imposes on young growing firms. Despite its importance to a large number of organizations, only recently has the empirical literature devoted attention to the evolution of these systems over the lifecycle of firms [Moores and Yuen, Account. Organizat. Soc. 26 (2001) 351]. This paper builds upon existing management control theory, mostly focused on established organizations, and existing predictions based on extended field observations to explore how these systems are adopted within growing firms. To advance theory, the paper also draws from the entrepreneurship and life cycle literatures. It identifies several variables as drivers of the emergence of management control systems including the size of the organization, its age, the replacement of the founder as CEO, and the existence of outside investors. The empirical evidence, from a database on the adoption of human resource management systems, is consistent with these variables being associated with the adoption of MCS. The paper also provides initial results on how the emergence of various types of management control systems depends on which systems the organization has already adopted.
Ó2004 Elsevier Ltd. All rights reserved.
Introduction
Existing research taking an organizational view of management control systems (MCS) focuses mostly on the population of medium and large firms where formal systems have long been estab-lished and play a major role in structuring the organization and implementing strategy (Lang-field-Smith, 1997; Luft & Shields, 2003).
More-over, the typical research design approaches the study of MCSfrom a cross-sectional perspective rather than taking a longitudinal view.1 Over time, this literature has developed a rich set of variables to explain the cross-sectional variation among different types of MCSas well as among
*
Corresponding author. Tel.: 724-50-60; fax: +1-650-725-04-68.
E-mail address:[email protected](T. Davila).
1Papers that have taken a longitudinal design include Jones
(1985) and Kober, Ng, and Paul (2000) who use field research to study the redesign of management control systems in processes of organizational change. Also a different line of research has examined causality in management control systems through experiment-based research designs (Fisher, Maines, Peffer, & Sprinkle, 2002; Webb, 2002).
0361-3682/$ - see front matterÓ2004 Elsevier Ltd. All rights reserved. doi:10.1016/j.aos.2004.05.006
Accounting, Organizations and Society 30 (2005) 223–248
the characteristics of these systems (Hartmann, 2000; Shields & Shields, 1998). The theoretical underpinning, rooted in contingency (Chapman, 1997; Chenhall, 2003) and agency theories (Bai-man, 1982) has emphasized a static, cross-sectional view of organizations.
However, an important transition point in the life of organizations that is receiving increasing attention is the emergence of MCS(Sandino, 2004). Lack of professional management tools such as MCShas been argued to restrain growth and even to cause the failure of firms (Greiner, 1972, 1998). MCSare important to organizational growth (Flamholtz & Randle, 2000); they liberate top managers’ attention from processes that can be controlled by exception and provide them with information when their informal network is over-loaded. Thus, understanding how this transition happens is an important research and managerial question. This transition point, when companies move from an informal management approach to the need for formal management tools, is most visible in the population of small growing firms.2 Growing companies are faced quickly with the tensions associated with informal processes and the challenge of successfully mastering the transition into formal control systems. At this point, the dy-namic process of transitioning from an informal management to the development of MCSbecomes critical to the success of these organizations. So far, our understanding of how these systems emerge in growing firms is captured through experience-based models (Flamholtz & Randle, 2000; Greiner, 1972, 1998; Simons, 2000). Based on life cycle models (Kazanjian & Drazin, 1989; Miller & Frie-sen, 1984) of the firm, recent research (Moores & Yuen, 2001) empirically identifies the growth phase in the life cycle of an organization as the phase when MCSbecome important to management.
The objective of this paper is to extend current theory and examine empirically variables that are predicted to be associated with the emergence of
MCS.3 This exploratory study focuses on those systems associated with human resource manage-ment in high-technology firms. Managing human resources is likely to be one of the most challenging tasks that small growing firms face and where MCS may have an earlier role. While not exhaustive of all management control systems in an organization (therefore, the results cannot be generalized to any MCS), systems that are used to manage organiza-tional culture, evaluate and reward employees, and code organizational processes capture a significant and important part of MCSin small growing firms. Moreover, focusing on a subset of MCSallows triangulating the data among different respondents knowledgeable of these systems, in particular CEOs and people knowledgeable about human resource practices. This triangulation has the objective of increasing the reliability of the data at the expense of reducing the scope of MCSthat could have been examined, given the knowledge of the managers interviewed. Because firms typically face similar challenges in managing human re-sources, focusing on these systems allows cross-sectional comparability. While focusing on a subset of MCSlimits extrapolation of the results beyond theoretical generalizability (Yin, 1989), previous work has taken this approach given of the benefits associated with it (Abernethy & Lillis, 1995; Ger-din, forthcoming).
Because the study relies on the experience of respondents regarding the adoption of MCS, the sample criteria include achieving a certain size over a relatively short period of time. Moreover, given the field nature of the research project a geo-graphical criterion was also imposed. Most of the firms that meet these three criteria are in the high-technology industry, an industry that because of the dynamism associated with it has been an important research field (Burgelman, 2002), and
2
The phenomenon, which is driven by small organizations outgrowing informal management processes, may also be observed within departments of medium and large firms.
3An important line of research studies the relevance of
the sample was gathered within this industry to control for potential omitted variables at the ex-pense of limited generalizability of results (Yin, 1989).
The rest of the paper is organized as follows. The second section develops the theory behind this exploratory study. Predictions are grounded on existing knowledge in the management control systems and entrepreneurship literatures and variables that existing models of the emergence of MCShave identified (Flamholtz & Randle, 2000; Greiner, 1972, 1998; Simons, 2000). The third section presents the research design. The study is based on a rich database (Baron, Burton, & Hannan, 1996, 1999) that includes survey as well as interview information on the human resource practices of a large sample of young, high-tech-nology firms. The fourth section presents the re-sults. The results indicate that both size and age affect the emergence of MCSfor human resource management. However, the impact of age de-creases with firm size. The evidence is also con-sistent with the presence of venture capital and the replacement of the founder by a new CEO affect-ing the emergence of these systems. Further evi-dence indicates that the replacement of the founder is mostly significant for smaller firms. Finally, the paper provides evidence on how existing control systems affect the adoption of new ones, and which particular systems are adopted earlier. The fifth section suggests future research and concludes.
Theoretical framework
Various lines of research provide guidance to inform explanations of the emergence of manage-ment control systems including: experience-based models (Flamholtz & Randle, 2000; Greiner, 1972, 1998; Simons, 2000), the entrepreneurship litera-ture (Bhide, 1999; Covin & Slevin, 1997), and contingency research in MCS(Bruns & Water-house, 1975; Chenhall, 2003; Govindarajan, 1988; Otley, 1980). The current study combines the concepts and relationships outlined in these lines of research in order to understand the emergence of MCS, and empirically explores variables that
are predicted to affect this phenomenon.4 In bringing these different literatures together, the paper explicitly develops new theoretical argu-ments that are needed to explore a research ques-tion in a field in its early phases, where evidence is still emerging (Sandino, 2004).
The empirical study explores the association between certain variables and the emergence of MCS––a ‘‘selection’’ approach within the contin-gency theory framework (Drazin & Van de Ven, 1985)––in an effort to explain why these systems are adopted. It does not address how this associ-ation affects the performance of the organiza-tion––an interaction or ‘‘fit’’ approach. The research design is based on a longitudinal database of companies transitioning from the birth to the growth stage (Miller & Friesen, 1984), where the phenomenon is more likely to be of relevance. Recent research supports this focus and indicates that the emergence of MCSis most important for organizations moving through their growth stage (Moores & Yuen, 2001), when coordination and control problems cannot be solved through infor-mal interaction (as happens during the birth stage). These authors conclude: ‘‘Growth firms. . .
pay particular attention to increasing the formality of their management accounting systems’’ (p. 351).
Conceptualization of management control systems for human resource management
This study defines management control systems as ‘‘the formal, information-based routines and procedures managers use to maintain or alter patterns in organizational activities’’ (Simons,
4The variables identified in this section are structural
variables in that they reflect changes in the firm environment. Another set of variables that have been suggested to drive the emergence of MCSis event variables. For example, Simons states that MCSmay be adopted as reaction to ‘‘breakdowns in control . . . Errors, bad decisions, missed opportunities’’ (p. 309). Organizational redesign may also be due to performance crisis (Tushman, Newman, & Romanelli, 1986). The focus of the study is the structural variables described; however, the role of these events as drivers of MCSadoption is an open research question. See also the discussion in the conclusions’ section for a further elaboration on alternative variables.
1994, p. 5). Theory offers several alternatives to further classify these systems (Anthony, 1988; Simons, 1994). For the purpose of this research, the typology initially proposed by Thompson (1967) and Ouchi (1979) and significantly refined by Merchant (1985, 1998) is used. This typology provides several advantages for this study. First, it is not limited to large organizations and its rich-ness can be exploited within small growing orga-nizations. Second, it can be applied to a subset of control systems and, in particular, to systems for human resource management.5 Finally, the defi-nitions of the various control processes in this typology are specific enough to map practices into it.6
The typology identifies three different control mechanisms7 labeled, according to the most re-cent formulation by Merchant (1998), as:personnel control––mechanisms that influence organizational actors by aligning their personal objectives with those of the organization;action control ––mecha-nisms that influence organizational actors by pre-scribing the actions they should take; and results control––mechanisms that influence organizational actors by measuring the result of their actions.
Drivers of the emergence of MCS––size
Size has been found to explain cross-sectional variation among the design of MCS(Merchant, 1981), the survival of young firms (Hannan & Freeman, 1989) and is the basis for organization life cycle models (Kazanjian & Drazin, 1989). Within the experience-based models of emergence
of MCS, size is proposed as a driver in all cases8 (Flamholtz & Randle, 2000; Greiner, 1972, 1998; Simons, 2000, p. 310). In the early stages of a company, control and coordination happens through frequent and informal interactions. As the company grows, its attention shifts to developing systems that anchor informal interactions around a set of formalized systems. The relevance of size is linked to the increasing costs of governance asso-ciated with an informal approach to management. Informal management requires direct contact among employees; but as the number of people increases, the number of possible interactions among organizational members increases much faster. 9 If these interactions drive coordination and control costs, then the efficiency of an infor-mal management rapidly decreases with size (Bhide, 1999, Chap. 10). Because communication and control happen through direct contact, orga-nizational members need to allocate an increasing amount of time to maintaining an increasing number of interactions. This time is divested from potentially more value-added activities. To regain efficiency in managing the organization, coordi-nation and control mechanisms are formalized with the objective of coding and documenting organizational learning (Ditillo, forthcoming; Le-vitt & March, 1988) and reducing the demand that routine activities impose on the management team’s time. Size may also reflect increasing com-plexity not only through the interaction among participants and the need for differentiation and integration (Lawrence & Lorsch, 1967), but also through the complexity associated with new mar-kets and new products (Mintzberg, 1979). These arguments suggest a positive association between size and the adoption of MCS.
5Previous research using this typology has successfully used
it to analyze the control process within specific functions rather than at the company level (Rockness & Shields, 1988).
6Sandino (2004) proposes a different typology of
manage-ment control systems in young firms based on whether their objective is to inform about revenues, costs, or risks.
7The word ‘‘mechanism’’ is used to reflect the fact that this
typology is not restricted to formal control systems and can also include informal mechanisms. To make this distinction, ‘‘mech-anism’’ includes both formal and informal procedures, while ‘‘systems’’ refer to formal mechanisms only.
8The arguments in these models are based on cause–effect
relationships, however the empirical tests in the current study are tests of association and not causality and the results should be interpreted with this caveat in mind. The paper refers to the variables that these models predict as affecting the emergence of MCSas ‘‘drivers.’’ The use of this term is related to the evolutionary perspective and the causal association that these models adopt. It should not be interpreted as suggesting that the results of the paper prove causality.
9
The previous arguments are valid for MCS interpreted as homogenous systems. However, Merchant’s framework allows more detailed argu-ments regarding differential impact of size upon management systems. To the extent that these arguments are empirically confirmed, the assump-tion of homogenous systems that underlies the testing of MCSas a whole becomes less valid and the empirical results at this level less informative.
In small firms, personnel control are imple-mented informally. Frequent interactions allow new employees to absorb the culture of the orga-nization, acquire the knowledge required to execute their job, and communicate their ideas to man-agement. As the organization grows, the forces that undermine informal management outlined in the previous paragraphs lead to the formalization of personnel control. Formal personnel control in-sures that new employees receive proper introduc-tion to the company’s culture (rather than relying on processes that happen through informal inter-actions) and current employees are periodically reminded of organizational objectives. These sys-tems are most salient in human resource manage-ment systems that are important levers to manage organizational culture. Thus, size is expected to be associated with personnel control systems.
Size also drives the need to codify organizational processes through action control systems; in par-ticular, processes within the human resource func-tion benefit from formalizafunc-tion because they clarify expectations, facilitate coordination, and simplify control through organizational rules and employee roles. However, action control systems have also been associated with internal controls (Merchant, 1998) that have argued to be the only formal con-trols required from the start of a firm (Simons, 1994). If this is the case, then action control systems are in place from the founding of the firm and therefore their adoption unrelated to size.
Finally, size is also expected to affect the for-malization of results control. Smaller firms rely on the judgment of the founder to distribute rewards (both social and economic); moreover, the moti-vation of initial employees may be close to that of the founder; however, as the organization grows, the founder is less likely to be able to have enough information to evaluate every employee, new
employees may put more weight on tangible re-wards and systems are formalized to provide these rewards. Thus, size is expected to be associated with the formalization of results control.
Drivers of the emergence of MCS––age
The second variable that has been argued to drive the emergence of MCSis age (Greiner, 1972, 1998). Age has been found to be associated with the likelihood of survival, where older firms are more likely to survive than their younger coun-terparts (liability of newness) (Hannan & Free-man, 1989). Age acts through the learning that accrues from experience in a way similar to the mechanisms that govern the learning curve. Even if the company is not growing, learning about management can be translated into improved MCS. Learning requires experience, experimenta-tion, and interaction with other firms that can only be acquired over time as processes are executed again and again until a dominant design is chosen. Management control systems then emerge to for-malize this learning by codifying routines and liberating management attention from repetitive tasks. The process is similar to enactment, selec-tion, and retention processes (Weick, 1979), where organizations experiment with different alterna-tives (variation), select one, and develop mecha-nisms to retain the alternative chosen. If MCS facilitate the process of management, age will be related to their emergence. 10
Routines, as part of action control systems, have traditionally been interpreted as repositories of organizational learning (Howard-Grenville, 2002; Nelson & Winter, 1982) and the arguments in the previous paragraph apply to action control. Initially, organizational members experiment with different ways of executing processes until a satis-factory solution is found, which is then codified.
10Age may not have a linear relationship with the emergence
of MCS(Luft & Shields, 2003). While age may initially be associated with learning, as firms become older they may also become set in their operating ways and unable to change. I appreciate one of the reviewers for pointing out this potential non-linearity.
This argument suggests that age is associated with action control.
Codification may also play a role in personnel and results controls. Over time management may experiment with different approaches to align the motivation of employees and manage the culture and with different ways of rewarding results. This experimentation, following the learning arguments developed in the previous paragraphs, then leads to the formalization of these systems. However and in contrast to the relevance of this learning-codification argument to action control, personnel and result controls do not necessarily formalize learning as routines do. Rather they may be interpreted as systems that are adopted to solve a pressing challenge, such as loosing employees be-cause the culture was not well communicated to them or because they did not get the appropriate economic incentives. If the emergence of these systems is unrelated to learning and are adopted because of reasons other than age, then we do not expect age to be associated with them.
The previous two variables (age and size) may interact to increase the probability of emergence of MCS. In particular, the learning that accrues with age may not be relevant to smaller companies where informal communication and control may be more effective than formal MCS. For these smaller firms, the costs of formalization outweigh their benefits. Even if the experience that these firms have accumulated would facilitate the emergence of MCS, their size does not require this step. Thus, the arguments developed in the previous paragraphs may depend on the size of the organization.
Drivers of the emergence of MCS––new CEO
In addition to size and age, the replacement of the founder has been identified as a critical event in moving from an informal organization to an organization that formalizes its processes (Greiner, 1972, 1998). The argument is based on the psy-chological characteristics of entrepreneurs being unsuited to manage a more formalized organiza-tion. Greiner (1998) indicates that ‘‘[the founders] are probably temperamentally unsuited to be managers’’ (p. 61). The need to replace founders with professional managers is echoed in Flamholtz
and Randle (2000) as well as in the entrepreneur-ship literature (Chandler & Jansen, 1992; Willard, Krueger, & Feeser, 1992). This literature suggests that personal characteristics of most entrepreneurs are well suited for the uncertain environment of a young startup; but these same characteristics are ill-suited to the management of a more structured and larger organization (Mintzberg, 1973).11
The limitations of the founder to move from an entrepreneurial to a managerial role (Mintzberg, 1973) are likely to be more relevant for personnel control. Because entrepreneurs have a vision of where they want to lead to company and the ori-ginal team shares this vision, they are more likely to disregard the need to manage the motivation of new employees under the assumption that everybody joins the company for its vision. Their leadership, charisma or the promise of the business model takes care of the culture of the organization and therefore personnel control systems are not needed. Only when a new CEO joins the company, the need for these systems is realized and they are put in place.
In contrast, the need for action control emerges because of the need to formalize learning or organize business processes and therefore is more likely to be unrelated to the management style of the entrepreneur. Unless entrepreneurs are unable to establish processes or allow their development, action control systems are adopted because of business needs and therefore unrelated to the turnover in the CEO position.
The effect of CEO turnover on results control depends on the balance of the arguments that have been developed for personnel and action controls. On the one hand, results control systems are associated with motivation and as such the entre-preneur may not give them appropriate weight because of the arguments developed for personnel control. On the other hand, the needs associated with a growing business lead to result control much in the same way as action control does; for
11The argument does not suggest that all founders are
instance, new employees not sharing the vision will demand clear accountability goals.
Much in the same way as size may interact with age, the effect of CEO turnover may be more important to management control systems in smaller companies. Larger firms may already have adopted the MCSthat they need and the change in CEO position is unrelated to the ability of this person to grow the company. In contrast, smaller firms lack MCSand the replacement of the CEO may be more relevant to the emergence of MCS. Moreover, this argument may not only hold for personnel control but also for action control. In particular, smaller firms that replace the CEO may do so because the person is unable to organize the company and enable the development of processes required to grow the firm. In other words, replacement of the CEO in smaller firms may re-flect the lack of ability of the CEO to establish action control.
Drivers of the emergence of MCS––venture capital
A final variable that has been found relevant in the entrepreneurship literature to explain the level of professional management in growing firms is the presence of professional funding in the com-pany’s financial structure and, in particular, ven-ture capital (Hellmann & Puri, 2002).12 Existing evidence indicates that venture capitalists are not simply suppliers of financial resources, but also
facilitate access to a network of knowledge and resources (Sapienza, Manigart, & Vermeir, 1996; Robie, Wright, & Chiplin, 1997). Through their investments, venture capitalists develop a signifi-cant knowledge about growing firms that they can share with the firms that they invest in, thus accelerating their development. If MCSare important to the success of a growing firm, then venture capitalists will encourage their develop-ment in a timely fashion.
The specific demands on information disclosure that venture capitalists require may also lead to faster implementation of result control. Venture capitalists have a financial interest on the firm and as such they are interested in aligning the moti-vation of employees with the financial success of the firm––through financial and non-financial objectives, which happens through results control. The effect of venture capitalists on personnel and action control is uncertain. On the one hand, venture capitalists may encourage their adoption because they believe them to be important for the well functioning of the organization and its suc-cess. If this is the case, venture capitalists demand companies that they invest in to have these pro-fessional tools. On the other hand, personnel and action controls are further removed from the governance structure of the organization––in par-ticular the board of directors where these investors seat––compared to compensation decisions and organizational goals’ approval, which are associ-ated with results control. Unless venture capitalists spend significant amount of time at the companies, they may be unable to affect how personnel and action control systems are structured.
Research design
Research data
The sample for this study contains 95 small, young, technology-oriented firms in California’s Silicon Valley. The focus on small, young, high technology firms allowed the selection of a large enough homogenous sample within geographical reach and likely to be transitioning into a stage where MCSare needed. While a homogenous sample limits the threat of potential confounding
12
Venture capital is a form of financing where venture capitalists (financing intermediaries) provide cash to the com-pany in exchange for a portion of the equity. Given the uncertainty that characterize young companies (Venkataraman, 1997), venture capital tends to be the only professional long-term financing that these companies get before they go public (Gompers & Lerner, 1999). Therefore, the argument for this hypothesis is stated around venture capital following the focus of the entrepreneurship literature and the evidence that this type of capital is typically the only professional funding that these companies get. If alternative professional sources of funds are important, then the research design decision around using venture capital would decrease the power of the study. An alternative relevant funding event is the IPO; tests (not reported) indicate that this event is not significant in the sample examined.
effects, the results can only be extended to non-tech firms through theoretical generalization (Yin, 1989).13 The database combines qualitative and quantitative information on how these firms for-malized practices to manage human resources through the development of management control systems. These systems are not exhaustive of all systems in an organization. However, systems to evaluate and reward employees, manage organi-zational culture, and code certain organiorgani-zational processes (within the human resource function) capture a significant and important part of MCS in small growing firms. Focusing on a subset of management control systems allowed triangulating the data among different respondents knowledge-able of the human resource management systems. This research design decision increases the reli-ability of the data at the expense of reducing the scope of MCSexamined. Thus, the findings only apply to this subset of MCSand further general-izations should be made with the appropriate caveats.
As previously mentioned, the firms included in the sample are young firms (at most 10 years old when the project started), but with more than 10 employees (to exclude firms too small to have any formal processes). The sample includes at most 10 years of information per company even if, given the periodic updating of the database, additional information is available for some firms.14 This cut-off gives enough observations within each single year (the minimum being 45 observations in the 10th year). The initial list of companies was gathered from three different sources of firms in the Silicon Valley: Rich’s Everyday Sales Pros-pecting Guide, Technology Resource Guide to
Greater Silicon Valley, andSilicon Valley Business Press. The sampling procedure excluded foreign firms; it also grouped firms according to size and then larger firms were over-sampled relative to smaller firms. This stratified sampling procedure was intended to capture larger firms where pro-fessional management tools are more likely to have been adopted. The data was gathered through interviews with different managers in each of these firms including founders, CEOs, and managers knowledgeable about the human resource practices of their firm. The interviews were semi-structured with a clear set of questions to be explored; addi-tional archival information describing the history of the firm was gathered when available during these interviews. Before the interviews were con-ducted, several key informants were asked to fill out different surveys. These surveys included information on the timing of adoption of different MCSrelated to human resource management, 15 size of the company, and date for critical events including founding date, replacement of CEO, and venture capital funding received. The questionnaire was reviewed during the interview process to insure that all the information was appropriately cap-tured. Interviews were used, among other pur-poses, to identify the strategy of the firm. The information on each company was supplemented with any additional public information available. Even if the database has various characteristics that make it unique to the purposes of this paper, it is subject to the recall and respondent biases associated with survey and interview data as well as to a potential survivorship bias, because only existing firms were sampled.
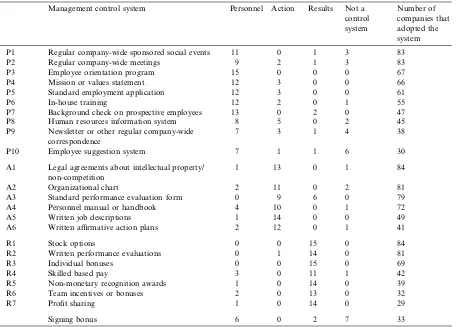
Table 1 presents the various MCSin the database that were adopted by at least 25 firms in the sample. Baron et al. (1996) provide a de-tailed analysis of the individual evolution of each of these systems. Merchant’s typology (previ-ously described) is used to classify the various systems captured in the questionnaire. Because
13The study builds upon a larger research effort initiated in
1994 known as the Stanford Project on Emerging Companies (SPEC) (Baron et al., 1996, 1999; Burton, 1996; Hellmann & Puri, 2002). The broad focus of this research project is the impact of the founders’ model of organizing on the human resource practices in growing firms including managerial intensity, employment systems, gender mix, inertia and change, and turnover.
14The project went back to the companies on a periodic
basis until 1998. The 10-year period of data for each company ends between 1994 and 1998 depending on whether the company was already 10 years old in 1994.
15The survey asked respondents to provide the date when a
the actual design of each MCSmay rely on a weighted combination of the three types of control that Merchant identifies, mapping the systems into the typology involves a certain de-gree of subjectivity. To address this concern and map these systems into the typology, the fol-lowing procedure was used.16 Fifteen professors
knowledgeable about MCS––either through their research or their teaching––were contacted. Each one was asked to classify each of the 23 man-agement control systems in the database into the type of control that best reflected the control process of the system (or into the category ‘‘not a control system’’). The kappa statistic measure of inter-rater agreement was 0.51 (p<0:001). Finally, each system was assigned to the type of control that received the most votes. Table 1 presents the results.
Independent variables
Size (LnSize) is measured as the natural loga-rithm of the number of employees working at the
Table 1
Classification of management control systems by academic scholars
Management control system Personnel Action Results Not a
control system
Number of companies that adopted the system
P1 Regular company-wide sponsored social events 11 0 1 3 83
P2 Regular company-wide meetings 9 2 1 3 83
P3 Employee orientation program 15 0 0 0 67
P4 Mission or values statement 12 3 0 0 66
P5 Standard employment application 12 3 0 0 61
P6 In-house training 12 2 0 1 55
P7 Background check on prospective employees 13 0 2 0 47
P8 Human resources information system 8 5 0 2 45
P9 Newsletter or other regular company-wide correspondence
7 3 1 4 38
P10 Employee suggestion system 7 1 1 6 30
A1 Legal agreements about intellectual property/ non-competition
1 13 0 1 84
A2 Organizational chart 2 11 0 2 81
A3 Standard performance evaluation form 0 9 6 0 79
A4 Personnel manual or handbook 4 10 0 1 72
A5 Written job descriptions 1 14 0 0 49
A6 Written affirmative action plans 2 12 0 1 41
R1 Stock options 0 0 15 0 84
R2 Written performance evaluations 0 1 14 0 81
R3 Individual bonuses 0 0 15 0 69
R4 Skilled based pay 3 0 11 1 42
R5 Non-monetary recognition awards 1 0 14 0 39
R6 Team incentives or bonuses 2 0 13 0 32
R7 Profit sharing 1 0 14 0 29
Signing bonus 6 0 2 7 33
16Alternative procedures like statistical techniques for
var-iable reduction were not used for several reasons. The first is related to data availability: to run these techniques a significant sample is required, however most firms did not adopt all the systems and the available sample was smaller than the number of variables. Second, the common data among systems are their adoption dates, thus grouping variables around common factors would involve using an independent variable to define the dependent one.
end of each year.17Age (Age) is the time since the founding of the company; to homogenize the interpretation of this event, it is defined as the date in which the company was registered. Venture capital (VC) is a dummy variable updated yearly that takes the value of one if the company has venture capital financing and zero otherwise. Similarly,NewCeo is a dummy variable also up-dated every year that takes the value of one if a new CEO replaced the founder and zero if the founder is still CEO.
In addition to these variables, the research de-sign controls for industry. This variable may cap-ture some of the differences across firms in terms of their external (Gordon & Narayanan, 1984) or production environments (Brownell & Merchant, 1990). The broader literature on MCSindicates that these variables are associated with variation in the design of these systems across companies. If the arguments developed to explain variation among the MCSof larger firms are relevant to the emergence of MCS––for example, firms with more structured operations like product assembly may adopt MCSsooner because these tasks are more amenable to explicit coding compared to less structured operations like product development, then controlling for them may enhance the power of the research design. Five industries are coded using dummy variables: telecommunications, medical devices, manufacturing, semiconductors, and computer (reference industry in the empirical tests).
In addition, a dummy is included to capture the strategy of the firm. Business strategy has been identified as relevant to explain cross-sectional variation in the design of management control systems (Kober et al., 2000; Langfield-Smith, 1997). The relevance of strategy to the success of small firms has also been empirically documented (Feeser & Willard, 1990). To code this variable, the founder and the CEO were asked to describe the distinctive competence of the firm. Their
descriptions were content-analyzed by two differ-ent researchers and coded into five differdiffer-ent strat-egies: superior marketing (reference industry in the empirical tests), technology leadership (innova-tion), enhance existing technology, cost minimi-zation, and technology-market hybrid. The strategy variables are coded as dummy variables.
Results
The second section presented different argu-ments that may affect the emergence of MCS. This section empirically examines these arguments. Two different multivariate methods are used: regression and structural equation modeling. Given the exploratory nature of the study, a regression specification puts very little structure on the model and directly tests the impact of the variables of interest after controlling for industry and strategy. The structural equation model puts more structure on the underlying relationships and, as such, it requires a more established theory and a larger number of observations. However, the entrepreneurship literature offers enough guidance to relate certain explanatory variables into a more elaborate model and thus more informative than the regression specification. Together, both anal-yses provide robust evidence about the arguments developed in the second section. The regression specification better fits the exploratory nature of the study. The structural equation model, with stronger assumptions about the underlying struc-ture of the relationships, gives a more informative analysis.
Descriptive statistics
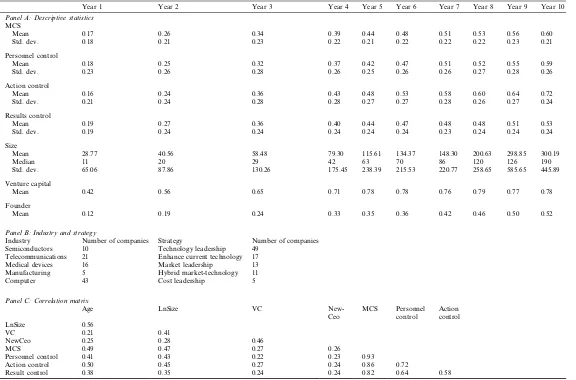
Table 2 presents the descriptive statistics for the sample. All of the variables increase over time. Size increases over time, as expected in growing firms. Also the number of firms that received venture funding, as well as those where the founder was replaced as CEO, grows over time. Finally, the adoption of the three types of MCSalso increases over time. Panel B provides the distribution of
17
Table 2
Descriptive statistics
Year 1 Year 2 Year 3 Year 4 Year 5 Year 6 Year 7 Year 8 Year 9 Year 10
Panel A: Descriptive statistics
MCS
Mean 0.17 0.26 0.34 0.39 0.44 0.48 0.51 0.53 0.56 0.60
Std. dev. 0.18 0.21 0.23 0.22 0.21 0.22 0.22 0.22 0.23 0.21
Personnel control
Mean 0.18 0.25 0.32 0.37 0.42 0.47 0.51 0.52 0.55 0.59
Std. dev. 0.23 0.26 0.28 0.26 0.25 0.26 0.26 0.27 0.28 0.26
Action control
Mean 0.16 0.24 0.36 0.43 0.48 0.53 0.58 0.60 0.64 0.72
Std. dev. 0.21 0.24 0.28 0.28 0.27 0.27 0.28 0.26 0.27 0.24
Results control
Mean 0.19 0.27 0.36 0.40 0.44 0.47 0.48 0.48 0.51 0.53
Std. dev. 0.19 0.24 0.24 0.24 0.24 0.24 0.23 0.24 0.24 0.24
Size
Mean 28.77 40.56 58.48 79.30 115.61 134.37 148.30 200.63 298.85 300.19
Median 11 20 29 42 63 70 86 120 126 190
Std. dev. 65.06 87.86 130.26 175.45 238.39 215.53 220.77 258.65 585.65 445.89
Venture capital
Mean 0.42 0.56 0.65 0.71 0.78 0.78 0.76 0.79 0.77 0.78
Founder
Mean 0.12 0.19 0.24 0.33 0.35 0.36 0.42 0.46 0.50 0.52
Panel B: Industry and strategy
Industry Number of companies Strategy Number of companies Semiconductors 10 Technology leadership 49
Telecommunications 21 Enhance current technology 17 Medical devices 16 Market leadership 13 Manufacturing 5 Hybrid market-technology 11
Computer 43 Cost leadership 5
Panel C: Correlation matrix
Age LnSize VC
New-Ceo
MCSPersonnel control
Action control LnSize 0.56
VC 0.21 0.41
NewCeo 0.25 0.28 0.46
MCS0.49 0.47 0.27 0.26
Personnel control 0.41 0.43 0.22 0.23 0.93
Action control 0.50 0.45 0.27 0.24 0.86 0.72
Result control 0.38 0.35 0.24 0.24 0.82 0.64 0.58
Panel A: Personnel, action, and results control are the percentage of systems adopted over the maximum number of systems that can be potentially adopted. Size is the number of employees. Venture capital (dummy variable that takes value of one if the company received venture funding and zero otherwise) reflects the percentage of firms having venture capital in their equity. Founder (dummy variable that takes value of one if the founder was replaced as CEO and zero otherwise) reflects the percentage of firms having replaced their founder as CEO. Panel C: Pearson correlations reported, except for VC and NewCeo where coefficient of contingency is reported. All correlations are significant at the 1% level.
T.
Davila
/
Accountin
g,
Organizations
and
Society
30
(2005)
223–248
companies across industries and strategies. Com-puter firms account for close to 50% of the sample. Given that the industry distribution, it is not sur-prising that close to 50% of the companies in the sample follow a technology leadership strategy. Panel C presents the correlation of the company-year observations.
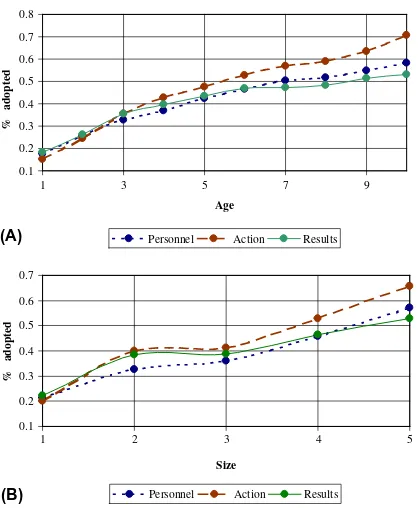
Fig. 1 elaborates on the previous table and presents the growth of the three types of MCS identified in this research. Panel A plots the growth in the number of systems adopted (as percentage of the total number of systems) against the age of the company; panel B plots growth against five portfolios of company sizes. Both panels show a positive relationship and no dis-cernible differences across types of systems. Inter-estingly, panel B suggests three stages in the emergence of MCSas a function of size; compa-nies start adopting these systems for
organiza-tional sizes below 17 people, and keep on adding systems until they reach 34 people. However no new systems seem to be necessary until size reaches 75 people, when additional systems are adopted. 18 A ‘‘natural’’ slow-down emerges between sizes 34 and 75 indicating that above size 75 (approxi-mately), the coordination and control needs are not fulfilled anymore with the systems developed during the early stages.
Multivariate results––regression specification
To examine the arguments presented in second section, the number of systems adopted at the end of each year per company in total and within each of Merchant’s types of controls is counted. A Poisson model better captures the discrete nature of count data (dependent variable) compared to a traditional ordinary least square model (Greene, 2000). The probability of observing a certain number of management control systems adopted at a point in time is
PrðYi¼yÞ ¼
e
P
jbjxj P jbjxj
y
y! ;
where y ¼0;1;2;3;. . . is the number of systems adopted, xj are the explanatory variables, andbj
are the coefficients for the explanatory variables. A coefficient equal to one indicates that the inde-pendent variable has no effect upon the probability of adopting MCS.19A coefficient larger (smaller) than one indicates that the independent variable increases (decreases) the probability of adopting MCS. The explanatory variables include size, age, whether the founder had been replaced as CEO, and the presence of venture capital as well as the
0.1 0.2 0.3 0.4 0.5 0.6 0.7 0.8
1 3 5 7 9
Age
% adopted
Personnel Action Results
0.1 0.2 0.3 0.4 0.5 0.6 0.7
1 2 3 4 5
Size
% adopted
Personnel Action Results
(A)
(B)
Fig. 1. Adoption of management control systems: Panel A–– Management control systems and organizational age; Panel B––Management control systems and organizational size. The size portfolios are distributed to have the same number of observations and include the following sizes: <17.5, (17.5, 34), (34,75), (75, 160), >160.
18A comparison of the mean percentage of systems adopted
(for each type of system) confirmed that the differences are all significant (at the 5%) except between sizes (17.5, 34) and (34,75).
19The tables report eb, thus a coefficient of 1 is equivalent to
control variables. All variables are updated every year.20Table 3 reports the results.
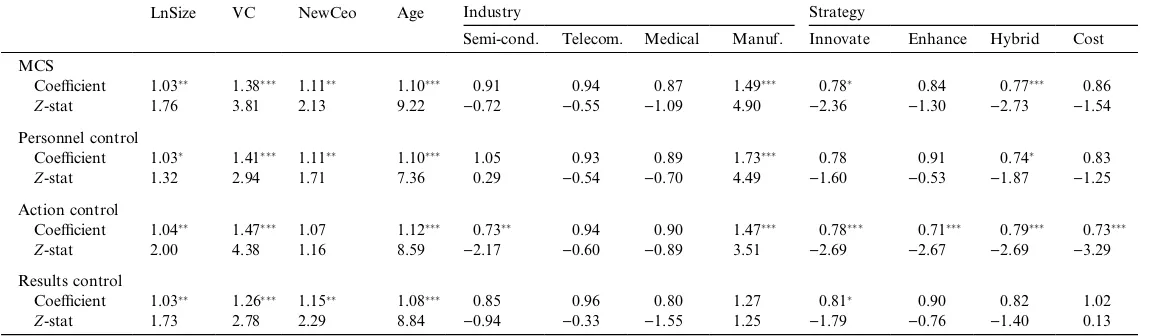
Size has a positive and significant impact at the overall MCSlevel and at the level of personnel, action, and results controls. The significance of size in action control suggests that internal controls are also adopted as the firm grows or that alternative action control systems dominate the empirical relationship. Similarly, the coefficient for age is positive and significant in every specification: older companies are more likely to have adopted a larger number of MCSafter controlling for the other explanatory variables. This is consistent with the various types of systems benefiting from learning effects and against personnel and result controls being adopted as needs unrelated to time arise. The replacement of the founder by a new CEO ( New-Ceo¼1) also has a significant positive effect except for action control. This evidence indicates that while entrepreneurs allow the development of ac-tion control, they fail to put in place personnel and results controls until a new CEO brings them to the firm. Similarly, venture capital funding (VC¼1) is also significant for all specifications consistent with venture capitalists influencing all aspects of control
systems’ adoption. Industry and strategy are jointly significant. 21
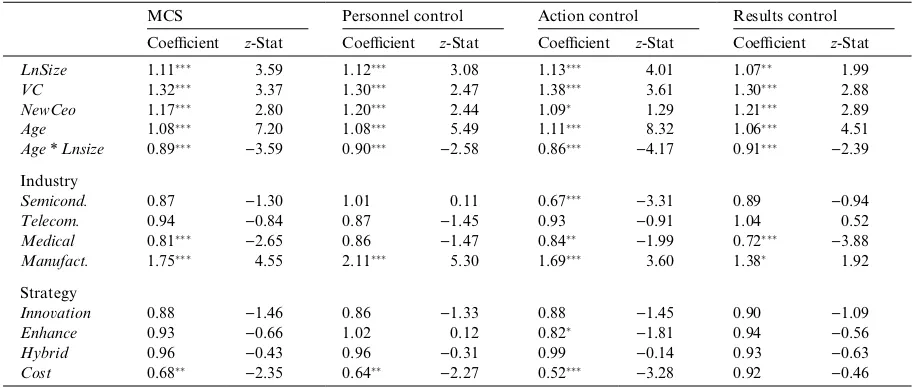
The second section also argued that the impact of age on the emergence of MCSmay stronger for larger firms. To test this argument controlling for the results in Table 3, a new variable is defined as the interaction between the standardized size and age variables. This interaction term captures the effect of age at different size levels. Table 4 presents the results.
Interestingly, the coefficient on the interaction term is negative for all specifications. This result suggests that for a given size, older firms are less likely to have adopted more management control systems. To further investigate this result and po-tential non-linearities in the relationship, each firm-year is classified into the five portfolios de-fined in Fig. 1. The interaction term is replaced with four interaction terms, where a dummy vari-able for each of the four largest portfolios is interacted with age. The results (included in Appendix B) indicate that the negative effect of size on age weakly holds for the four largest portfolios and only when considering all MCS together. Moreover, the coefficients on the inter-action terms are not significantly different from each other for the most part. Thus, it appears that the effect of size on age is not due to a particular size portfolio of firms.
The second section also developed the argument of a differential effect of the replacement of the founder as CEO across companies with different
20To check the robustness of the results, alternative
spec-ifications are examined. First, separate Poisson regressions for each of the 10 years are examined; the significance of the coefficients is tested using aZ-statistic that corrects for cross-sectional and serial correlation (Z is defined as z=ðstdevðzÞ=
ffiffiffiffiffiffiffiffiffiffiffiffiffiffiffiffi
ðN1Þ
p
ÞwhereNis the number of regressions performed; the z-statistic is asymptotically normally distributed andZtests the significance of its mean). Because age is kept constant in each of the regressions, this specification tests the significance of variables other than age. The conclusions from this specifica-tion were identical to the ones from Table 3. Next, the sample is partitioned based on size. Each observation is classified into one of five equal portfolios of increasing size (the five portfolios were the same ones as in Fig. 1: size <17.5, 17.5 < size < 34, 34 < size < 75, 75 < size < 160, size > 160). When a company has more than one observation in a portfolio (for example its size in different years fell within the same portfolio), observa-tions are averaged. A separate Poisson regression is run for each size portfolio. This specification tests the significance of variables other than size (in particular, age). The results were also consistent with Table 3 except for personnel control systems, where age was not significant. To further test the significance of the results, a survival model to explain the time-to-adoption of 50% of the MCSwas examined. Results were also comparable.
21
Companies classified as manufacturing are more likely to develop MCSsooner (although this conclusion should be read with care as the sample only includes five firms in this industry). The nature of the manufacturing process may itself lead to more rapid formalization compared to the other industries in the sample that appear to be more R and D oriented. Companies following an innovation strategy and hybrid strat-egy take longer than the reference stratstrat-egy (market leadership), probably reflecting an effort to safeguard the creativity that has typically been associated with informal management. Surpris-ingly, companies following a cost strategy take longer to adapt action control; given the importance of controlling costs, a fast adoption of action control to code and monitor cost reduction learning would be expected. (Again, only five companies follow a cost strategy and this conclusion should be read considering this caveat.)
Table 3
The emergence of management control systems
LnSize VC NewCeo Age Industry Strategy
Semi-cond. Telecom. Medical Manuf. Innovate Enhance Hybrid Cost
MCS
Coefficient 1.03 1.38 1.11 1.10 0.91 0.94 0.87 1.49 0.78 0.84 0.77 0.86
Z-stat 1.76 3.81 2.13 9.22 )0.72 )0.55 )1.09 4.90 )2.36 )1.30 )2.73 )1.54
Personnel control
Coefficient 1.03 1.41 1.11 1.10 1.05 0.93 0.89 1.73 0.78 0.91 0.74 0.83
Z-stat 1.32 2.94 1.71 7.36 0.29 )0.54 )0.70 4.49 )1.60 )0.53 )1.87 )1.25
Action control
Coefficient 1.04 1.47 1.07 1.12 0.73 0.94 0.90 1.47 0.78 0.71 0.79 0.73
Z-stat 2.00 4.38 1.16 8.59 )2.17 )0.60 )0.89 3.51 )2.69 )2.67 )2.69 )3.29
Results control
Coefficient 1.03 1.26 1.15 1.08 0.85 0.96 0.80 1.27 0.81 0.90 0.82 1.02
Z-stat 1.73 2.78 2.29 8.84 )0.94 )0.33 )1.55 1.25 )1.79 )0.76 )1.40 0.13
The table reports the Poisson regression for the pooled data controlling for potential autocorrelation of error terms for observations from the same firm. The coefficients reported are the incidence rate ratio (eb).,,indicate significant at 1%, 5%, 10% respectively; one-tailed forLnSize,VC,NewCeo,Age, two-tailed otherwise. The reference strategy is market leadership and the reference industry is computer. Chow test indicates that industry and strategy variables are jointly significant (p<0:01) in all regressions.
T.
Davila
/
Accountin
g,
Organizations
and
Society
30
(2005)
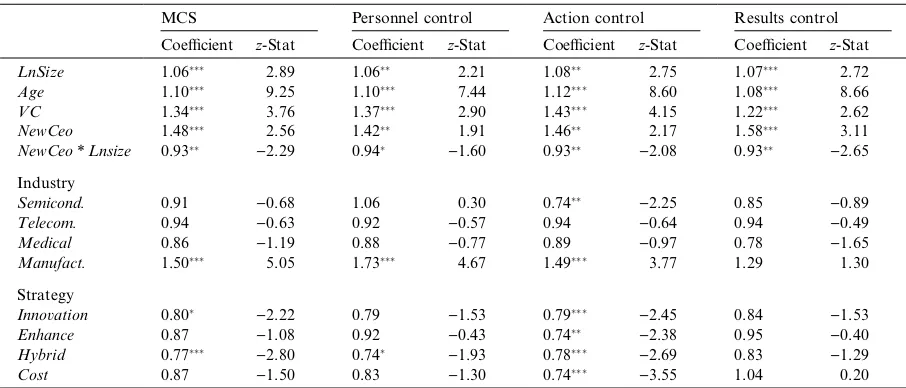
sizes. To test this argument controlling for the results in Table 3, I define a new variable as the interaction between the founder’s variable and the size variable. Table 5 reports the results.
The results indicate that the effect of replacing the founder as CEO on the emergence of MCSis significantly larger for smaller firms. Interestingly, the effect holds for all three types of systems, including action control. This is in contrast with the non-significant effect of replacing the founder on action control in Table 3 and suggests that in smaller firms, the replacement of the CEO may be related to the inability of this person to put in place action control.22
Multivariate results––structural equation model
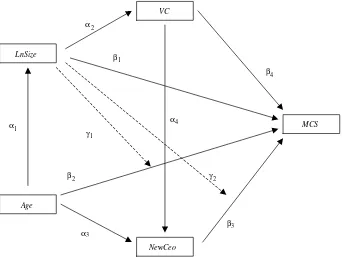
This sub-section examines the data impos-ing more structure into the model rather than assuming that the hypothesized explanatory vari-ables are fully exogenous. Using a structural equation model, the specification examines the potential endogeneity among explanatory vari-ables as the entrepreneurial literature outlines. Fig. 2 describes the model.
The model reflects the relationships captured in Table 3 between management control systems and size (b1), age (b2), replacement of founder (b3),
and venture capital (b4). It also includes the
moderating effect of age on size (c1) (Table 4) and
replacement of founder (c2) (Table 5). In addition,
it includes the potential relationship between age and size (a1), where older firms are expected to be
larger, the potential relationship between size and obtaining venture capital (a2)––larger firms are
more likely to have venture capital (Sapienza et al., 1996), the potential effect of age on the replace-ment of the founder as CEO (a3) and the argument
that venture capitalists professionalize firms and,
Table 4
The impact of age at different size levels on the emergence of management control systems
MCSPersonnel control Action control Results control
Coefficient z-Stat Coefficient z-Stat Coefficient z-Stat Coefficient z-Stat
LnSize 1.11 3.59 1.12 3.08 1.13 4.01 1.07 1.99
VC 1.32 3.37 1.30 2.47 1.38 3.61 1.30 2.88
NewCeo 1.17 2.80 1.20 2.44 1.09 1.29 1.21 2.89
Age 1.08 7.20 1.08 5.49 1.11 8.32 1.06 4.51
Age*Lnsize 0.89
)3.59 0.90 )2.58 0.86 )4.17 0.91 )2.39
Industry
Semicond. 0.87 )1.30 1.01 0.11 0.67
)3.31 0.89 )0.94
Telecom. 0.94 )0.84 0.87 )1.45 0.93 )0.91 1.04 0.52
Medical 0.81
)2.65 0.86 )1.47 0.84 )1.99 0.72 )3.88
Manufact. 1.75 4.55 2.11 5.30 1.69 3.60 1.38 1.92
Strategy
Innovation 0.88 )1.46 0.86 )1.33 0.88 )1.45 0.90 )1.09
Enhance 0.93 )0.66 1.02 0.12 0.82 )1.81 0.94 )0.56
Hybrid 0.96 )0.43 0.96 )0.31 0.99 )0.14 0.93 )0.63
Cost 0.68
)2.35 0.64 )2.27 0.52 )3.28 0.92 )0.46
The table reports the Poisson regression for the pooled data, controlling for potential autocorrelation of error terms for observations from the same firm. The coefficients reported are the incidence rate ratio (eb).,,indicate significance at the 10%, 5% and 1% respectively; one-tailed for LnSize, VC, NewCeo, Age, andAge*LnSize, two-tailed otherwise. The reference strategy is market leadership and the reference industry is computer. Chow test indicates that industry and strategy variables are jointly significant (p<0:01) in all regressions.
22As an alternative specification, firms that replaced their
founder were classified into five groups, following the five size portfolios identified in Fig. 1. Each group was defined as the size of the firm when the CEO is replaced. This variable was interacted withNewCeoto identify the effect of replacing the CEO for companies of different size. The results indicate that the impact of replacing the founder was more significant for the smallest group of firms.
accordingly, are more likely to replace the CEO (a4) (Robie et al., 1997). This alternative model is
estimated using a structural equation model with linear equations including an intercept term and using the covariance matrix. Because the empirical variables are the theoretical variables of the study, the measurement model does not include an error term, but the linear equations’ model does.
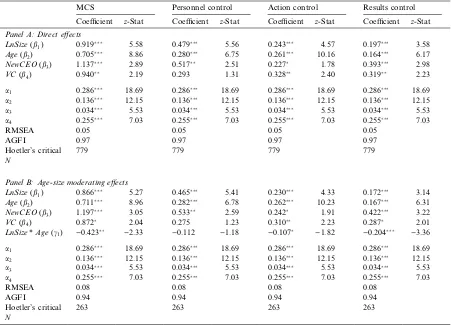
This estimation procedure relies on a more restrictive set of distributional assumptions than the regression specification; moreover, the num-ber of observations available is somewhat low to estimate the full model.23 Thus, these tests should be interpreted with these caveats in mind. However, by placing a more elaborate model, it allows to examine the relevance of the results after controlling for potentially relevant interactions. Table 6 reports the results. In
contrast to the regression specification, the coefficients here are interpreted as having a po-sitive effect if above zero and a negative effect if below zero.
Panel A reports the results comparable to Table 3 and Panel B reports the results com-parable to Table 4. Goodness of fit statistics indicates adequate fit of the models. In both Panels, the results are comparable to those re-ported in Tables 3 and 4 except for the signifi-cance of new CEO’s coefficient on the action control model, which was absent in Table 3. Its significance questions the previous conclusion and suggests that entrepreneurs may also delay the adoption of these systems. The coefficient for VC in the personnel control specification in Panel A is insignificant, in contrast to Table 3. This result is consistent with these investors not affecting the development of this type of control. The interaction in Panel B between age and size is not significant for personnel control suggest-ing that the argument on the effect of age on size may not hold for these systems. Finally, goodness-of-fit statistics indicate that model in
Table 5
The impact of replacing the founder as CEO at different growth rates on the emergence of management control systems
MCSPersonnel control Action control Results control
Coefficient z-Stat Coefficient z-Stat Coefficient z-Stat Coefficient z-Stat
LnSize 1.06 2.89 1.06 2.21 1.08 2.75 1.07 2.72
Age 1.10 9.25 1.10 7.44 1.12 8.60 1.08 8.66
VC 1.34 3.76 1.37 2.90 1.43 4.15 1.22 2.62
NewCeo 1.48 2.56 1.42 1.91 1.46 2.17 1.58 3.11
NewCeo*Lnsize 0.93
)2.29 0.94 )1.60 0.93 )2.08 0.93 )2.65
Industry
Semicond. 0.91 )0.68 1.06 0.30 0.74
)2.25 0.85 )0.89
Telecom. 0.94 )0.63 0.92 )0.57 0.94 )0.64 0.94 )0.49
Medical 0.86 )1.19 0.88 )0.77 0.89 )0.97 0.78 )1.65
Manufact. 1.50 5.05 1.73 4.67 1.49 3.77 1.29 1.30
Strategy
Innovation 0.80
)2.22 0.79 )1.53 0.79 )2.45 0.84 )1.53
Enhance 0.87 )1.08 0.92 )0.43 0.74 )2.38 0.95 )0.40
Hybrid 0.77
)2.80 0.74 )1.93 0.78 )2.69 0.83 )1.29
Cost 0.87 )1.50 0.83 )1.30 0.74 )3.55 1.04 0.20
The table reports the Poisson regression for the pooled data, controlling for potential autocorrelation of error terms for observations from the same firm. The coefficients reported are the incidence rate ratio (eb).,,indicate significant at 1%, 5%, 10% respectively; one-tailed forAge, VC, LnSize, NewCEO andNewCEO* LnSize. The reference strategy is market leadership and the reference industry is computer. Chow test indicates that industry and strategy variables are jointly significant (p<0:01) in all regressions.
23The suggested number of observations is between 100 and
Panel A presents better statistical properties and that the moderating effect of size upon age may not capture this potential relationship adequately.
Including the moderating effect of size on the replacement of the founder to the models in Panels A and B was not significant; this is in contrast with results in Table 5. One potential explanation for this latter result is that the effect of age and VC upon the replacement of CEO and the correlation between age and size (a1) and size and VC (a2)
captures this moderating effect.
Overall, the evidence is consistent with the four explanatory variables having a significant effect on the adoption on management control systems. The effect of venture capital upon per-sonnel control and the replacement of the founder upon action control are the only variables where the conclusions are not robust across specifica-tions.
The significance of the endogenous relation-ships highlights their relevance to the phenome-non. Thus, the structural equation model gives
evidence relevant not only to the emergence of MCSbut also to the entrepreneurial process. Moreover, the fact that the coefficients on the exploratory variables are significant after control-ling for the relationship among these variables indicate that the effects are not driven by poten-tially omitted relationships as it might have been the case in the less developed model underlying the regression specification.
Extensions
The previous specifications do not allow for the exploration of potential interrelations among the different types of MCSthat Merchant’s typology identifies. Moreover, theory does not yet offer arguments to guide predictions. However, empiri-cal examination of these relationships is relevant to understanding whether different control systems are implemented together, for example, personnel and results controls reinforce each other; whether they are substitutes for each other, for example, the adoption of personnel control makes results
MCS
NewCeo LnSize
VC
Age
4
2 1
2
3
4
1
2
α
α
α
α β1
β
β3
β
γ
γ
Fig. 2. Path diagram of the estimation model including potential endogenous relationships.
control redundant; or whether they are indepen-dent, for example, personnel and results controls address unrelated control issues.
To provide some preliminary evidence on whether the three types of control systems behave as complements, supplements, or are independent of each other, the following tests explore how the density of systems already adopted affects the time it takes to implement an additional control system. For each type of management control system (personnel, action, and results) and for each company, the systems are ordered from the earliest one adopted to the latest. The time-to-adoption is the time between the adoption of two consecutive systems. For example, if a personnel control sys-tems was implemented at the end of year three,
and the following one is implemented at the end of year four, the time-to-adoption of the latter system is defined to be 1 year.24 If the control systems that a company has already implemented behave as supplements (complements), then the time-to-adoption will be longer (shorter). For example, if action and result controls are supplements, then the time-to-adoption of a new action control is expected to be longer the more result control sys-tems are already in place. Conversely, if they are
Table 6
The emergence of management control systems including endogenous relationships among explanatory variables
MCSPersonnel control Action control Results control
Coefficient z-Stat Coefficient z-Stat Coefficient z-Stat Coefficient z-Stat
Panel A: Direct effects
LnSize(b1) 0.919 5.58 0.479 5.56 0.243 4.57 0.197 3.58
Age(b2) 0.705 8.86 0.280 6.75 0.261 10.16 0.164 6.17
NewCEO(b3) 1.137 2.89 0.517 2.51 0.227 1.78 0.393 2.98
VC(b4) 0.940 2.19 0.293 1.31 0.328 2.40 0.319 2.23
a1 0.286 18.69 0.286 18.69 0.286 18.69 0.286 18.69
a2 0.136 12.15 0.136 12.15 0.136 12.15 0.136 12.15
a3 0.034 5.53 0.034 5.53 0.034 5.53 0.034 5.53
a4 0.255 7.03 0.255 7.03 0.255 7.03 0.255 7.03
RMSEA 0.05 0.05 0.05 0.05
AGFI 0.97 0.97 0.97 0.97
Hoetler’s critical N
779 779 779 779
Panel B: Age-size moderating effects
LnSize(b1) 0.866 5.27 0.465 5.41 0.230 4.33 0.172 3.14
Age(b2) 0.711 8.96 0.282 6.78 0.262 10.23 0.167 6.31
NewCEO(b3) 1.197 3.05 0.533 2.59 0.242 1.91 0.422 3.22
VC(b4) 0.872 2.04 0.275 1.23 0.310 2.23 0.287 2.01
LnSize*Age(c1) )0.423 )2.33 )0.112 )1.18 )0.107 )1.82 )0.204 )3.36
a1 0.286 18.69 0.286 18.69 0.286 18.69 0.286 18.69
a2 0.136 12.15 0.136 12.15 0.136 12.15 0.136 12.15
a3 0.034 5.53 0.034 5.53 0.034 5.53 0.034 5.53
a4 0.255 7.03 0.255 7.03 0.255 7.03 0.255 7.03
RMSEA 0.08 0.08 0.08 0.08
AGFI 0.94 0.94 0.94 0.94
Hoetler’s critical N
263 263 263 263
The table presents the unstandardized path coefficients.,,indicate significant at 1%, 5%, 10% respectively.
24
complements, then the time-to-adoption is shorter. The density of existing MCSis measured using three variables (one for each type of control sys-tem):Numper is the number of personnel control systems already implemented, Numact is the number of action control systems already imple-mented, and Numresis the number of result con-trol systems already implemented.
The time-to-adoption for each individual sys-tem is treated as an observation; standard errors are adjusted for heterogeneity. An event history analysis approach is used to examine this ques-tion. This research design is appropriate to investigate the time to an event––for example, the adoption of a management control system––and identifies which explanatory variables are rele-vant to this time-to-adoption. A survival model characterized by its hazard function hðtÞ is de-fined as
hðtÞ ¼lim
D!0Pr½ðt6T <tþDjTPtÞ=D ðKiefer; 1988Þ:
hðtÞ can be interpreted as the conditional probability of adopting a system in the interval (t;tþD), given that it has not been reached at time
t.25 Several characterizations of hðtÞ have been suggested (Lee, 1992). The simplest form is an exponential function that has constant hazard rate, and independent variables affect the slope of the hazard rate: hðtÞ ¼expðbixiÞ, where the b’s
are the coefficients and x’s are the independent variables. In this case, it is also hypothesized that the age of the firm may affect the hazard rate and thus use a model that explicitly incorporates the effect of time: hðtÞ ¼h0ðtÞexpðbixiÞ. A Weibull
specification is used to control for a time-varying hazard rate:hðtÞ ¼ptp1expðb
ixiÞ, wherepis
a parameter estimated within the model. Finally, some of the dependent variables (size, presence of venture capital, replacement of founder, and density of MCS) are time dependent, thus the
estimated model is: hðt;xiðtÞÞ ¼ptp1expðbi
xiðtÞÞ.
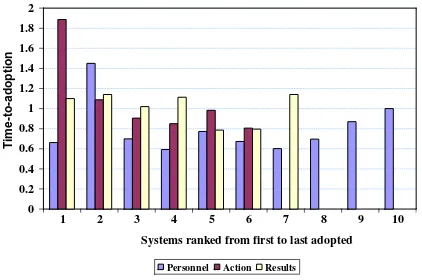
Fig. 3 reports the average time-to-adoption for the sequence of management control systems within each category––personnel, action, and re-sults. The first action control takes the longest to become formalized (1.9 years compared to 0.7 for personnel and 1.1 for results). Otherwise, the pat-tern is not clear-cut but suggests that the time-to-adoption decreases initially and then increases.
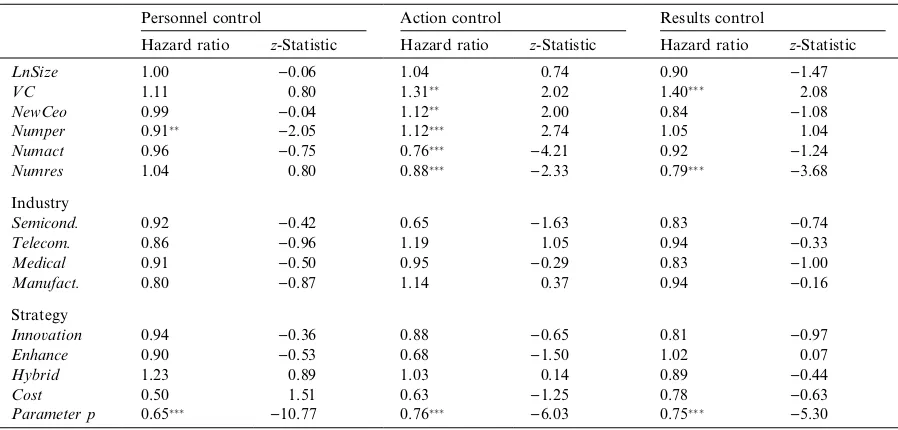
Table 7 presents the results of the multivariate analysis. The coefficient for Numper for the per-sonnel control model is less than one. This result indicates that the more personnel control systems are already implemented, the longer the time-to-adoption of a new personnel control system. In other words, personnel control systems behave as supplements of each other; the value of an addi-tional personnel control system decreases with the number of personnel systems already adopted. Also, the number of action and results control systems has no significant impact on the adoption of personnel control systems. For the action con-trol model, Numper has a coefficient larger than one. This finding suggests that the existence of personnel control decreases the time-to-adoption of action control; thus action and personnel con-trols complement each other. Thus, the value of action control seems to increase the more personnel control systems are present. Numact and Numres
are both significant and less than one, indicat-ing that their presence delays the time-to-adoption
25
This interpretation is only approximate because the definition includes aDin the denominator.
0 0.2 0.4 0.6 0.8 1 1.2 1.4 1.6 1.8 2
1 2 3 4 5 6 7 8 9 10 Systems ranked from first to last adopted
Time-to-adoption
Personnel Action Results
Fig. 3. Time between adoption of successive management control systems.
of a new action control system.26The presence of venture capital, as well as the hiring of a new CEO, decreases the time-to-adoption of action control systems. This suggests that these investors, who get involved closely with the management of the firm, and new CEOs hired to move the company for-ward, view action control as useful to managing the organization. Finally, for the results control model,
Numresis less than one, reinforcing the idea that the existence of systems with similar characteristics increases the time-to-adoption of systems within the same type. In this last model the coefficient for
VC is significant and larger than one, indicating that the presence of venture capital reduces the time to adoption of results control. Finally, the effect of time (parameterp) also negatively affects the adoption of new systems; in other words, the longer the time since the last system was adopted, the less likely is that the company will adopt a new system.
These results indicate that the presence of management systems classified within the same type have a negative impact on the time-to-adop-tion. Otherwise, only action control is affected by the adoption of other types of controls; in partic-ular the presence of personnel control reduces the time-to-adoption while results control increase it.
A final set of descriptive statistics examines which MCSare adopted earlier. For each com-pany, each system is ranked from the first system adopted (1), second (2), and so forth. On average, results control systems have the lowest rank (mean of 6.65) and this mean is significantly smaller than
Table 7
Time-to-adoption of sequential management systems
Personnel control Action control Results control
Hazard ratio z-Statistic Hazard ratio z-Statistic Hazard ratio z-Statistic
LnSize 1.00 )0.06 1.04 0.74 0.90 )1.47
VC 1.11 0.80 1.31 2.02 1.40 2.08
NewCeo 0.99 )0.04 1.12 2.00 0.84 )1.08
Numper 0.91
)2.05 1.12 2.74 1.05 1.04
Numact 0.96 )0.75 0.76 )4.21 0.92 )1.24
Numres 1.04 0.80 0.88
)2.33 0.79 )3.68
Industry
Semicond. 0.92 )0.42 0.65 )1.63 0.83 )0.74
Telecom. 0.86 )0.96 1.19 1.05 0.94 )0.33
Medical 0.91 )0.50 0.95 )0.29 0.83 )1.00
Manufact. 0.80 )0.87 1.14 0.37 0.94 )0.16
Strategy
Innovation 0.94 )0.36 0.88 )0.65 0.81 )0.97
Enhance 0.90 )0.53 0.68 )1.50 1.02 0.07
Hybrid 1.23 0.89 1.03 0.14 0.89 )0.44
Cost 0.50 1.51 0.63 )1.25 0.78 )0.63
Parameterp 0.65
)10.77 0.76 )6.03 0.75 )5.30
The model estimates time-to-adoption between consecutive personnel, action, and results control systems. For the first system, the time-to-adoption is time since founding. The hazard function follows a Weibull specification:hðtÞ ¼ptp1expðb
ixiÞ.LnSizeis the natural logarithm of size,VCis a dummy variable that takes value of one if the company received venture capital funds,NewCEOis a dummy variable that takes value of one if the founder is not CEO anymore,Numperis the number of personnel control systems in place at the time the new system is adopted,Numactis the number of action control systems in place at the time the new system is adopted,Numresis the number of results control systems in place at the time the new system is adopted. Significance tests are one-tailed forLnSize,VC, andNewCeo, two-tailed otherwise.,,, indicate significance at the 10%, 5%, and 1%.
26A further analysis of the data (not reported) indicates that