www.elsevier.nlrlocaterjappgeo
Ray and finite-difference modelling of CDP seismic sections for
shallow lignite deposits
Johana Brokesova
a,), Jirı Zahradnık
b, Paraskevas Paraskevopoulos
cˇ ´
ˇ´
´
a
Department of Geophysics, Faculty of Mathematics and Physics, Charles UniÕersity, Ke KarloÕu 3, 121 16 Prague 2, Czech Republic
b
Department of Geophysics, Faculty of Mathematics and Physics, Charles UniÕersity, V HolesoˇÕickach 2,ˇ ´
180 00 Prague 8, Czech Republic
c
Seismological Laboratory, Section of Applied Geology and Geophysics, Geology Department, UniÕersity of Patras,
Rio 26110, Patras, Greece
Received 4 August 2000; accepted 29 September 2000
Abstract
A numerical experiment carried out to investigate the structural model of the Domenico lignite site is discussed. The model is a 2D structure containing several lignite layers at different depths, and a low-velocity layer at the top of the model. The experiment consists in simulating a measured CDP section by two independent techniques, based on completely different concepts: the finite-difference method and the ray method. Due to the incompleteness of the ray synthetic wave field, as well as to numerical problems of the finite differences at higher frequencies, the agreement between the synthetic seismogram sections for the individual shot points is poor. However, the CDP stacked sections modelled by the ray and finite-difference methods agree rather well. This is because the main differences between the wave fields computed by the
Ž .
two methods are due to the presence of the low-velocity layer ground roll, head waves, etc. , and just these parts of the wave field can be suppressed by routine data processing such as f–k filtration. Synthetic ray and finite-difference CDP stacks agree relatively well with the observed data. They confirm three lignite seams and a fault in the shallower one. The synthetic data also indicate that many apparent horizons of the measured section may be due to the multiple reflections within the subsurface low-velocity layer.q2000 Elsevier Science B.V. All rights reserved.
Keywords: Reflection seismics; Lignite; Finite-difference method; Ray method
1. Introduction
Reflection seismic measurements of shallow un-derground structures are complicated by subsurface
Ž
low-velocity layers, e.g., sediments above the
)Corresponding author.
E-mail addresses: [email protected]
ŽJ. Brokesova ,ˇ ´. [email protected] ŽJ. Zahradnık ,´ .
Ž .
[email protected] P. Paraskevopoulos .
.
water-table level , and use of the surface sources. As a rule, the weight-drop surface source generates P and S waves with a complicated radiation pattern, and the ground roll is also very strong. Moreover, the high P-velocity contrast at the base of a low-velocity layer gives rise to intensive head waves, whose arrival times may be close to those of the primary reflections from the horizons being investi-gated. Another complication is due to the extremely high VPrVS velocity ratios often encountered close
0926-9851r00r$ - see front matterq2000 Elsevier Science B.V. All rights reserved.
Ž .
to the surface, as well as to the highly contrasting velocities and contrasting VPrVS velocity ratios at the boundaries between the layers.
All these serious complications contrast with the fact that most exploration work is processed and interpreted under very simplifying assumptions. For instance, the earth is treated as horizontally layered
Ž . Ž
only 1D models in the acoustic approximation only P waves being considered, all P–S and S–P
con-.
versions being neglected . The reasons for the sim-plifications are purely practical: exact methods are lacking, or exist but are unstable, andror time con-suming.
In any way, the desirable innovation in this re-spect is available through seismic modelling based on the combination of various methods. The main purpose of this contribution is to show possible improvements in finite-difference modelling and to offer a new view of the applicability of the ray method to shallow reflection seismics. The finite-dif-ference technique is ‘exact’ in that it provides the complete wave field containing all realistic wave types. It could be applied in 2D or 3D structures but requires much numerical effort in complex realistic
ˇ
Žmodels. The ray method see, e.g., Cerveny et al.,
´
.1988 is very fast and efficient, flexible and concep-Ž
tually simple allowing for identification of the indi-.
vidual body waves but yields only an approximation of the wave field. The ray synthetic wave field is rather incomplete and may not contain some impor-tant waves. These waves may even dominate the seismograms in complex models typical for shallow seismic studies. Only those parts of the wave field that consist of reflections from the most important structural interfaces can be modelled well by the ray method. Therefore, it is useless to compare single-shot synthetic ray and finite-difference wave fields. However, the principal reflections, which can be treated by the ray method, are of great importance in seismic exploration. The routine measurements and subsequent data processing techniques are designed to enhance these parts of the wave field and suppress the others. This gives the ray method a chance to be used with an advantage, e.g., in modelling the CDP stacked sections obtained from the multiple-shot data. Thus, the ray method may contribute significantly to the interpretation of the measured data in complex shallow structures.
Ž
The practical goal of this paper similarly to that .
in Zahradnık and Bucha, 1998 is to provide tools for
´
modelling seismic time sections that would improve the understanding of the recorded wave fields, and help avoid interpretation traps. The object of these studies is the lignite field at the Domenico site in Greece, studied within the NATO SfS project Ž1995–1998 in close cooperation between the Uni-. versity of Patras and the Charles University.The proposed structural model, based on the inter-pretation of real measurements and additional geo-logic information, is described in Section 2. Sections 3 and 4 concentrate on the numerical aspects of the computational techniques used. In Section 5, syn-thetic CDP time sections are presented and compared with the sections obtained from the observed data. Conclusions are given in Section 6. Abbreviations FD, ART denote the finite difference and asymptotic ray theory method, respectively. Other often used abbreviations are LVL for low-velocity layer, NLL for non-lignite layer, NMO for the normal moveout, and CDP for the common depth point method of reflection seismology.
2. Description of the model
The structural model used in our numerical study is derived from the measured time section in Fig. 1
Ž
and from drilling Tselentis, personal communica-.
tion . The structure contains a subsurface LVL, three lignite layers mostly separated from each other by
Ž .
non-lignite layers NLL , and bedrock. The upper lignite layer is faulted at the left-hand side of the profile. Based on all the available information, a 2D block model suitable for FD modelling was created, see Fig. 2. It was observed at the site that the lignite and non-lignite layers are composed of many thin layers. The problem of the thin-layered structure of the medium in coal exploration studies is addressed,
´
Ž .e.g., by Pietsch and Slusarczyk 1992 or Gochioco Ž1992 . To simplify the model for computations, this. detailed structure was not considered and the stacks of the thin layers were replaced by homogeneous layers with average medium parameters.
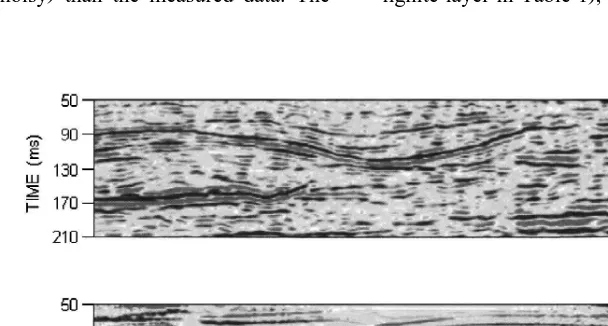
Ž .
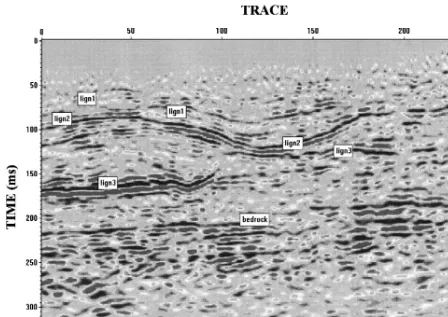
Fig. 1. A selected segment of the true processed CDP time section at the Domenico site Tselentis, unpublished data . The horizontal range
Ž . Ž . Ž .
in traces is from 0 left to 250 right and corresponds to the range 0–625 m. The vertical time scale is from 0 to 350 ms. The reflections from the three coal layers and the bedrock are shown.
the bedrock is not included in this model. The num-bered layers in Fig. 2 indicate, from above, the LVL with P-wave velocity VPs800 mrs and the lignite
Ž .
layers VPs1750, 1950, and 1850 mrs . As the S-wave velocities are not known well, an approxi-mate VPrVS velocity ratio of 4.3 was assumed throughout the entire model. The densities in the individual layers are shown in Table 1.
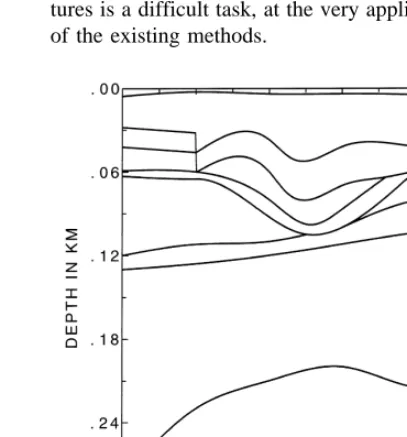
Since the block model containing sharp interface edges is not suitable for the ray method, a smoothed version of the model, shown in Fig. 3, was used to compute the ray synthetics. The basic shape of the individual layers corresponds well to the measured time section, as well as to the block model used for the FD modeling. In addition to the model in Fig. 2, the structure used for the ART modelling is
under-lain by a medium with VPs3250 mrs, VSs756
3 Ž .
mrs, rs2200 kgrm bedrock . The velocities and densities in the other layers are the same as in the previous model, see Table 1.
Ž .
The ray and FD models Figs. 2 and 3 are not identical. In particular, the FD model is composed of polygonal blocks, as formally required by our code. Although blocky models are useful for automated
Ž .
Ž .
Fig. 2. The structural model constructed from the time section of Fig. 1 and borehole data Tselentis, pers. comm. , converted to the polygonal model suitable for FD modelling. Small numbers indicate the blocks, large numbers display the P-wave velocities in mrs. Note that the bedrock is not included in this model.
The proposed structural model implies that the seismic modelling for purposes of lignite prospection at the Domenico site is complicated by several
fac-Ž .
tors most of which are, however, not site-specific :
v non-horizontal lignite layers, including faulted and displaced layers
v several lignite ‘floors’ at different depths
v low-velocity layer LVL below surface, with veryŽ . small velocities, separated by a high-velocity con-trast interface from the rest of the model
v very large V rV velocity ratio
P S
Table 1
Model parameters
3
Ž . Ž . Ž .
Layer VP mrs VS mrs r kgrm
LVL 800 186 1220
1st NLL 1950 453 1520
1st lignite layer 1750 407 1300
2nd NLL 2000 465 1700
2nd lignite layer 1950 453 1450
3rd NLL 2050 477 1750
3rd lignite layer 1850 430 1300
4th NLL 2800 651 1900
Bedrock 3250 756 2200
These factors imply that any seismic modelling that has to include synthetic seismograms for such struc-tures is a difficult task, at the very applicability limit of the existing methods.
Ž
Fig. 3. The structural model used in ART computations a smooth version of Fig. 2 with minor modifications, complemented by the
.
The sources and receivers are located at the free surface of the model. To approximate the weight-drop, used in real measurements, each source is represented by a single force applied vertically. The source-time function is approximated by the Gabor signal. The predominant frequency of the source wavelet is 100 Hz, i.e., the thicknesses of some layers in the model are comparable with the prevail-ing wavelength.
3. Finite-difference method, PS2 scheme
Shallow deposits are structurally complex, thus requiring robust numerical methods. An important question with regard to the practical applicability of the FD method is: ‘Which features of the elastic finite-difference schemes are essential for their accu-racy, and which allow simplifications?’. Zahradnık
´
Ž1995 has shown that the displacement FD schemes. employing geometrically averaged parameters are more accurate than those using local material param-eters, mainly when a material discontinuity runs between the grid lines. This means that a relatively complex coding of the effective parameters is re-warding.However, it has been also shown that the accu-racy of the mixed spatial derivatives at the internal grid points does not degrade when the number of the implicitly employed stress values and the geometri-cally averaged material parameters decreases from
Ž
four to two the so-called Full and Short Forms, .
respectively . The Short and Full Forms yield the same numerical results, the Short Form requiring 50% less arithmetic operations. That is the case where simplification is possible at the internal grid-points. However, at the free-surface points such sim-plification is not allowed, and the Full Form should be used, otherwise a spurious body force is created, and the scheme violates the vanishing-stress condi-tion. Based on these results, a simple elastic scheme Žcalled PS2 has been suggested in Zahradnık 1995,.
´
ŽŽ . Ž . Ž .
Eqs. 3 , 10 and 16 .
The PS2 is a second-order scheme in displace-ments on a regular square grid. Complete 2D elasto-dynamic equations are solved, thus all P, S and converted waves are considered, including all
multi-ples, head waves, diffracted waves andror interfer-ence waves. The medium is represented as composed of homogeneous polygonal blocks with constant ve-locities V and V .P S
Another advantage of the PS2 scheme is that its Ž
flat free-surface treatment the so-called vacuum for-.
malism is simple, but, at the same time, it provides an exact proof of approximating zero traction with first-order accuracy.
The reason for focusing much attention on the effective parameters is that sharp coalrrock
disconti-Ž .
nuities require accurate non-smoothed, non-shifted representations, often ignored in literature, although being at least as important as the widely discussed numerical dispersion andror numerical anisotropy. For warning about the schemes using only point
Ž
approximations of the elastic parameters instead of
. Ž .
the effective parameters , see Graves 1996 ,
Ž . Ž .
Zahradnık et al. 1993 and Moczo et al. 1999 .
´
The VPrVS ratio considered in this paper, based on a crosshole measurement at the site, brings mod-est FD waveform deformations which, however, do not change synthetic time sections qualitatively. For the accuracy analysis of the PS2 scheme at variousVPrVS ratios, performed by comparison with the finite-element and discrete-wavenumber method, see
Ž . Ž .
Oprsal and Zahradnık 1999 and Moczo et al. 1999 ,
ˇ
´
respectively. In general, the VPrV -dependent nu-Smerical dispersion complicates in some degree any elastic FD formulation, including for instance all
Ž types of the popular staggered formulations Moczo
. et al., 2000 .
In this numerical study, the FD PS2 scheme was used to simulate the CDP section in two different ways. The first approach, multiple-shot CDP
mod-elling, consists in repeated single-shot 2D elastic FD
Ž calculations, followed by standard processing CDP gather, optional f–k filtration, NMO correction and
.
CDP stacking . Note that the analogous multiple-shot CDP approach was also applied to ray synthetics. The second approach, called array CDP modelling, requires a single 2D elastic FD calculation of the synthetics excited by a set of sources acting simulta-neously at the surface. This approach is relatively inexpensive, but yields only an approximation of the CDP stack.
d ts0.0001 s, respectively. This grid size yields accurate results for wavelengths above 5 m. For example, for P waves in LVL this is equivalent to frequencies of up to 160 Hz.
4. Computational aspects of the ray method
ART synthetics for the model in Fig. 3 have been computed using the BEAM87 program package
ˇ
Žwritten by V. Cerveny designed for 2D complex
´
. laterally varying structures. The radiation pattern for a vertical force acting at the earth’s surface has been computed using the theoretical formulas of Jılek and´
ˇ
Ž .Cerveny 1996 , taking into account the presence of
´
the free surface.The ray synthetic wave field is, in principle, incomplete. The main problems are caused by the LVL in the model. Due to the velocity contrast, the base of the LVL is highly reflective. Consequently, such a layer may act as a waveguide converting a large amount of energy into interference waves
trav-Ž
elling along or near the earth’s surface ground roll, .
head waves . However, these waves, although possi-bly even dominant in the wave field, cannot be modelled by the zero-order ART. On the other hand, the waves that propagate within the LVL travel at much lower velocity than the waves in the rest of the model, which give us the chance to separate them and filter them out from the wave field.
Another problem connected with the ART syn-thetics is due to the limited number of elementary waves considered. In the case of a surface source, the ART wave field only consists of far-field P and S
Ž
body waves reflected from or, possibly, also con-.
verted at the interfaces. The number of these ele-mentary waves must be limited, otherwise the com-putational time would increase considerably, mainly due to the necessity of two-point ray tracing for each of these waves. This is another reason why the ART wave field is incomplete. In this way, some of the important multiple reflections, e.g., those connected with the LVL which could be really strong, would be
Ž
missing in the ray synthetics do not confuse these multiples with the ground roll in which we are not
.
interested at all . Fortunately, the standard CDP stacking procedure is supposed to suppress the
multi-ples, so that their absence may not be as important in the resulting stacked section.
The ART wave field does not contain diffractions from the edges and unconformities present in the model. Moreover, these structural features can pro-duce shadow zones separated by sharp boundaries from the illuminated parts of the profile. The ART cannot provide any signal, observable in the mea-sured or FD data, penetrating into the shadow zones. The position of the shadow zones, however, changes as the shot point moves along the profile. On the other hand, thanks to a certain robustness of the CDP stacking procedure, such local unrealistic gaps in the ART synthetics may not play an important role in producing the final CDP section. The same holds for the opposite effect to the gaps: locally enhanced amplitudes, e.g., in the vicinity of the caustic points, may also be smoothed by the stack.
5. Synthetic CDP sections
In this section, we present the FD CDP sections, obtained with the two approaches mentioned in
Sec-Ž
tion 3 for the model in Fig. 2 and its certain .
modifications . We also present the ART CDP sec-tions for the model in Fig. 3. All these synthetics are plotted in horizontal range from 37.5 to 587.5 m and they are compared with the corresponding measured section.
Fig. 4 shows two multiple-shot FD stacked sec-tions with the shot points spaced at intervals of 62.5 m, the first being situated at xs62.5 m from the left boundary of the model in Fig. 2. The relatively large shot spacing was used in order to keep the
Ž computational effort in ‘reasonable’ limits one sin-gle-shot FD calculation required about 18 h of
com-.
Ž . Ž .
Fig. 4. Multiple-shot FD CDP sections for models without top and with bottom the LVL. Shot point spacing interval is 62.5 m.
a modified structure is referred to as the model
without LVL. Comparing both pictures in Fig. 4 we
see that the presence of the LVL complicates the wave field reflected from deeper horizons consider-ably. The data is more noisy and produce more reflections in the final stack. Such undesirable rever-berations due to the LVL may obscure the reflections
Ž
of interest similar effects have also been reported by .
Zahradnık and Bucha, 1998 .
´
In the following calculations we applied the array FD CDP approach, described in Section 3, to
approx-Ž .
imate the standard multiple-shot CDP section. Fig. 5, in comparison to Fig. 4, demonstrates the accu-racy of such an approximation. At the top, there is the section for the model without the LVL, while the bottom panel represents the section for the model with the LVL. We see that the array FD approach models the main reflections very well, with much
Ž
less numerical effort only one FD run is required, the computer time of which is similar to that of a
.
single-shot calculation . All the reflections are in their correct positions, and the shallow ones are
Ž .
depicted better they are stronger than in the stan-dard CDP stack. Comparing the sections in Figs. 4 and 5, we also see other advantages of the array FD approach: the reflections are more continuous, less
Ž
noisy and reasonable at the edges where the stack is . not reliable due to insufficient fold coverage . The
effects due to the LVL, mainly the ‘additional’ hori-zons, are clearly visible in Fig. 5. These reflections are of importance comparable to those from the lignite layers, compared with Fig. 4, bottom, where such additional reflections are much weaker and less continuous.
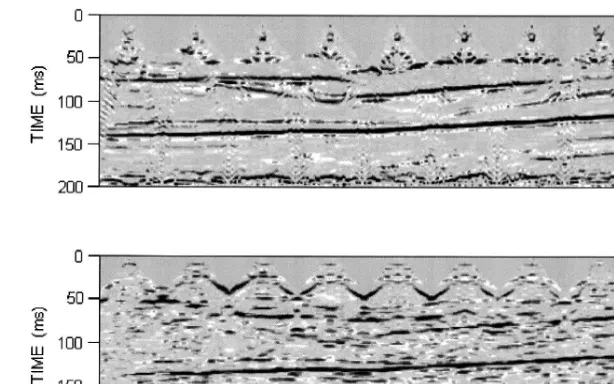
Thanks to the small computer time requirements of the ray method, it is possible to obtain sufficient CDP fold coverage, and, therefore, it is not neces-sary to approximate the standard CDP sections by an Aarray ray CDP approachBsimilar to that one used in FD computations. The results in Fig. 6 represent the multiple-shot ART modelling of the CDP section for the model in Fig. 3. Twenty shot points spaced at intervals of 25 m, starting from xs75 m, were considered. One single-shot section required only up
Ž
to 10 min on a standard Pentium PC compare with the 18 h necessary for the one shot point in the
.
Ž . Ž .
Fig. 5. Array FD CDP sections for the models without top and with bottom the LVL.
into account. In both sections, the primary P and S reflections from all the interfaces are considered, together with the P–S and S–P waves converted at the reflectors, and some multiple reflections within the lignite layers. Moreover, each deeper reflection is considered together with its ‘ghosts’ generated by
Ž .
the waves reflected without conversion once from the base of the LVL, either in the vicinity of the
Ž .
source or receiver the ghost effect . The section in the bottom part of Fig. 6 also includes the multiples reflected twice from the bottom of the LVL. The purpose of this numerical experiment was to test
whether the stacking procedure can really suppress the multiples in this particular model. A comparison of the top and the bottom part of Fig. 6 shows that some of the additional multiples remain relatively intensive after stacking. Although they are clearly due to the LVL, they could possibly be misinter-preted as additional lignite layers. Moreover, the experiment suggested that we could not be sure that
Ž
even other multiples in the LVL reflected three or .
more times from the base of the LVL , not included in the ART computations, would be eliminated in the stacked section. Thus, the incompleteness of the
ART synthetics may become a serious problem in modelling the proposed structure. But we believe that in models closer to reality as regards absorption Žwhich is not considered in our study , the attenua-. tion would suppress the undesirable reverberations due to the LVL.
In comparing the sections in Figs. 4–6, we have to take into account that the models used in both
Ž .
methods ART and FD differ, see Figs. 2 and 3. Ž Since the ART sections in Fig. 6 are stacked
simi-. larly to the multiple-shot FD sections in Fig. 4 , the accuracy at the ends of the profile is obviously poor. In those parts with good fold coverage, we can see that, in spite of many limitations of the ART, men-tioned in Section 4, the main reflecting horizons, clearly seen mainly in the array FD data, are also present in the ART result.
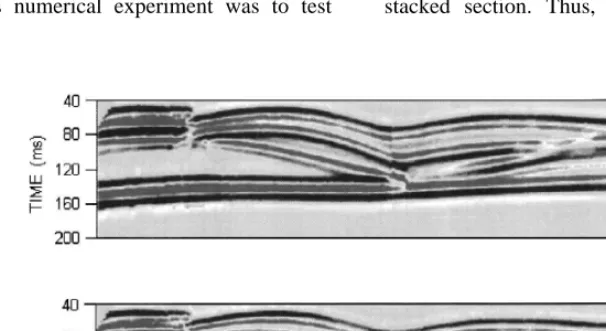
The next two figures, Figs. 7 and 8, compare synthetics and measured data. Fig. 7 shows the array FD CDP section, including the effects of the LVL Žbottom , with the measured data top . The bottom. Ž . section of Fig. 7 corresponds better to reality than
Ž .
the top section of Fig. 5 without the LVL . We clearly see the reverberations due to the LVL. Al-though they are more continuous, they are similar, at least qualitatively, to those seen in the real stack. The bedrock reflections, seen at the bottom right of the measured data, were deliberately not included in the FD modelling. As expected, the synthetics are
Ž .
clearer not so noisy than the measured data. The
reflection marked ‘lign3’ in Fig. 1 is modelled rela-tively well by the FD approach, at least in the left-hand part of the profile. Reflection ‘lign2’ can also be identified in the FD data, but it is much weaker there. This could be caused by the ‘lign2’ layer being in reality very inhomogeneous,
com-Ž .
posed of many thin layers borehole data . These thin layers may enhance the reflection due to some inter-ference effects. Reflection ‘lign1’, although much weaker and obscured by noise in the measured data, also seems to be in the correct position in the FD stack.
Ž .
Fig. 8 shows the measured data top versus the
Ž .
ART CDP section bottom . In the ART section, only the minimum number of multiple reflections
Ž .
within the LVL was considered compare Fig. 6 . Although the differences between the measured and ART data are significant, we can also see many similarities. For example, the bedrock reflection and the reflection from the 3rd lignite layer on the left-hand side of the profile are modelled relatively well. The ‘lign2’ layer, marked in Fig. 1, can also be found in the ART sections. The ‘lign1’ layer is also seen in the ART synthetics, and even the fault is displayed clearly.
The preliminary interpretation of the measured section offers several possibilities of explaining the strong reflection marked as ‘lign2’ in Fig. 1. One
Ž possibility is the existence of a lignite layer 2nd
.
lignite layer in Table 1 , but other interpretations are
Ž . Ž .
Ž . Ž .
Fig. 8. The real stacked section top and the multiple-shot ART CDP stack, with smaller number of multiples within the LVL bottom .
Ž
also possible e.g., the effect of converted waves .
reflected from the ‘lign1’ layer, etc. . One of the
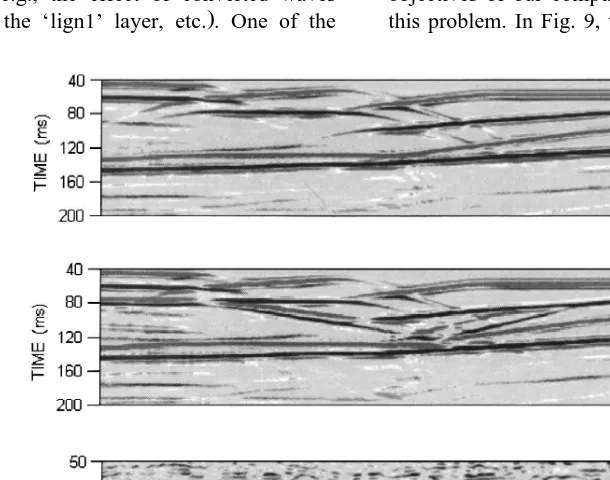
objectives of our computations was to contribute to this problem. In Fig. 9, top, we have considered the
Ž . Ž .
Fig. 9. The array FD CDP sections for the models without LVL and without top and with middle the 2nd lignite layer compared with the
Ž .
FD block model but without the 2nd lignite layer, i.e., the layer was replaced by the same material as that in the 2nd NLL in Table 1. Fig. 9, middle,
Ž corresponds to the FD block model of Fig. 2 i.e.,
.
including the 2nd lignite layer . The figure allows us to identify the reflections from the top and base of the 2nd lignite layer. On comparing the synthetics in Fig. 9 top and middle with the measured section ŽFig. 9, bottom , we can conclude that the section. including the 2nd lignite layer is closer to the real CDP stack. This suggests that ‘lign2’ does exist in reality. This conclusion can be supported by also
Ž .
taking into account ray synthetics Figs. 6 and 8 where 2nd lignite layer could be identified too.
6. Concluding remarks
The presented numerical study resulted both in certain site-specific findings and in several methodi-cal conclusions applicable to elastic modelling of shallow lignite deposits. Let us summarize them briefly as follows.
Ž .1 The multiple-shot FD CDP sections resemble the measured section in many respects.
Ž .2 The array FD modelling is an efficient approx-imation of the multiple-shot FD stack. Its cost is the same as that of a single-shot FD calculation.
Ž .3 The array FD modelling yields a clearer sec-tion than the multiple-shot FD stack. This perhaps makes the section too simple compared to theAnoisyB multiple-shot FD stack, thus resembling more the ART result. However, this allows the individual horizons in the FD stack to be identified more easily. Ž .4 Since the ray modelling is very fast, multiple-shot CDP stacks for a very large number of multiple-shot points can be produced much more easily in the ART than in FD modelling. Neither is a long time window a principal problem for the ART. The multi-ple-shot coverage smoothens the singularities of the ART wave field. Some of the LVL effects, such as multiple reflections from the base of the LVL, can also be modelled by the ART, but at the price of dramatically increasing computer time.
Ž .5 Considering the complexity of the studied model, it may be surprising that the ART CDP stacks Ž display many similarities with the FD stacks in
. particular with the array FD stacks .
Ž .6 At the Domenico site, both the ART and FD sections indicated the existence of the intermediate Align2Blayer, as well as the presence of a fault in the 1st lignite layer.
Ž .7 The synthetic models also indicate that many apparent horizons of the measured section may be due to the LVL effects that cannot be eliminated by routine processing because of lateral heterogeneities. The LVL may also obscure the picture of the shal-lowest lignite layer.
Acknowledgements
The authors thank G.A. Tselentis, director of Seismological Laboratory, University of Patras, for supporting this work and providing the data within the NATO Science for Stability Programme, the GR-COAL grant. This work has been partially sup-ported also by the Czech Republic Grant Agency Ž205r00r0902 , and the NATO Science Fellowship. of the first author. The authors wish to thank to K.
ˇ
Zacek for technical assistance with final adjustment
´ˇ
of figures.References
ˇ
Cerveny, V., Klimes, L., Psencık, I., 1988. Complete seismic ray´ ˇ ˇ ˇ´ tracing in three-dimensional structures. In: Doornbos, D.J.
ŽEd. , Seismological Algorithms. Academic Press, New York,.
pp. 89–168.
Gochioco, L.M., 1992. Modeling studies of interference reflec-tions in thin-layered media bounded by coal seams. Geo-physics 57, 1209–1216.
Graves, R.W., 1996. Simulating seismic wave propagation in 3D elastic media using staggered-grid finite differences. Bull. Seismol. Soc. Am. 86, 1091–1106.
ˇ
Jılek, P., Cerveny, V., 1996. Radiation patterns of point sources´ ´ situated close to structural interfaces and to the Earth’s sur-face. PAGEOPH 148, 175–225.
Moczo, P., Lucka, M., Kristek, J., Kristekova, M., 1999. 3D´ ´ displacement dinite differences and a combined memory opti-mization. Bull. Seismol. Soc. Am. 89, 69–79.
Moczo, P., Kristek, J., Halada, L., 2000. 3D 4th order staggered-grid finite-difference schemes: stability and staggered-grid dispersion. Bull. Seismol. Soc. Am. 90, in press.
Oprsal, I., Zahradnık, J., 1999. From unstable to stable seismicˇ ´
Ž .
´
Pietsch, K., Slusarczyk, R., 1992. The application of high-resolu-tion seismics in Polish coal mining. Geophysics 57, 171–180. Zahradnık, J., 1995. Simple elastic finite-difference scheme. Bull.´
Seismol. Soc. Am. 85, 1879–1887.
Zahradnık, J., Hron, F., 1992. Robust finite-difference scheme for´ elastic waves on coarse grids. Studia Geoph. Geod. 36, 1–19.
Zahradnık, J., Bucha, V., 1998. Masking effects of subsurface´ layers on shallow reflecting horizons. J. Seismol. Explor. 7, 73–79.