AREAL FEATURE MATCHING BASED ON SIMILARITY USING CRITIC METHOD
Jiyoung Kima*, Kiyun Yu b
a Institute of Construction and Environmental Engineering, Seoul National University, Ganak-ro 1, Seoul, Korea - [email protected] b Dept. of Civil & Environmental Engineering, Seoul National University, Ganak-ro 1, Seoul, Korea - [email protected]
Commission VI, WG VI/4
KEY WORDS: Areal Feature Matching, Multi Criteria Decision Analysis, CRITIC, F-measure, Confusion
ABSTRACT:
In this paper, we propose an areal feature matching method that can be applied for many-to-many matching, which involves matching a simple entity with an aggregate of several polygons or two aggregates of several polygons with fewer user intervention. To this end, an affine transformation is applied to two datasets by using polygon pairs for which the building name is the same. Then, two datasets are overlaid with intersected polygon pairs that are selected as candidate matching pairs. If many polygons intersect at this time, we calculate the inclusion function between such polygons. When the value is more than 0.4, many of the polygons are aggregated as single polygons by using a convex hull. Finally, the shape similarity is calculated between the candidate pairs according to the linear sum of the weights computed in CRITIC method and the position similarity, shape ratio similarity, and overlap similarity. The candidate pairs for which the value of the shape similarity is more than 0.7 are determined as matching pairs. We applied the method to two geospatial datasets: the digital topographic map and the KAIS map in South Korea. As a result, the visual evaluation showed two polygons that had been well detected by using the proposed method. The statistical evaluation indicates that the proposed method is accurate when using our test dataset with a high F-measure of 0.91.
1. INTRODUCTION
It is important to conflate different geospatial datasets to reduce maintenance and renewal costs because many public and private geospatial data repositories are saved and managed for use in Geographic Information Systems (GIS). At this time, the main task involves searching for pairs of matching objects in different datasets according to different construction times and unit objects in GIS.
A general method to detect matching pairs is manually identified for each dataset (Kokla, 2006). However, it is necessary for the method to automatically detect pairs of matching objects because it is difficult to apply a manual method on large geospatial datasets (Duckham and Worboys, 2005). Most geometric conflation methods use point or line features, but direct matching between areal features is rarely used (Guo et al., 2008; Huang et al., 2010; Zhang, 2002). However objects in the real world, such as buildings, parcels and rivers can be considered as areal features, and these points and lines should be conflated after changing areal features into points or lines, such as centroids and segments of areal feature, which are parts of the original areal features but have not been linked the original areal features (Liu, 2006). Therefore a direct conflation between areal features is necessary, and at this time, we cannot assess the geometrical quality of areal features through the use of only one measure since each measure provides information that others do not. However, it is necessary to combine multiple criteria between areal features in order to achieve a correct assessment (Bel Hadj Ali, 2001). Therefore, we propose an areal features matching method that can be applied in many-to-many matching that matches a simple entity with the aggregate of several polygons or two aggregates of several polygons with little user intervention.
* Corresponding author
2. AREAL FEATURE MATCHING ALGORITHM
The proposed method for conflating different geospatial datasets is comprised of three steps.
STEP 1: Two geospatial datasets are aligned using a similarity transformation to minimize the positional error between two datasets by using pairs of overlaid areal feature that have the same building name as the control points. At this time, the RMSE is less than 0.7m, which is the positional accuracy as a national rule to generate a digital topographic map.
STEP 2: Two areal features that intersect from the reference dataset and the target dataset, that is, the two datasets that have been transformed, are selected as the matching candidate pair. If the intersected polygons is an aggregate or two aggregates of several polygons, such as 1:N, M:N, N:1, these are calculated using an inclusion function, as in Eq.1(Vauglin and Bel Hadj Ali, 1998). If two polygons have a value of the inclusion function [I(A,B)] of more than 0.4 as the threshold by learning, one polygon is intersected by one more than polygons or many polygons are intersected by many polygons. These polygons are transformed into only one areal feature by using a convex hull, that is, the boundary of these polygons. Here, A and B are two polygons in different geospatial datasets.
I(A, B) = ����(�∩�)
Min (����(�), ����(�)) (1)
STEP 3: We find the matching pairs by determining the similarities among all matching candidate pairs assuming that A and B are two polygons in the matching candidate pairs.
The criteria to determine the similarity consists of:
The International Archives of the Photogrammetry, Remote Sensing and Spatial Information Sciences, Volume XL-2/W4, 2015 Joint International Geoinformation Conference 2015, 28–30 October 2015, Kuala Lumpur, Malaysia
This contribution has been peer-reviewed.
(1) Positional similarity
Positional similarity measures the distance between the centroid of two polygons, A and B. The positional similarity between A and B can be indicated as:
PS(A, B) = 1− ����(�∩�)
Max (����(��), ����(��)) (2)
where the centroid distance is defined as the Euclidean distance, ����(��,��) = �(�1− �2)2+ (�1− �2)2, from the centroid of A, ��(�1,�1), to the centroid of B, ��(�2,�2).
If PS(A, B) is close to 1, B is determined as a possible match for A.
(2) Shape ration similarity
Shape ratio similarity of two polygons is defined as:
���(A, B) = 1− ��(�,�)
Max (��(�, �) ) (3)
where SR(A, B) is the shape ratio between the A and B polygons. The shape ratio, SR(A, B), is defined to describe the shape characteristics of a polygon. The shape ratio defined in this paper is equal to:
��(�, B) =����������(�) 2��×����(�)−
���������(�)
2������(�)� (4)
where ����(�) is the area of polygon A, and ���������(�) is the perimeter of polygon A.
If SRS(A, B) is close to 1, B is determined as a possible match for A.
(3) Overlap similarity
The overlap similarity between A and B can be indicated as:
OS(A, B) = 1− �������(�,�)
Max (�������(�,�)) (5)
where �������(�,�) is the overlapped area for A and B and is defined as:
overlaop(A, B) =�����(�∪�)−����(�∩�)
����(A∪�) � (6)
where ����(�) is the area of polygon A.
If OS(A, B) is close to 1, B is determined as possible a match for A.
(4) Shape similarity
The shape similarity is defined as the weight linear sum of the positional similarity, shape ratio similarity, and overlap similarity. In order to determine the weights that can be handled with multiple criteria by using a decision analysis approach, treating as criteria the various performance measures and as alternatives the firms to be ranked. In particular, the criteria with the greatest contrast are weighted more since these have more power to explain variability between alternatives than do criteria with little or no dispersal. As a result, we apply the CRITIC (CRiteria Importance Through Intercriteria Correlation) method that takes into account both the contrast intensity and the conflicting
character of the performance measures (Diakoulaki et al., 1995). Therefore, the shape similarity (SS(A, B)) in this paper can be denoted as:
SS(A, B) =�1×��(�,�) +�2× SRS(A, B) +�3×��(�,�) (7)
where the weight (��) is defined as ��= ��
∑��=1��. At this time,
�� combines the concepts of the contrast intensity and conflict in the following expression: ��= �� × ∑��=1(1− ���) where �� is the standard deviation of the jth criterion (contrast intensity) and ��� is the linear correlation coefficient between criteria j and k (conflict). If the shape similarity which is fused with other criteria is greater than a certain threshold, B is determined as a possible match for A and will be placed in the matching set for A. In this paper, 0.7 is used as the threshold by learning.
3. TEST AND RESULTS
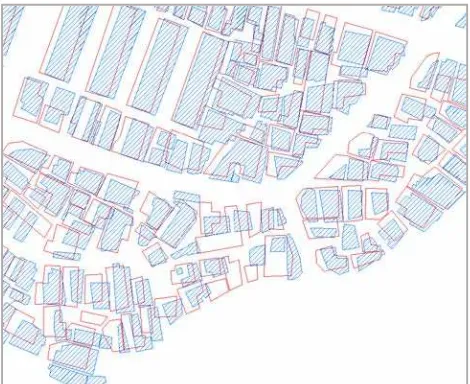
The proposed method is applied for 157 buildings (Reference data) from digital topography and 151 buildings (Target data) from the KAIS map that is used as the base map in the address system. These were produced in 2002 and 2011, respectively (Figure 1). In advance, 125 matching pairs (reference) were manually selected by comparing an aerial photograph in order to evaluate the accuracy.
Figure 1. Test datasets(Red: Digital topographic map, Blue: KAIS map)
Firstly, 32 polygon pairs which is the same building name among polygons intersected in two geospatial datasets were randomly extracted (Figure 2). The extracted polygons were transformed into centroids, and then two datasets were aligned by similarity transformation by using these centroids(RMSE=0.654).
The International Archives of the Photogrammetry, Remote Sensing and Spatial Information Sciences, Volume XL-2/W4, 2015 Joint International Geoinformation Conference 2015, 28–30 October 2015, Kuala Lumpur, Malaysia
This contribution has been peer-reviewed.
Figure 2. Areal Features that are same building name in different spatial datasets
Second, the two datasets that were transformed were overlaid and then an inclusion function was applied between the intersected polygons. At this time, several polygons were aggregated as a single polygon by generating convex hulls of the intersected polygons for which the inclusion function was more than 0.4 (Figure 3, thick lines).
Figure 3. Changing several polygons into a single feature (thick line)
The weight (ω) of each criterion was computed by using the CRITIC method, as in Table 1, and the overlap similarity (OS(A, B)) was most important when determining the shape similarity in this paper.
Table 1. Weight of each criterion using the CRITIC method
PS(A, B) SRS(A, B) OS(A, B) σ ω
PS(A, B) 1 0.43 0.87 0.219 0.255
SRS(A, B) 0.43 1 0.43 0.202 0.380
OS(A, B) 0.87 0.43 1 0.315 0.365
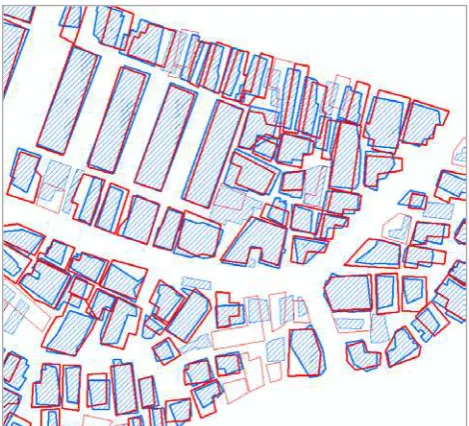
In order to assess the accuracy of the proposed method, we carried out a visual and a statistical evaluation. First, we confirmed that the two polygons that comprised a large intersected area were determined as matching pairs through a visual evaluation. Also the matching pairs in areas with a high polygon density were well detected (Figure 4).
Finally, the most popular method for that measurement is the F-measure for ontology-matching of a statistical evaluation (Euzenat and Shvaiki, 2007). The F-measure (�0.5) combines two criteria: precision (����,���) and recall (R���,���), as in Eq. 8, and the great value of the F-measure means that it is a good matching method.
�0.5= ����
,�������,���
0.5����,���+0.5����,��� (8)
�� is the ith matching object detected in the digital topographic map, and �� is the jth matching object detected in the digital topographic map. The precision (����,���) and recall (R���,���) are expressed as:
����,���= ��. ���������������
��. ��������������� (9)
����,���= ��. ���������������
��. ����������� (10)
As a result, the F-measure is 0.91 with precision and recall of the detected matching pairs of 0.87 and 0.95, respectively (Table 2).
Table 2. Statistical evaluation of the detected matching pairs
No. of detected
pairs
No. reference
No. of true detection
P R �0.5
143 125 101 0.87 0.95 0.91
Therefore, the visual and statistical evaluations indicated that the proposed method has the ability to detect matching pairs between two geospatial datasets.
Figure 4. Visual evaluation of the matching pairs that were detected (thick lines)
4. CONCLUSION
In this paper, we have proposed a new method to detect matching pairs between two areal features with shape similarity in different geospatial datasets with fewer user intervention. To this end, an affine transformation was applied to two datasets by using polygon pairs for which the building name is the same. Then, the two datasets were overlaid, and at this time, the intersected polygon pairs were selected as candidate matching pairs. However, when one polygon intersected more than two polygons or several polygons intersected more than two polygons, the
The International Archives of the Photogrammetry, Remote Sensing and Spatial Information Sciences, Volume XL-2/W4, 2015 Joint International Geoinformation Conference 2015, 28–30 October 2015, Kuala Lumpur, Malaysia
This contribution has been peer-reviewed.
inclusion function was computed. The objects for which this value is more than 0.4 in the two datasets were aggregated, and convex hulls were generated. Finally, we calculated the shape similarity between the candidate pairs in the two datasets through a linear sum of the weight computed using the CRITIC method and three criteria: positional similarity, shape ratio similarity, and overlap similarity. A visual evaluation showed that two polygons were well detected using the proposed method. The statistical evaluation indicates that the proposed method is accurate in our test dataset with a high F-measure of 0.91.
However, we applied this method to a small area with a few objects. Therefore, the proposed method should be applied to a larger area with many objects to properly evaluate its accuracy.
ACKNOWLEDGEMENTS
This work was supported by the ICT R&D program of MSIP/IITP. [B0101-15-1349, Development of Volunteered Geospatial Information Platform Technology and Application for the Elderly and Disabled.
REFERENCES
Bel Hadj Ali, A., 2001, Positional and shape quality of areal entities in geographic databases: quality information aggregation versus measures classification, In: ECSQARU‘'2001 Workshop on Spatio-Temporal Reasoning and Geographic Information Systems, Toulouse, France, pp. 1-16.
Diakoulaki, D., Mavrotas, G. and Papayannakis, L., 1995, Determining objective weights in multiple criteria problems: the CRITIC method, Computers & Operational Research, 22(7), pp. 763-770.
Duckham, M. and Worboys, M, 2005, An algebraic approach to automated geospatial information fusion, International Journal of Geographical Information Science, 19(5), pp. 537-557.
Euzenat, J. and Shvaiki, P., 2007, Ontology matching Sciences. Springer, Berlin.
Guo, L., Cui, T., Zheng, H. and Wang, H., 2008, Arithmetic for area vector spatial data matching on spatial direction similarity, Journal of Geomatics Science and Technology, 25(5), pp. 380-382.
Huang, L., Wang, S., Ye, Y., Wang, B. and Wu, L, 2010, Feature matching in cadastral map integration with a case study of Beijing, In: 2010 18th International Conference on Geoinformatics, Peking University, Beijing, China, pp. 1-4.
Kokla, M., 2006, Guidelines on Geographic ontology integration, In: The ISPRS technical commission Ⅱ symposium, Vienna, Austria, pp.67-72.
Liu, Z., 2006, The research on areal feature matching among the conflation of urban geographic databases, Master thesis, University of Wuhan, Wuhan.
Vauglin, F., and Bel Hadj Ali, A., 1998, Geometric matching of polygonal surfaces in GIS, Proceedings of the ASPRS-RTI
Zhang, Q., 2002, Research on feature matching and conflation of geographic databases, PhD dissertation, University of Wuhan, Wuhan.
The International Archives of the Photogrammetry, Remote Sensing and Spatial Information Sciences, Volume XL-2/W4, 2015 Joint International Geoinformation Conference 2015, 28–30 October 2015, Kuala Lumpur, Malaysia
This contribution has been peer-reviewed.