PROBABILISTIC MULTI-PERSON TRACKING USING DYNAMIC BAYES NETWORKS
T. Klinger, F. Rottensteiner, C. Heipke
Institute of Photogrammetry and GeoInformation, Leibniz Universit¨at Hannover, Germany -(klinger, rottensteiner, heipke)@ipi.uni-hannover.de
KEY WORDS:Bayes network, Classification, Pedestrians, Tracking, Online, Video
ABSTRACT:
Tracking-by-detection is a widely used practice in recent tracking systems. These usually rely on independent single frame detections that are handled as observations in a recursive estimation framework. If these observations are imprecise the generated trajectory is prone to be updated towards a wrong position. In contrary to existing methods our novel approach uses a Dynamic Bayes Network in which the state vector of a recursive Bayes filter, as well as the location of the tracked object in the image are modelled as unknowns. These unknowns are estimated in a probabilistic framework taking into account a dynamic model, and a state-of-the-art pedestrian detector and classifier. The classifier is based on the Random Forest-algorithm and is capable of being trained incrementally so that new training samples can be incorporated at runtime. This allows the classifier to adapt to the changing appearance of a target and to unlearn outdated features. The approach is evaluated on a publicly available benchmark. The results confirm that our approach is well suited for tracking pedestrians over long distances while at the same time achieving comparatively good geometric accuracy.
1. INTRODUCTION
Pedestrian detection and tracking is one of the most active re-search topics in the fields of image sequence analysis and com-puter vision. The aim of tracking is to establish correspondences between target locations over time and hence it is widely used for the semantic interpretation of an image sequence. Many avail-able systems apply object detection in single frames, an associa-tion step (linking detecassocia-tions to trajectories) and recursive filtering to find a compromise between image based measurements (i.e., automatic pedestrian detections) and a motion model. If the as-sociation step is solved, the position of an object, detected in the image, is integrated into the recursive filter as a measurement. If a measurement is imprecise, the generated trajectory is prone to be updated towards a wrong position. While most methods for track-ing are concerned with a correct assignment of objects, where an assignment counts as correct if an intersection-over-union score (Everingham et al., 2010) threshold of 50%is exceeded, only few papers address the geometric accuracy of a detection. How-ever, geometric accuracy is essential for many realistic applica-tions like motion analysis in sports sciences, the analysis of in-teractions of humans in video surveillance and driver assistance systems, where one has to decide whether a pedestrian does actu-ally enter a vehicle path or not.
Detection-based approaches to tracking typically use classifiers to discriminate the considered object classes. Existing approaches differ by the number of classes (binary versus multi-class) and in the way the training is carried out (online vs. offline). Bi-nary classifiers trained offline typically deliver positive detec-tions represented by surrounding rectangles in several nearby po-sitions and scales in the vicinity of the true position of an object. Usually, adjacent rectangles are grouped and non-maximum sup-pression is applied after the classification step (Dalal and Triggs, 2005), (Felzenszwalb et al., 2010), (Doll´ar et al., 2010). The actual task of tracking is then to associate the single-frame de-tections between consecutive time steps, for which a data asso-ciation problem must be solved. In contrast to these methods, classifiers that are trained online specialise in the appearance of individual targets at runtime. For this purpose classifiers based on variants of Random Forests (Breiman, 2001), (Saffari et al., 2009), (Kalal et al., 2010), Hough Forests (Gall and
Lempit-sky, 2013) and boosting (Breitenstein et al., 2011), (Godec et al., 2011) are used. These approaches adapt well to gradual changes in a target’s appearance, but depend on additional information about novel pedestrians entering a scene, and they are quickly distracted from the actual target if the training data was derived from mis-aligned samples. Also, the bounding rectangles used in detection-based approaches may easily be misaligned due to par-tial occlusions, non-rigid body motion, illumination effects and other disturbing effects. In a comprehensive study, Doll´ar et al. (2011) show that the recall rates of 16 different pedestrian detec-tors decrease rapidly if the intersection-over-union score thresh-old is increased. A better alignment of the detection result to the real object boundaries is for instance achieved by finer segmenta-tion, based on pixels (Dai and Hoiem, 2012), superpixels (Shu et al., 2013), interest points (Ommer et al., 2009), (Gall and Lempit-sky, 2013), object parts (Felzenszwalb et al., 2010), (Benfold and Reid, 2011) or contour models (Leibe et al., 2005), (Gavrila and Munder, 2007). Such models have the advantage of being more robust against partial occlusions compared to a holistic model. If the relative position of an object part from the reference point of the object is known, a correct localisation of the object is possi-ble, even if only a subset of the parts is visible.
Most trackers use variants of the recursive Bayes Filter such as the Kalman- or the Particle Filter to find a compromise between image-based measurements and a motion model. Generally, the motion model is a realisation of a first-order Markov chain which considers the expected dynamical behaviour (e.g. constant veloc-ity and smooth motion). In case of an occlusion, i.e. if no mea-surement can be obtained, the trajectory is continued only by the motion model, and spatio-temporal consistency of the generated trajectory can be preserved. For longer intervals of occlusion, however, a first-order Markov chain is prone to drift away from the actual target position. In this context, (Pellegrini et al., 2009) involve higher order motion models for each object to keep track of the intended destination of the target. To account for physical exclusions of the 3D position of two or more objects, the predic-tion is based on the current posipredic-tion and velocity estimates of all targets. Leal-Taix´e et al. (2011) also consider groups of people walking together and try to model the social avoidance and at-traction forces between the involved objects. This paper applies global optimisation of the trajectories, which makes the approach unsuitable for real-time applications.
Our main insight is that state-of-the art results can be obtained by methods that use variants of Bayes networks in one of two possible approaches: Either they apply single-frame inference of several variables, or they use multi-temporal models, i.e. a re-cursive Bayes Filter, over different time steps with single state variables. Our contribution is the proposal and investigation of an approach based on Dynamic Bayes Networks (DBN), see Russell et al. (1995), which unifies the abilities of modelling sequences of variables and state variables in a factorised form. Our method is dedicated to online multi-person tracking in monoscopic im-age sequences. The DBN combines results of classifiers trained online, category-specific object detectors and recursive filtering. We show that the geometric accuracy can be improved by treating both the state variables in object space and the position of pedes-trians in the images as unknown variables. The method is eval-uated on a Multiple Object Tracking benchmark dataset, which allows us to compare to other state of the art methods.
2. METHOD
The proposed method consists of a Dynamic Bayes Network which combines the results of a pedestrian detector, recursive filtering and an instance-specific classifier with online training capability in a single probabilistic tracking-by-detection frame-work. The hidden variables of the system are the state parameters related to the position and velocity of each pedestrian in world coordinates as well as the pedestrian’s position in the image. By modelling the parameters related to the pedestrian’s position in the image by hidden variables, our method allows the detection to be corrected before it is incorporated into the recursive filter. In this way, the proposed method carries out the update step of the recursive filter with an improved detection result, leading to a more precise posterior position, which in turn leads to a more precise prediction in the next iteration and decreases the search radius for new trajectory associations and training samples for the online classifier. One such graphical model is constructed for each pedestrian independently of other pedestrians. The ap-proach is made applicable to multi-object tracking by solving an association problem prior to the actual trajectory continuation. To account for static scene elements and to achieve viewpoint inde-pendent results, the image-based observations are transferred to a common 3D coordinate system, where the actual filter is applied. The coordinate system is centred at the projection center of the camera (at timek0in case of a moving platform) with theXand Zaxes pointing in horizontal directions andY in the vertical di-rection (right-handed system). To enable monocular tracking in
Time step k
Figure 1. Dynamic Bayes Network for pedestrian tracking. The nodes represent random variables, the edges model dependencies between them. The meaning of the variables is briefly explained on the right and in detail in the text.
3D, we presume a ground plane at a constant height below the camera and expect that pedestrians only move along that plane.
2.1 Dynamic Bayes Network
Following the standard notation for graphical models (Bishop, 2006), the network structure of the proposed DBN is depicted in Figure 1. The DBN represents a first-order Markov process, so that each variable has parents only in the same or in the preceding time step. The small solid circles represent deterministic parame-ters and the larger circles random variables, where the grey nodes correspond to observed and the white ones to unknown parame-ters. One such graphical model is constructed for each tracked pedestrian. The system statewk,i, the unknown image position
zk,i,F of the feet, the image position of the feetcdetk,i,F (observed by the person detector) andcRF
k,i (observed by the classifier) and the image position of the headcdet
k,i,Hare modelled individually for each personi. All other variables are either defined for an entire image frame (if denoted by a subscript kindicating the time step), or for the entire sequence. The joint probability den-sity function (pdf) of the variables involved can be factorised in accordance with the network structure:
P(zk,i,F,wk,i,wk−1,i, cdetk,i,H, c
In the following the variables considered in our approach are ex-plained in detail. The subscriptkis omitted in the remainder of the paper where it is obvious.
Fixed variables. For tracking in 3D world coordinates a ground planeπ is defined as the (X,Z) plane at a known distanceYπ below the camera. The pedestrian positions are restricted to the ground plane, which enables monocular tracking in 3D (i.e., the unique conversion from 2D image coordinates to 3D world coor-dinates using the inverse collinearity equations with constantY). Moreover, the parametersCkof the interior and exterior camera orientation are considered to be given for every time stepk.
Unknown variables. The state vectorwi= [X, Y, Z, H,X,˙ Z˙]T
in the image, which is also modelled as a hidden variable, and to the position of the headcdeti,H = [xH, yH], which is observed, by conditional probability density functions. For the state vector and for the position of the feet we assume multi-variate normal distributions, so that we have for the initial step in time:
P(zi,F|wi, C) =N(µ
z,F,Σzz,F),
whereµz,F is a mean vector,Σzz,Fis a covariance matrix, and C are the parameters of the interior and exterior orientation of the camera. The functional relationship between the image and world coordinates is described by the collinearity equations (Eqs. 2-5), and an additional fictitious observationmF
π (Eq. 6) is in-troduced to model the assumption that pedestrians stand on the ground plane.
In Eqs. 2-5x0andy0are the coordinates of the principal point and c is the focal length of the camera. rij are the elements of the rotation matrix between image and reference frame and X0, Y0, Z0denote the perspective centre of the camera.mFx and mF
y denote the measurement functions for the image coordinates of the feet andmHx andmHy those for the image coordinates of the head. The position of the feet is further related to observed variables in the image, see below.cdeti,Handzi,Fare the top centre and bottom centre position of the rectangle surrounding a person, respectively. The width-to-height ratio of this rectangle is the ra-tio of the initial detecra-tion. We refer tozi,F as the reference point of a personiin the image in the remainder of the paper. Furthermore, the state vector is related to the posterior state vec-torwk−1,iof the previous time step. For each object a velocity is estimated using the temporal model of a recursive filter that en-ables a prediction of the future state to narrow down the search space for new detections and to keep the state vector consistent over time. P(wk,i|wk−1,i, π) is given by the temporal model based on a first-order Markov chain (Eq. 7). Since the state vec-tor is modelled to follow a multi-variate normal distribution, the same holds true for the predicted stateP(wk,i|wk−1,i, π), captured by a zero-mean multi-variate normal distribution over
u = [aX, vY, aZ, vH]T with expectation E(u)=0 and
vH) (Welch and Bishop, 1995). These uncertainties are related to the covariance of the predicted state by the matrixG.
Observed variables. Three different observations are incorpo-rated in the model: The accumulated votes of a category-specific classifier trained on persons, voting for the image position of the head and for that of the feet, and the result of an instance-specific
classifier trained on individual persons at runtime.
Note that any person-detector usually delivers several adjacent positions around a true position of a person in scale-space. Given a set of rectangles as the result of the classifier, we associate these rectangles either to an existing trajectory or to a hypoth-esis about a new trajectory. A hypothhypoth-esis is each detection that does not overlap with an intersection-over-union score larger than 0.5with any predicted rectangle of a pedestrian that is already tracked, and that has a height of at least48pixels. For the asso-ciation of the (ungrouped) positive classification results, a simple nearest neighbour association in scale-space is applied. The con-fidence about the position of the head,P(cdeti,H|wi, C), and the feet,P(cdeti,F|zi,F), both initially set to zero for all pixels, is com-puted by means of a Kernel Density Estimation (KDE) with a constant Gaussian kernel (σx=σy=10pixels) centred at every top centre position (to vote for the head) and bottom centre posi-tion (to vote for the feet) of all rectangles associated to personi, respectively.
P(cdetk,i,H|wk,i, Ck) denotes the conditional probability density functions ofcdetk,i,H given that personiattains the statewk,iat timek,
P(cdetk,i,H|wk,i, Ck) =N(µc,H,Σcc,H)
We determine the Gaussian parameters of the head position
µc,H = [xH, yH]as the weighted sample mean of the density estimate given by the KDE with covarianceΣcc,H.
For the estimation of the reference point of the feet we introduce an additional observation based on an instance-specific classifier, which considers one class for each person and an additional class for the background. BycRFi we denote the position of the feet of personiobserved by an instance-specific classifier. We apply an online Random Forest (cf. Saffari et al., 2009). The Random Forest is trained with samples from an elliptic region with the target position as its reference point. The regions are normalised to a constant height of48pixelsand a width-to-height ratio of 0.5. Because training samples are initially rare, further positive training samples are taken from positions shifted by one pixel up, down, left and right from the reference point. Negative samples (for the background class) are taken from positions translated by half of the size of the ellipse in the same directions. The feature vector is composed of the RGB values inside the ellipse. Each time a trajectory is updated, we take positive training samples from the elliptic region with the new target position as its refer-ence point. To guarantee that the number of training samples is equal for every class, the classifier is trained anew with samples stored in a queue each time a new trajectory is initialised or ter-minated (see Sec. 2.3).
Classification deliversP(cRFi |zi,F)∝nn0i, whereniandn0are the relative frequencies of classiand the background class, re-spectively, assigned to the leaf nodes of all decision trees in the Random Forest to which the sample zi,F propagates.
P(cRFi |zi,F)is evaluated for every reference pointzi,F located within a search region (we take the99%-confidence ellipse of the predicted state) around the predicted position of theith person. P(cRFi |zi,F)and P(cdeti,F|zi,F)are the probabilities to observe cRFi andcdeti,F, respectively, ifzi,F is the reference point of the ith person in the image.
2.2 Inference
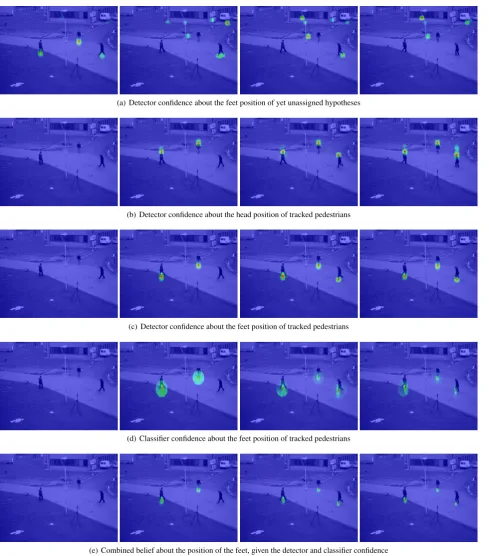
Bayes Network into a factor graph representation (Kschischang et al., 2001), see Fig. 2, and apply message passing according to Pearl (1988). The most probable state configuration is found in three steps, which are highlighted in colour in Fig. 2. Each factor node (square) corresponds to a function of the subset of variables that are connected to it. The arrows indicate forward (red) and backward (green) messages sent through the graph.
First, we compute the position of the feetµ′z,F = [xF, yF]given the observed variablescRFi andcdeti,Fas the weighted sample mean of the product of the observed pdfsP(cRFi |zi,F)andP(cdeti,F|zi,F) with the according sample covarianceΣzz,F.
P(z′
Second, the state vector is propagated in time using the tempo-ral model (Eq. 7) and corrected by incorporating the estimated position of the feet, the measured position of the head and the fic-titious observationYπ. The vector¯zi = [xF, yF, xH, yH, Yπ]T
is applied to the state vector using the update equation of an Ex-tended Kalman Filter (EKF) model (Eq. 9).
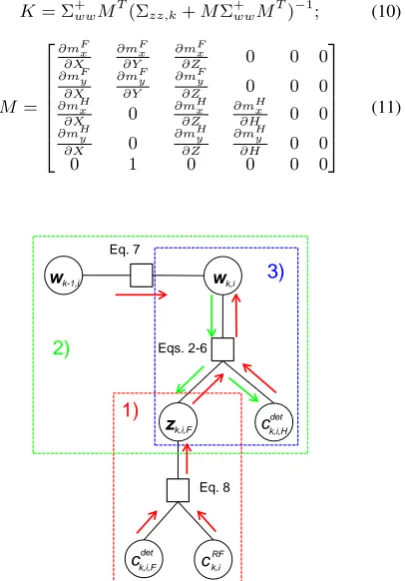
ˆ is the predicted state transformed to the observation space by the (non-linear) measurement Equations 2-6 andKis the Kalman Gain matrix (Eq. 10) withMthe Jacobian (Eq. 11) of the mea-surement equations.
Figure 2. Factor graph representation of the DBN.
(a) PETS09-S1L2 (b) PETS09-S2L1
Figure 3. Prior knowledge about the scene.
Third, the mean vector and covariance matrix of the corrected state are transformed back to the image domain using the mea-surement equations and the corresponding Jacobian, where they define the posterior image position of the feet and the head:
P(zi|wi, C) =N(µz, MΣwwMT),
where µz=[m F
x( ˆwi), mFy( ˆwi), mHx( ˆwi), mHy( ˆwi), mFπ( ˆwi)]. Finally, the online Random Forest is updated using new training samples taken from the ellipse withˆzF = [mF
x( ˆwi), mFy( ˆwi)] as reference point and a heightmFy( ˆwi)−mHy( ˆwi). The EKF update step is executed only if the person is not occluded (see Sec. 2.3).
2.3 Intitialisation and termination
At each time stepkthere exists a set of persons which have al-ready been tracked and a set of hypotheses about new candidates for tracking. The criterion for the generation of hypotheses is ex-plained in Sec. 2.1. In order to validate a hypothesis, we evaluate the confidence of a pedestrian detector about the presence of a person, as well as prior knowledge about the scene. We take a set of over-complete object detections (given by an arbitrary object detector), many of which usually yield clusters of positive results around each true position of a person in scale-space. We assume that each detection is generated either by a person which is al-ready tracked, by a new hypothesis or by a false positive detec-tion. In Sec. 2.1 we introducedP(cdetk,i,F|zk,i,F)as the likelihood of the observationcdetk,i,Fgiven thatzk,i,Fis the unknown position in the image. We further defineP(chypk |zhyp
k )as the likelihood of a pedestrian detectionchypk given that a new tracking candidate is present withzhyp
k as its reference point. Every detection is asso-ciated either to personior to a hypothesis, if a nearest neighbour criterion in scale-space is fulfilled and if the detection lies within the search space of the person (given by the confidence of the pre-dicted state) or that of a hypothesis (given by the confidence of an initial state). If the detection is not assigned to any person or to a hypothesis, it is considered as a false positive detection and is discarded. If an assignment is made, eitherP(cdet
k,i,F|zk,i,F)or P(chypk |zhyp
k )(both initially set to zero for all pixels) is increased by adding a Gaussian kernel withσx=σy=10pixelscentred at the reference point of the detection.
After all detections are either assigned or discarded, we validate each hypothesis h by assigning it a probability P(h|chyp,zhyp)
for being correct:
P(h|chyp,zhyp)∝P(chyp, h,zhyp)
=P(chyp|zhyp)P(zhyp|h)P(h)∝P(chyp|zhyp)P(h|zhyp).
(a) Detector confidence about the feet position of yet unassigned hypotheses
(b) Detector confidence about the head position of tracked pedestrians
(c) Detector confidence about the feet position of tracked pedestrians
(d) Classifier confidence about the feet position of tracked pedestrians
(e) Combined belief about the position of the feet, given the detector and classifier confidence
(f) Predicted (red), measured (yellow) and posterior (blue) position projected to the image and estimated bounding boxes (assigned random colours)
low high
Det. Method Recall Prec. FAF MT ML FP FN IDs Frag. MOTA MOTP
GT
(a) Full model 91.5 93.0 0.40 89.5% 0.0% 321 397 20 98 84.1 73.1
(b) without ORF 92.3 92.4 0.44 89.5% 0.0% 351 358 27 95 84.2 73.2
(c) without HOG 61.7 61.2 2.29 26.3% 0.0% 1818 1782 84 175 20.8 67.1
Aut.
(d) without prior 93.0 40.0 8.17 89.5% 0.0% 6493 325 31 62 -47.3 67.5
(e) Full model 88.3 80.0 1.29 84.2% 0.0% 1029 546 30 58 65.5 67.4
Table 1. Sensitivity study in 2D with ground truth (GT) and automatically generated (Aut.) detections
Det. Method Recall Prec. FAF MT ML FP FN IDs Frag. MOTA MOTP
GT
(a) Full model 96.5 98.1 0.11 94.7% 0.0% 89 165 21 29 94.1 76.1
(b) without ORF 97.1 97.3 0.16 94.7% 0.0% 126 133 28 21 93.8 75.4
(c) without HOG 56.0 55.5 2.62 15.8% 5.3% 2084 2048 86 96 9.3 50.7
Aut.
(d) without prior 96.4 41.4 7.97 100.0% 0.0% 6334 166 36 37 -40.6 75.5
(e) Full model 90.8 82.2 1.15 84.2% 0.0% 912 429 29 32 70.5 76.8
Table 2. Sensitivity study in 3D
HOG/SVM detector (Dalal and Triggs, 2005) in a training phase. The training samples are split into positive and negative sam-ples by validation with reference data, using an intersection-over-union score threshold of 50%. Classification then delivers the probability of a hypothesis to be correct given the position in the image. The distributions learned from the training sequences used in the experiments are visualised in Fig. 3.
A hypothesis is accepted if the posteriorP(h=true|chyp,zhyp) is greater than0.5. If this is the case, a new trajectory is initialised with the hypothesis-parameters used as starting values. The state parameters are computed from the reference point of the feet and the head in the image using the inverse collinearity equations with the height of the ground plane assigned toY and the initial height H is computed from the height (yF −yH) in the image with a scale estimate derived from the focal length of the camera and the 3D distance to the person. If no training data are available for a scene,P(zhyp|h=true)is set to a uniform distribution.
To account for mutual occlusions we evaluate the predicted states of all pedestrians and decide not to update the filter and the classi-fier if the predicted bounding rectangle of a person overlaps more than50%with any other personandif the image-row coordinate of the person is lower than that of the occluder (i.e, further behind in the scene). If a person leaves the image frame or if the trajec-tory is not updated for more than5frames in sequence, tracking of that person is stopped.
3. EXPERIMENTS
This section reports results using the proposed method on the 3D MOT 2015 Benchmark (Leal-Taix´e et al., 2015) which in-cludes the PETS09-S2L21and the AVG-TownCentre2sequences. The sensitivity of the method to the omission of single variables is evaluated on the PETS09-S2L1 dataset (available for train-ing in the 3D MOT 2015 Benchmark). The correspondtrain-ing sults of an evaluation in 2D image space (correct detection re-quires at least50%intersection-over-union score with the refer-ence) and in 3D world coordinates (correct detection requires at most1moffset in position) are reported in Tables 1 and 2, re-spectively. Furthermore, the average tracking results achieved on the test sequences are given in Table 3, where they are com-pared with related work. The reported metrics include the recall and precision scores, false alarms per frame (FAF), the ratio of mostly tracked (MT, a person is MT if tracked at least80%of the time being present in consecutive images) and mostly lost (ML, if tracked at most20%) tracking objects, the numbers of false positive (FP) and false negative (FN) detections, the number of
1http://www.cvg.reading.ac.uk/PETS2009/a.html 2http://www.robots.ox.ac.uk/ActiveVision/Research/ Projects/2009bbenfold_headpose/project.html
identity switches (IDs), the number of interruptions during the tracking of a person (Frag.) as well as the Multiple Object Track-ing Accuracy (MOTA) and Multiple Object TrackTrack-ing Precision (MOTP) of the CLEAR metrics defined by Bernardin and Stiefel-hagen (2008). The MOTA metric takes into account FP and FN assignments as well as ID switches. The MOTP metric reflects the geometric accuracy of the tracking results. The initial covari-ance of the filter state,Σww,k=0, is assigned withσX=σZ=0.3m, σY=0.01m,σH=0.03mandσX˙=σZ˙=0.3ms−1. To account for the process noise, we set σaX=σaZ=0.5ms−2, σvY=0.1ms−1 andσvH=0.2ms−1. σπ2is assigned a comparatively small value of1mm.
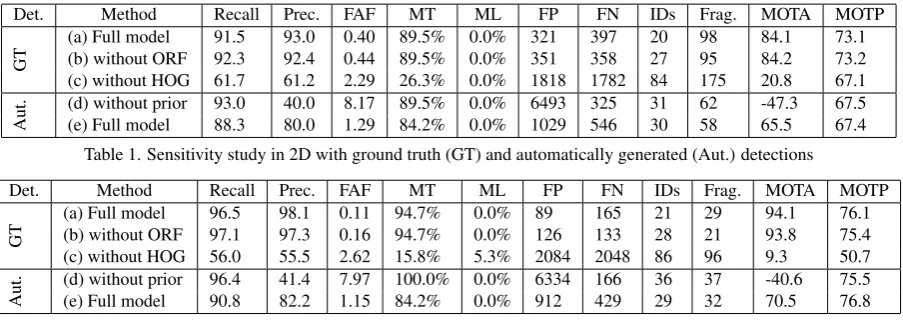
In Figure 4 the different probability densities that are part of the model are visualised. Each column in the figure depicts results from a different time step (from frame 1 to 4). Figures 4(a) de-pict the confidence of the person detector about new hypotheses that are not yet assigned to any trajectory. These confidences are used to validate new trajectories along with the prior scene infor-mation (see Sec. 2.3). Note that the confidence at the location of the right-most pedestrian in the image is lower than the con-fidence assigned to the others and does not exceed a threshold, so there is no trajectory initialised in the first frame. Figures 4(b) depict the confidences of the person detector about head positions of tracked persons in the image and Figures 4(c) those of the feet. Figures 4(d) show the confidence of the online classifier about the feet position of tracked pedestrians. Note that the distribu-tion is becoming narrower over time (i.e., from the left subfigure to the right), because further training samples arrive during run-time. Figures 4(e) show the combined confidence about the feet positions given the detection and classification result, and the pre-dicted state, which is used for gating the search area. Figures 4(f) depict the2.5σellipses of the predicted state projected into the image (red), the measurement derived from the densities shown in Figures 4(e) (yellow) and the posterior state (blue).
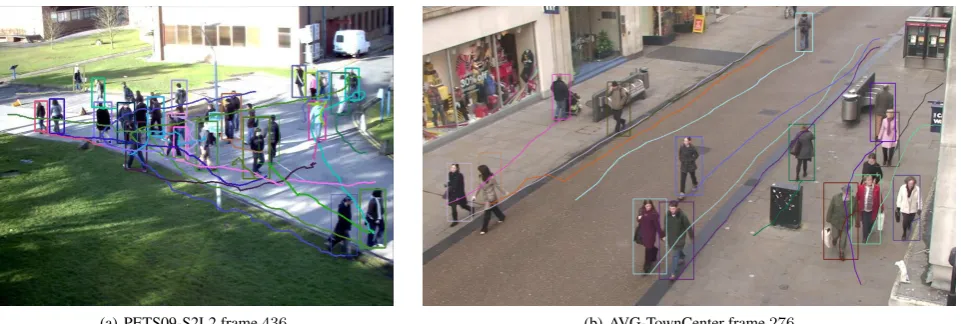
(a) PETS09-S2L2 frame436 (b) AVG-TownCenter frame276
Figure 5. Qualitative results shown for example images from the two test sequences.
Method Avg. Rank MOTA MOTP FAF MT ML FP FN IDs Frag. Hz
DBN (ours) 1.7 51.1 61.0 2.3 28.7% 17.9% 2077 5746 380 418 0.1
LPSFM 2.4 35.9 54.0 2.3 13.8% 21.6% 2031 8206 520 601 8.4
LP3D 2.8 35.9 53.3 4.0 20.9% 16.4% 3588 6593 580 659 83.5
KalmanSFM 3.1 25.0 53.6 3.6 6.7% 14.6% 3161 7599 1838 1686 30.6
Table 3. 3D MOT 2015 results
both lead to the same insights. If the initial position is given, the evaluation in the object space shows that96.5%of the pedestrians that are present in all frames are detected with at most1moffset from the true position, while98.1%of all automatic detections are correct. Furthermore,94.7%of the pedestrians are tracked in at least80%of the images in which they are present, and none less than20%. When not using the ORF to derive an additional observation of the target’s feet position (variant (b)), the number of identity switches (IDs) and false assignments (FAF) are higher than those achieved on the basis of the full model, while the other metrics do not change significantly. In variant(c), when the result of the person detector is omitted, the performance becomes worse in terms of all metrics. In variants(d) and(e)the hypotheses about new tracking candidates are derived from automatic pedes-trian detections. If all hypotheses are accepted without applying the validation step described in Sec. 2.3 (variant (d)), recall rates similar to those of variant (a) are achieved only at the cost of a strong decrease (of about50%) in the precision. If the validation step is carried out (variant (e)), the precision is superior to that of variant (d), while both recall and precision are only about10% worse than those achieved on the basis of variant (a). Thus we apply the full model with detections generated automatically for the comparative study.
In the comparative study the proposed method is evaluated against other results reported on the website3of the 3D MOT Benchmark. In favour of comparability, only detections which are publicly available along with the data set are used to generate new ob-ject hypotheses. The observed image positions of the feet com-puted from the detection results, however, are still comcom-puted from the outcomes of a HOG/SVM. The related work includes that of Leal-Taix´e et al. (2011), referred to as LPSFM, another yet unref-erenced approach by the same principal author based on network flow linear programming, referred to as LP3D, and Pellegrini et al. (2009), referred to as KalmanSFM. The results (Table 3) show that our method yields, with an average ranking of1.7, the best results in6of 10evaluation metrics. We achieve the best re-sults in the MOTA metric, which takes into account the number of FP detections (and equivalently the rate of false assignments
3http://motchallenge.net
per frame), where our method yields the second best score, and the number of FN detections and identity switches, where our method performs best. Our method also yields comparatively good results w.r.t. the persistence of tracking, which is reflected in the percentage of mostly tracked objects (28.7%) and in the number of fragmentations of the trajectories (418). On the down-side,17.9%of the pedestrians are not tracked for more than20% of the time being visible in the test sequences. As measured by the MOTP score of61.0, our methods also yields the highest ge-ometric accuracy among the compared methods. In Fig. 5(a) and 5(b) qualitative results are shown for exemplary images of both test sequences. Note that the rectangles align mostly well to the contours of the pedestrians.
Tracking is performed on a3.3GHz PC with8cores, where the runtime of our method performs with0.1Hz worst compared to the related work. This is mainly due to the repetitive training of the online Random Forest classifier every time a person enters or leaves the scene, to the pixel-wise classification in the vicinity of potential target positions, and to non-optimised code.
4. CONCLUSIONS
con-tinuation is applied jointly for all pedestrians. We will extend our model to jointly reason about the states of interacting pedestrians in future work.
References
Andriluka, M., Roth, S. and Schiele, B., 2008. People- tracking-by-detection and people-detection- by-tracking. In: Computer Vision and Pattern Recognition, 2008. CVPR 2008. IEEE Con-ference on, IEEE, pp. 1–8.
Benfold, B. and Reid, I., 2011. Stable multi-target tracking in real-time surveillance video. In: Computer Vision and Pat-tern Recognition (CVPR), 2011 IEEE Conference on, IEEE, pp. 3457–3464.
Bernardin, K. and Stiefelhagen, R., 2008. Evaluating multiple object tracking performance: the clear mot metrics. Journal on Image and Video Processing 2008, pp. 1.
Bishop, C., 2006. Pattern recognition and machine learning. Vol. 4, springer New York.
Breiman, L., 2001. Random forests. Machine learning 45(1), pp. 5–32.
Breitenstein, M., Reichlin, F., Leibe, B., Koller-Meier, E. and Van Gool, L., 2011. Online multi-person tracking-by-detection from a single, uncalibrated camera. IEEE Transactions on Pat-tern Analysis and Machine Intelligence 33(9), pp. 1820–1833.
Dai, Q. and Hoiem, D., 2012. Learning to localize detected ob-jects. In: Computer Vision and Pattern Recognition (CVPR), 2012 IEEE Conference on, IEEE, pp. 3322–3329.
Dalal, N. and Triggs, B., 2005. Histograms of oriented gradients for human detection. In: Computer Vision and Pattern Recog-nition, 2005. CVPR 2005. IEEE Computer Society Conference on, Vol. 1, IEEE, pp. 886–893.
Doll´ar, P., Belongie, S. and Perona, P., 2010. The fastest pedes-trian detector in the west. BMVC 2010, Aberystwyth, UK.
Doll´ar, P., Wojek, C., Schiele, B. and Perona, P., 2011. Pedestrian detection: An evaluation of the state of the art. IEEE Trans-actions on Pattern Analysis and Machine Intelligence, 34 (4). pp. 743–761.
Ess, A., Schindler, K., Leibe, B. and Van Gool, L., 2010. Object detection and tracking for autonomous navigation in dynamic environments. The International Journal of Robotics Research 29(14), pp. 1707–1725.
Everingham, M., Van Gool, L., Williams, C. K. I., Winn, J. and Zisserman, A., 2010. The pascal visual object classes (voc) challenge. International Journal of Computer Vision 88(2), pp. 303–338.
Felzenszwalb, P., Girshick, R., McAllester, D. and Ramanan, D., 2010. Object detection with discriminatively trained part-based models. Pattern Analysis and Machine Intelligence, IEEE Transactions on 32(9), pp. 1627–1645.
F¨orstner, W., 2013. Graphical models in geodesy and photogram-metry. PFG Photogrammetrie, Fernerkundung, Geoinforma-tion 2013(4), pp. 255–267.
Gall, J. and Lempitsky, V., 2013. Class-specific hough forests for object detection. In: Decision Forests for Computer Vision and Medical Image Analysis, Springer, pp. 143–157.
Gavrila, D. and Munder, S., 2007. Multi-cue pedestrian detection and tracking from a moving vehicle. International journal of computer vision 73(1), pp. 41–59.
Godec, M., Roth, P. M. and Bischof, H., 2011. Hough-based tracking of non-rigid objects. In: Computer Vision (ICCV), 2011 IEEE International Conference on, IEEE, pp. 81–88.
Hoiem, D., Efros, A. A. and Hebert, M., 2008. Putting objects in perspective. International Journal of Computer Vision 80(1), pp. 3–15.
Kalal, Z., Matas, J. and Mikolajczyk, K., 2010. Pn learning: Bootstrapping binary classifiers by structural constraints. In: Computer Vision and Pattern Recognition (CVPR), 2010 IEEE Conference on, IEEE, pp. 49–56.
Kschischang, F. R., Frey, B. J. and Loeliger, H.-A., 2001. Factor graphs and the sum-product algorithm. Information Theory, IEEE Transactions on 47(2), pp. 498–519.
Leal-Taix´e, L., Milan, A., Reid, I., Roth, S. and Schindler, K., 2015. MOTChallenge 2015: Towards a benchmark for multi-target tracking. arXiv:1504.01942 [cs.CV].
Leal-Taix´e, L., Pons-Moll, G. and Rosenhahn, B., 2011. Ev-erybody needs somebody: Modeling social and grouping be-havior on a linear programming multiple people tracker. In: Computer Vision Workshops (ICCV Workshops), 2011 IEEE International Conference on, IEEE, pp. 120–127.
Leibe, B., Seemann, E. and Schiele, B., 2005. Pedestrian de-tection in crowded scenes. In: Computer Vision and Pattern Recognition, 2005. CVPR 2005. IEEE Computer Society Con-ference on, Vol. 1, IEEE, pp. 878–885.
Milan, A., Roth, S. and Schindler, K., 2014. Continuous energy minimization for multi-target tracking. IEEE Transactions on Pattern Analysis and Machine Intelligence 36(1), pp. 58–72.
Ommer, B., Mader, T. and Buhmann, J. M., 2009. Seeing the objects behind the dots: Recognition in videos from a mov-ing camera. International Journal of Computer Vision 83(1), pp. 57–71.
Pearl, J., 1988. Probabilistic reasoning and artificial intelligence: Networks of plausible inference. San Mateo: Morgan Kau-famn.
Pellegrini, S., Ess, A., Schindler, K. and Van Gool, L., 2009. You’ll never walk alone: Modeling social behavior for multi-target tracking. In: Computer Vision, 2009 IEEE 12th Interna-tional Conference on, IEEE, pp. 261–268.
Russell, S., Norvig, P. and Intelligence, A., 1995. A modern approach. Artificial Intelligence. Prentice-Hall, Egnlewood Cliffs.
Saffari, A., Leistner, C., Santner, J., Godec, M. and Bischof, H., 2009. On-line random forests. In: Computer Vision Work-shops (ICCV WorkWork-shops), 2009 IEEE 12th International Con-ference on, IEEE, pp. 1393–1400.
Schindler, K., Ess, A., Leibe, B. and Van Gool, L., 2010. Au-tomatic detection and tracking of pedestrians from a moving stereo rig. ISPRS Journal of Photogrammetry and Remote Sensing 65(6), pp. 523–537.
Shu, G., Dehghan, A. and Shah, M., 2013. Improving an ob-ject detector and extracting regions using superpixels. In: Computer Vision and Pattern Recognition (CVPR), 2013 IEEE Conference on, IEEE, pp. 3721–3727.