ANALYSIS OF SCATTERING COMPONENTS FROM FULLY POLARIMETRIC SAR
IMAGES FOR IMPROVING ACCURACIES OF URBAN DENSITY ESTIMATION
J. Susaki∗
Department of Civil and Earth Resources Engineering, Graduate School of Engineering, Kyoto University, Japan [email protected]
Commission VII, WG VII/1
KEY WORDS:Urban scattering, fully polarimetric SAR, probability density function, normalization of scattering, four component decomposition
ABSTRACT:
In this paper, we analyze probability density functions (PDFs) of scatterings derived from fully polarimetric synthetic aperture radar (SAR) images for improving the accuracies of estimated urban density. We have reported a method for estimating urban density that uses an indexTv+cobtained by normalizing the sum of volume and helix scatteringsPv+c. Validation results showed that estimated
urban densities have a high correlation with building-to-land ratios (Kajimoto and Susaki, 2013b; Susaki et al., 2014). While the method is found to be effective for estimating urban density, it is not clear whyTv+cis more effective than indices derived from other
scatterings, such as surface or double-bounce scatterings, observed in urban areas. In this research, we focus on PDFs of scatterings derived from fully polarimetric SAR images in terms of scattering normalization. First, we introduce a theoretical PDF that assumes that image pixels have scatterers showing random backscattering. We then generate PDFs of scatterings derived from observations of concrete blocks with different orientation angles, and from a satellite-based fully polarimetric SAR image. The analysis of the PDFs and the derived statistics reveals that the curves of the PDFs ofPv+c are the most similar to the normal distribution among all the
scatterings derived from fully polarimetric SAR images. It was found thatTv+cworks most effectively because of its similarity to the
normal distribution.
1. INTRODUCTION
Land cover maps are one of the most useful products derived from remotely sensed images. Urban area maps, in particular, are valuable in understanding the status of human activities and discussing future directions of economic growth. Synthetic aper-ture radar (SAR) is capable of generating urban maps because it can detect backscattering from terrestrial objects, including arti-facts in urban areas. Some urban area classifiers using SAR im-ages have been proposed (Niu and Ban, 2012; Perissin and Wang, 2012; Esch et al. 2013).
To accurately extract urban areas and generate value-added the-matic maps from SAR images, an understanding of microwave surface scattering is indispensable. Polarimetric radar allows for more advanced microwave scattering models. The scattering ma-trix measured by polarimetric radar represents the complex pro-cess of electromagnetic interaction phenomena between the target structure and the emitted electromagnetic field (Lee and Pottier, 2009). Target decomposition approaches have been investigated to derive information from the objects of interest, and two ap-proaches have been widely applied. One is to use an eigenvec-tor or eigenvalues derived from covariance or coherency matrices (Cloude and Pottier, 1997). These matrices are generated from the originally obtained scattering matrix. The other is to apply a ”model-based” decomposition of the covariance matrix or co-herency matrix (Freeman and Durden, 1998; Yamaguchi et al., 2006). This approach assumes fundamental scatterings, such as surface scattering, double-bounce scattering, or volume scatter-ing. Following the scattering properties, each scattering is ex-pressed as a scattering matrix. Finally, the contribution of each scattering is determined by solving equations under several pa-rameter assumptions. This model-based approach contributes to
∗
Corresponding author.
understanding land surfaces in terms of their physical scattering properties.
In 2006, the Japan Aerospace Exploration Agency (JAXA) launched the first satellite-borne fully polarimetric SAR (PolSAR) sensor, the Advanced Land Observing Satellite (ALOS) / Phased Array type L-band SAR (PALSAR). This success promoted research using PolSAR images. From these data, urban areas are easily extracted by lessening the effects of the orientation angles of ob-jects against the radar beam (Kajimoto and Susaki, 2013a). The method utilizes volumetric scattering derived from four-component decomposition methods (Yamaguchi et al., 2011). In addition, a method was presented that estimates urban density from a fully PolSAR image (Kajimoto and Susaki, 2013b; Susaki et al., 2014). The method uses an indexTv+cobtained by normalizing the sum
of volume and helix scatteringsPv+c. Volume and helix
scatter-ings are generated by applying the four-component decomposi-tion method (Yamaguchi et al., 2011) to a fully PolSAR image. The validation results show that estimated urban densities have a high correlation with building-to-land ratios. However, build-ings return stronger surface or double-bounce scatterbuild-ings than volumetric or helix scatterings. It remains unclear why Tv+c
is more effective than indices derived from surface or double-bounce scatterings.
Another issue is that the proposed method may overestimate ur-ban densities of areas in which the polarimetric orientation angles (POAs) are almost 0◦
and strong backscattering is observed. The method normalizesPv+cby using the mean and standard
In this paper, we analyze PDFs of scatterings derived from fully PolSAR images for improving the accuracies of estimated urban density. The remainder of this paper is organized as follows. Our previous work related to estimating urban density and the method is described in Section 2. After a theoretical PDF of scattering is introduced in Section 3, the statistical characteristics of scattering obtained by the experiments are analyzed in Section 4. The im-plications of these results are then discussed in Section 5. Finally, Section 6 concludes the paper.
2. PREVIOUS WORK
2.1 Data Used
A previous study (Susaki et al., 2014) used fully polarimetric ALOS/PALSAR level 1.1 (L1.1) data. In this paper, we report the results of using data for New York City. The observation date was April 1, 2011. The image has slant-range coordinate data and a 21.5◦
off-nadir angle against the center of the scene. In addition, ALOS/Advanced Visible and Near Infrared Radiometer type-2 (AVNIR-2) optical sensor data were used as a reference.
2.2 Estimated Urban Density
The method for estimating urban density was as follows. We extracted urban areas by applying the method proposed by (Kaji-moto and Susaki, 2013a). Then, we applied a four component de-composition method that corrects POA angle effects (Yamaguchi et al., 2011). It was reported that a normalized combination of the volume scattering power and the helix scattering power (Tv+c)
shows the best correlation with both the building-to-land ratio and the floor area ratio (Equation (1) (Kajimoto and Susaki, 2013b). The normalization uses mean and standard deviation of the vol-ume scattering power and the helix scattering power (Pv+c). To
compare the status of urban development of global megacities, we extended the method that the meanµand standard deviation σshould be obtained via all study areas (Equations (2) and (3)).
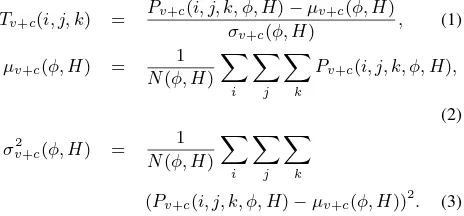
Tv+c(i, j, k) = Here,(i, j)is the localtion of the reference pixel,kis the SAR image number,φis POA,H is the POA type (homogeneous or heterogeneous POA) andNis the number of pixels.
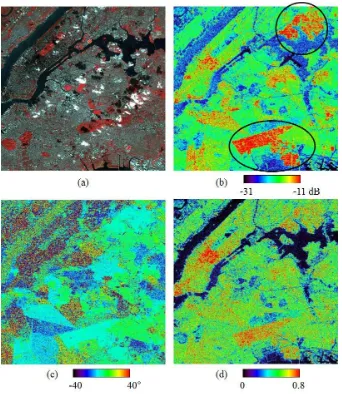
Figure 1 shows the estimated urban density of New York. The areas in a circle and an ellipse in Fig. 1(b) have relatively low-storied buildings according to other reference data (Open Street Map, 2014). Because the orientation angles of the buildings against radar are almost 0◦
, the total powers (T Ps) observed in these ar-eas are much higher than in nearby arar-eas. Hereafter, we refer to these areas as “high-T P areas.” Actual building-to-land ratios of the high-T P and nearby areas are similar. In Fig. 1(d), the contrasts of indices between the high-T P areas and the nearby areas were lessened, but the high-T P areas still have higher val-ues. Validation using the reference data confirmed that the urban densities of high-T P areas are overestimated.
Equation (1) normalizesPv+cby using the mean and standard
deviation. It is assumed that the PDF ofPv+c should follow a
normal distribution. Following the findings obtained from Fig. 1, our motivations are to examine the PDFs ofPv+cand other
scat-tering components for improving the accuracies of estimated ur-ban densities.
3. STATISTICAL FEATURES OF SAR IMAGES
Before examining actual PDFs of scattering obtained from im-ages, we derive the theoretical PDF of scattering.
3.1 Amplitude and Phase
We assume that a pixel in an SAR image has scatterers, with the amplitude and phase of scattereriexpressed asAiandφi,
re-spectively. The observed data of a pixel is expressed by Eq. (4):
VR+iVI=
∑
i
Aiexp(iφi). (4)
Here,VRandVIare the real and imaginary parts of the observed
data, respectively. BecauseVRandVIare sum of random
vari-ables, the PDFs ofVRandVIfollow a normal distribution.
p(VR) = √1
In addition, we assume that the means ofVRandVIare equal to
0, the variances are equal toσ2
, andVRandVIare independent.
Equation (8) is rewritten using amplitudeAand phaseφof the pixel data as
Equation (12) shows thatp(I) follows an exponential distribu-tion.
Figure 1. Urban density of New York estimated from a fully polarimetric PALSAR image. (a) AVNIR-2 image, (b)T P, (c) POA and (d)Tv+c. In the circle and ellipse of (b), where low-storied buildings are available, strong backscattering is observed because
the POAs are almost 0◦
. In (d),Tv+cwas calculated in the urban areas estimated by applying the method reported by Kajimoto
and Susaki (2013a). Each panel has a slant range coordinate system.
In the processing of SAR images, power is converted into decibel (dB) by Equation (13):
IdB= 10 log10I. (13)
Here, IdB has units of dB. The PDFp(IdB) is expressed by Equation (14).
p(IdB) = ln 10 20σ210
I′/10 ·exp
( −10
I′/10
2σ2 )
(14)
Here, I′
isIdB. Figure 2 shows curves of Equation (14) with different values ofσ. It shows that p(IdB) has a non-normal distribution. To quantitatively assess similarity of the PDFs to a normal distribution, we calculate the skew and kurtosis as
skew = E(X−µ)
3
σ3 , (15)
kurtosis = E(X−µ)
4
σ4 . (16)
Here, X, µ, and σare a variable, the mean, and the standard
deviation, respectively. The results are shown in Table 1. It is known that a PDF of normal distribution has a skew of 0 and kurtosis of 3. Table 1 shows that the PDF expressed by Equation (14) is regarded as a non-normal distribution.
σof mean standard skew kurtosis - 3 Equation (14) deviation
0.05 -25.46 5.43 -0.96 1.25
0.1 -19.48 5.52 -1.06 1.78
0.2 -13.47 5.55 -1.11 2.10
Table 1. Statistics of probability density functions expressed by Equation (14)
Figure 3. Measurement of scattering of blocks. The distance between the blocks and the orientation angle were
15 cm and 30◦
respectively.
4. EXPERIMENTS
4.1 Data Used
We used two datasets for analyzing the PDFs of scatterings of ur-ban areas. One is data obtained by an experiment in an anechoic radio wave chamber. The other is a satellite image, ALOS/PALSAR of New York. The details are described in Subsection 2.1.
For the first dataset, obtained on September 29, 2009, an experi-ment was carried out in the anechoic radio wave chamber at the Wave Engineering Laboratory of the Department of Information Engineering, Faculty of Engineering, Niigata University, Japan. The main purpose of this experiment was to examine how the ori-entation angle of targets affects the four components of scattering power. A polarimetric measurement system capable of synthetic aperture processing was used. The wave frequency was X-band (10 GHz), antenna height was 260 cm, and the incidence angle was 45◦
. Nine concrete rectangular blocks with 10×10 cm base area and 10 cm height were arranged on a 3×3 grid. The orienta-tion angle of the target structure is defined as 0◦
when the normal to the sides of the blocks is parallel to the sensor’s ground range direction. First, measurements were made with the structure at 0◦
, then the whole structure was rotated clockwise. Measure-ments were made at orientation angles of 0◦
, 15◦ , 30◦
, 45◦ , and 60◦
with distances of 15×15 cm between the blocks. Figure 3 shows the blocks when the orientation angle was set to 30◦
.
4.2 Results
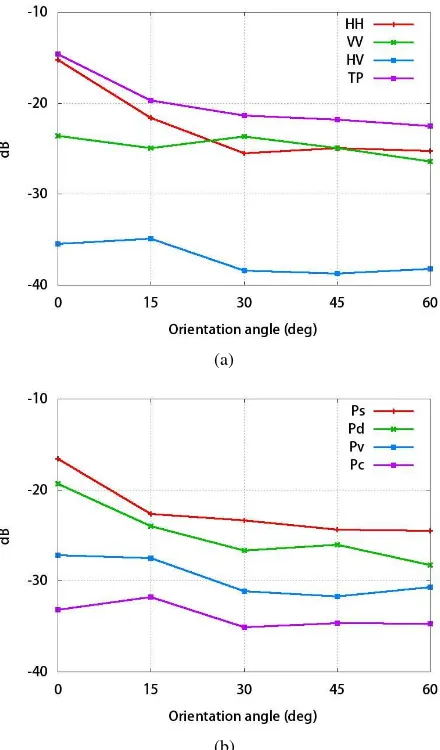
Figure 4 shows curves of the scatterings observed from concrete blocks under different orientation angles. Figure 4(a) has curves ofHH, V V, HV andT P, and Figure 4(b) has those of Ps,
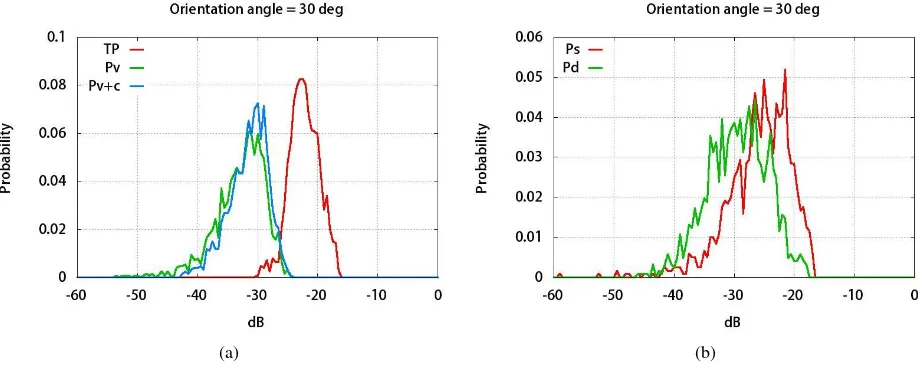
Pd,PvandPc. Figure 5 shows histograms of scatterings when
the orientation angle of the concrete blocks was set to 0◦ . Fig-ure 5(a) shows histograms ofT P,PvandPv+c, and Figure 5(b)
shows those ofPsandPd. Similarly, Figures 6, 7 and 8 show
his-tograms of scatterings at orientation angles of 15◦ , 30◦
and 45◦ , respectively.
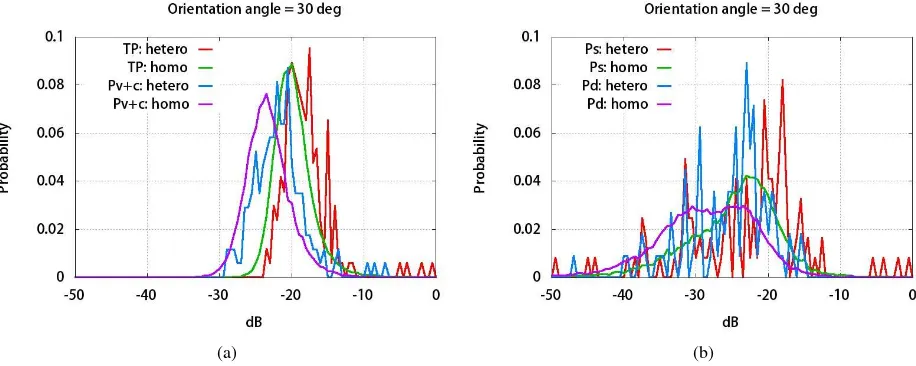
Figure 9 shows histograms of scattering of the areas with POA around 0◦
(−2◦
≤POA≤2◦
) from PALSAR images of the study area. Kajimoto and Susaki (2013b) reported that the areas should be classified into heterogeneous or homogeneous areas in terms of POA, because they have different histograms of scattering. The histograms of heterogeneous and homogeneous areas are shown in Figure 9. Similarly, Figures 10 and 11 show histograms of scattering in areas with POA around 15◦
(13◦
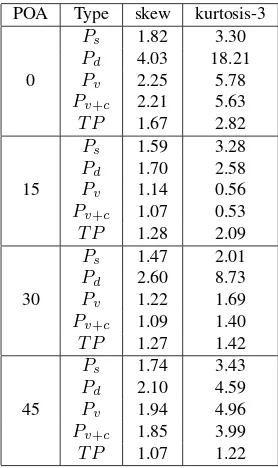
The results of the skew and kurtosis of PDFs derived from blocks are shown in Table 2. Those of the study area (New York) derived from an ALOS/PALSAR image are shown in Table 3.
(a)
(b)
Figure 4. Scattering of the concrete blocks under different orientation angles. (a)HH,V V,HV andT P, and (b)Ps,
Pd,PvandPc
5. DISCUSSION
As explained in Section 1, this research focuses whether the PDF of a scattering is close to a normal distribution from the viewpoint
(a) (b)
Figure 5. Histograms of scatterings when the orientation angle of the concrete blocks was set to 0◦
. (a)T P,Pv, andPv+c, and
(b)PsandPd
(a) (b)
Figure 6. Histograms of scatterings when the orientation angle of the concrete blocks was set to 15◦
. (a)T P,Pv, andPv+c, and
(b)PsandPd
(a) (b)
Figure 7. Histograms of scatterings when the orientation angle of the concrete blocks was set to 30◦
. (a)T P,Pv, andPv+c, and
(a) (b)
Figure 8. Histograms of scatterings when the orientation angle of the concrete blocks was set to 45◦
. (a)T P,Pv, andPv+c, and
(b)PsandPd
POA Type skew kurtosis-3 Ps 1.82 3.30
Pd 4.03 18.21
0 Pv 2.25 5.78
Pv+c 2.21 5.63
T P 1.67 2.82 Ps 1.59 3.28
Pd 1.70 2.58
15 Pv 1.14 0.56
Pv+c 1.07 0.53
T P 1.28 2.09 Ps 1.47 2.01
Pd 2.60 8.73
30 Pv 1.22 1.69
Pv+c 1.09 1.40
T P 1.27 1.42 Ps 1.74 3.43
Pd 2.10 4.59
45 Pv 1.94 4.96
Pv+c 1.85 3.99
T P 1.07 1.22
Table 2. Skew and kurtosis of probability density functions derived from blocks
POA Type Scatter type skew kurtosis-3
Ps -0.11 0.67
Pd 0.01 0.26
Hetero Pv -0.93 3.08
Pv+c 0.21 0.10
0 T P 0.47 0.18
Ps -0.44 1.08
Pd -0.10 0.57
Homo Pv -1.08 3.62
Pv+c 0.46 0.86
T P 1.04 2.02
Ps -0.07 0.78
Pd -0.31 1.01
Hetero Pv -1.06 3.06
Pv+c 0.25 0.73
15 T P 1.23 3.58
Ps -0.60 1.18
Pd -0.45 0.69
Homo Pv -1.24 4.35
Pv+c 0.53 1.34
T P 1.11 3.73
Ps -0.41 1.08
Pd -0.93 0.98
Hetero Pv -0.37 4.35
Pv+c 0.94 2.59
30 T P 2.27 8.59
Ps -0.73 1.49
Pd -0.47 0.60
Homo Pv -1.18 4.31
Pv+c 0.60 1.49
T P 1.13 3.68 Table 3. Skew and kurtosis of probability density functions
of the study area (New York) derived from an ALOS/PALSAR image
(a) (b)
Figure 9. Histograms of scattering of areas with POA around 0◦ (−2◦
≤POA≤2◦
) from PALSAR images of the study area. (a) T PandPv+c, and (b)PsandPd. Here, ”hetero” and ”homo” denote areas having heterogeneous and homogeneous POA
distributions, respectively (Susaki et al., 2014).
(a) (b)
Figure 10. Histograms of scattering of areas having POA around 15◦ (13◦
≤POA≤17◦
from PALSAR image of the study area. See the caption of Fig. 5.
(a) (b)
Figure 11. Histograms of scattering of areas having POA around 30◦ (28◦
≤POA≤32◦
of scattering normalization. It is difficult to derive definite con-clusions from the means of scatterings shown in Figure 4. How-ever, the curves and statistics of PDFs of the scatterings, shown in Figures 5–8 and Table 2 are informative for this purpose. Table 2 shows the skew and the value of kurtosis of PDFs derived from blocks. The smaller the absolute values of the skew and kurtosis - 3 are, the closer to a normal distribution the PDF is. For orien-tation angles of 15◦
and 30◦
,Pv+cgives the best results for skew
and kurtosis. WhilePv+chas the third best results for orientation
angles of 0◦ and 45◦
, it has stable results those are close to the best ones.
Table 3 shows the skew and the value of kurtosis of PDFs derived from an ALOS/PALSAR image. It is similar to the results shown in Table 2, in thatPv+chas stable results that are best or close to
the best for all POAs. For POA of 30◦
, Table 3 indicates thatPs
andPdhave the best or similar results. However, Figure 11(b)
shows that the curves ofPsandPdare not robust. In particular,
the curves ofPsandPdin heterogeneous areas are sharply
fluc-tuating. On the other hand, the curve ofPv+cin heterogeneous
areas is the smoothest among all the curves in heterogeneous ar-eas for POA of 30◦
. Each curve is generated from the same num-ber of samples. It is clear that the smoothness of the curve of PDF depends on scattering type.
According to our previous study (Kajimoto and Susaki, 2013b), Pv+candPvare respectively the best and the second-best
scat-terings in terms of correlation with building-to-land ratio. For the normalized scattering,Tv+cand the normalizedT Pare the best
and second-best scatterings in terms of correlation with building-to-land ratio, respectively. The results obtained by the experi-ments in this research are consistent with the results of the pre-vious study. The curves of the PDFs ofPv+care smooth and
the most similar to the normal distribution among all the scatter-ings derived from fully polarimetric SAR images. Because of the similarity to the normal distribution, the normalization ofPv+c,
expressed by Equation (1), works most effectively. Therefore, Tv+cis the best scattering for estimating urban density among all
the scatterings. However,Pv+cis not a normal distribution. To
improve the accuracies of estimated urban density, the normal-ization expressed by Equation (1) should be replaced by another approach that normalizes scatterings without using the mean and standard deviation. In the near future, we will investigate other approaches.
We derived the theoretical PDFs of scatterings, expressed by Equa-tion (14). The experimental results show that each scattering (Ps,
Pd,Pv,Pv+c, andT P) has a different function from the
theoret-ical one. This is particularly the case withPv+c. These results
may indicate that the assumption that a pixel has random scat-terers does not apply to actual images, and that similar scatscat-terers may exist nearby within a pixel. In the future, we will derive a PDF that can explain conditions where similar scatterers are available within a SAR image pixel.
6. CONCLUSIONS
We presented the PDFs of scatterings derived from fully polari-metric SAR images.We first introduced a theoretical PDF on the condition that image pixels have scatterers showing random backscat-tering. We then generated PDFs of the scatterings derived from data observed using concrete blocks with different orientation an-gles, and from an ALOS/PALSAR image. Analysis of the PDFs and the derived statistics reveal that thePv+ccurves of the PDFs
are smooth and most similar to the normal distribution among all the scatterings derived from fully polarimetric SAR images. We found thatTv+cworks most effectively because of its similarity
to the normal distribution. We also found that PDFs derived from datasets are different from theoretical PDFs. This may be because the assumption that a pixel has random scatterers does not apply to actual images. In future, we will propose an improved method for estimating urban density that normalizes a scattering without using the mean and standard deviation.
ACKNOWLEDGEMENTS
The author thanks Y. Yamaguchi (Niigata University) and his students for offering experimental facilities and for their many helpful comments. This research was supported by a program of the Fourth Advanced Land Observing Satellite-2 Research An-nouncement (RA4), Japanese Aerospace Exploration Agency. Zmap-Town II (ZENRIN) was provided by the Center for Spatial Infor-mation Science at the University of Tokyo.
REFERENCES
Esch, T., Marconcini, M., Felbier, A., Roth, A., Heldens, W. Hu-ber, M. Schwinger, M., Taubenb¨ock, H., M¨uller, A. and Dech, S., 2013. Urban footprint processor - fully automated process-ing chain generatprocess-ing settlement masks from global data of the TanDEM-X mission,IEEE Geosci. Remote Sens. Letters, 10, pp. 1617 - 1621.
Kajimoto M. and Susaki J., 2013a. Urban area extraction from polarimetric SAR images using polarization orientation angle.
IEEE Geosci. Remote Sens. Letters, 10, pp. 337 - 341.
Kajimoto, M. and Susaki, J., 2013b. Urban density estimation from polarimetric SAR images based on a POA correction method.
IEEE J. Selected Topics Applied Earth Observ. Remote Sens.,
6(3), pp. 1418 - 1429.
Niu, X. and Ban, Y., 2012. An adaptive contextual SEM algo-rithm for urban land cover mapping using multitemporal high-resolution polarimetric SAR data. IEEE J. Selected Topics
Ap-plied Earth Observ. Remote Sens., 5, pp. 1129 - 1139.
Perissin, D. and Wang, T., 2012. Time-series InSAR applications over urban areas in China.IEEE J. Selected Topics Applied Earth
Observ. Remote Sens., 4, pp. 92 - 100.
Susaki, J., Kajimoto, M. and Kishimoto, M., 2014. Urban den-sity mapping of global megacities from polarimetric SAR images.
Remote Sens. Environ., 155, pp. 334 - 348.
Yamaguchi, Y., Sato, A., Boerner, W., Sato, R. and Yamada, H., 2011. Four-component scattering power decomposition with ro-tation of coherency matrix. IEEE Trans. Geosci. Remote Sens., 49, pp. 2251 - 2258.