COMBINING PIXEL-BASED AND OBJECT-ORIENTED SUPPORT VECTOR
MACHINES USING BAYESIAN PROBABILITY THEORY
M. Salah*
Dept. of Surveying, Faculty of Engineering Shoubra, Benha University, 108 Shoubra Street, Cairo, Egypt -
(
[email protected])
Commission VI, WG VI/4
KEYWORDS: Pixel-based, object-oriented, SVMs, classification, Bayesian Probability Theory.
ABSTRACT:
This study employed a hybrid system for the combination of pixel-based (PB) and object-oriented (OO) Support Vector Machines (SVMs) based on Bayesian Probability Theory (BPT) for improved land cover classification. A set of uncorrelated feature attributes have been generated from a one-meter IKONOS satellite image. Four different SVMs kernels were compared and tested to classify buildings, trees, roads and ground from satellite image and the generated attributes. The kernels used include: linear, polynomial, radial basis function (RBF), and sigmoid. PB and OO SVMs have been applied to classify the image. BPT was then applied for combining the class memberships from the PB and OO classifiers. Accuracy assessment was carried out using reference data sets derived from the one-meter IKONOS image. The outcomes demonstrate that the OO method has achieved an overall kappa coefficient of 0.8286, compared with 0.6327 that was derived from the conventional PB method. The improvement in overall kappa obtained from the combined system was 0.0608 over the OO SVMs.
* Corresponding author.
1. INTRODUCTION
Research on land use/land cover classification from remotely sensed data has been fuelled in recent years by the increasing use of geographic information systems (GIS), and the need for data acquisition and updates for GIS. Different classification methods have been used for classification of satellite data by researchers. In addition to current PB classification methods, OO techniques also offer the suitable analyses to classify satellite data.
Advanced per-pixel classification algorithms include, but are not limited to, boosting and/or bagging-based classification and regression trees (Lawrence et al., 2004; Baker et al., 2006) and Random Forest (RF) algorithm (Lawrence et al., 2006). The PB classification is a current method because satellite data sets are acquired digitally on the basis of pixel units. PB classifiers are based exclusively on the pixel digital numbers (Shataee et al., 2004). Traditional PB classification is limited because of the following reasons: image pixels are not true geographical objects; PB classification largely neglects the spatial information within an object which is an important source of information to image classification; and the increased variability implicit within high spatial resolution imagery confuses traditional PB classifiers resulting in lower classification accuracies (Hay and Castilla, 2006).
On the other hand, OO classification provides new possibilities for multi-resolution segmentation of images (Shataee et al., 2004). In OO image analysis the basic processing units are not only individual pixels but also image objects or segments. The classifiers in OO image analysis are soft classifiers, which use ‘membership’ to express an object’s assignment to a defined class. The membership value lies between 0.0 and 1.0, where 0.0 expresses absolute improbability and 1.0 expresses a
complete assignment to a class. One advantage of these soft classifiers lies in their possibility to express uncertainties about the class descriptions. Despite the fact that results derived from these approaches are of considerable interest to researchers, segmentation is not an easy work. The object-based software eCognition is available, but requires adjusting the segmentation parameters according to the situation, but this is hardly an automated solution. In this context, a traditional approach based on pixels with models derived from advanced artificial intelligence techniques can achieve good classification results (Garcia-Gutierreza et al., 2009). Blaschke (2010) gave an overview of the development of object based methods.
Some studies have utilized advanced classification algorithms within OO analysis. A decision tree classification was used in an object-based analysis of IKONIS imagery for forest inventories (Chubey et al., 2006). Hay and Castilla (2006) applied Object-based Image Analysis for partitioning remotely sensed imagery into meaningful image-objects, and assessing their characteristics through spatial, spectral and temporal scales. Kamagata et al. (2006) applied an OO classifier to HR multi-spectral (MS) imagery (QuickBird and Ikonos) with improved results over traditional techniques. The nearest neighbor (NN) classification that utilizes fuzzy logic and a membership function-based classification was also applied (Navulur, 2007). Li Haitao et al. (2007) presented a new OO land cover classification method based on SVMs by fusing spectral and textural information of HR aerial imagery and a lidar derived Digital Surface Model (DSM) in urban areas. Bruce (2008) summarized classification accuracies derived from: six banded Landsat TM data; MS and panchromatic QuickBird satellite imagery; and 0.15m MS aerial imagery to show how, for at least images exhibiting low spectral dimensionality, OO techniques are superior to the traditional
PB methods, but still inferior to human interpretation. Myint et al. (2011) employed five different classification procedures based on the OO paradigm that separates spatially and spectrally similar pixels at different scales. The classifiers used to assign land cover types to segmented objects in the study include membership functions and the nearest neighbor classifier. The object-based classifier achieved a high overall accuracy (90.40%), whereas the most commonly used decision rule, namely maximum likelihood classifier, produced a lower overall accuracy (67.60%).
The combined approach using per-pixel and OO classification methods has proved useful in the analysis of HR satellite data, since it has resulted in higher per class accuracy (Blaschke et al., 2010). Hirose et al. (2004) described a hybrid analysis method combining OO and PB image classifiers for vegetation mapping using IKONOS. Lei et al. (2008) presented a hybrid classifier combining an expert system with an OO approach, which provides additional information for classification and improved accuracy. However, setting up the rules for the expert system is complicated and time consumed, and requires some experience in defining the land cover features and their spatial distribution. Bhaskaran et al. (2010) described an approach using both per-pixel and object-based classification methods for mapping urban features from HR satellite data over New York City. Whilst the per-pixel approach produced reasonable overall accuracy, the per-class accuracies registered low user's accuracy. The use of an OO classification method resulted in improved classification accuracies. Li et al. (2013) proposed a hybrid method combining PB and OO methods and its application in Hungary using the Chinese HJ-1 satellite images. Classification results showed that the hybrid method outperformed OO method, with an overall accuracy of 90.53%, compared with the overall accuracy of 77.53% for maximum likelihood classifier at the object level.
Amongst other classification methods, SVMs classification is a theoretically superior machine learning methodology for the classification of highly dimensional datasets and has been found competitive with the best machine learning algorithms. In the past, SVMs were only tested and evaluated as PB image classifiers with very good results (Gualtieri and Cromp 1999, Brown et al 2000, Huang et al 2002, Foody and Mathur 2004, Melgani and Bruzzone 2004). SVMs were compared to other classification methods, such as Neural Networks, Nearest Neighbor, Maximum Likelihood and Decision Tree classifiers for remote sensing imagery and have surpassed all of them in robustness and accuracy (Huang et al 2002, Foody and Mathur 2004). SVMs have also been evaluated as OO image classifiers as a modern computationally intelligent method (Li Haitao et al., 2007). The major motivation of this work is to establish a framework for combining PB and OO SVMs based on the BPT. After describing the study area and data sources in the following section, this paper is organized as follows. Section 3 describes the classification methods used; Section 4 presents and evaluates the results which are summarized in Section 5.
2. STUDY AREAS AND DATA SOURCES 2.1 Multispectral satellite image
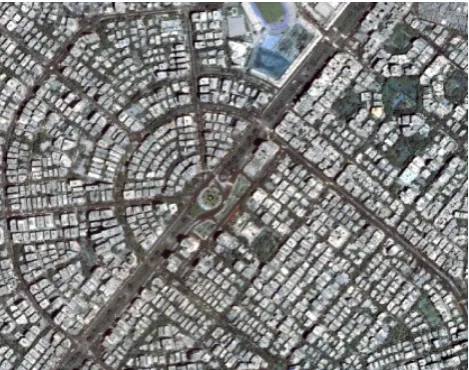
In order to demonstrate the capability of the hybrid system, the area of study of approximately one Km2 covers Roxi Square in Cairo city. One-meter spatial resolution and pansharpened IKONOS images over the area of study were collected in April 17, 2010 and supplied in a TIFF digital format. It is a largely
dense urban area which includes residential buildings, large buildings, a network of main and local roads, open and green areas as well as trees as shown in figure 1.
Figure 1. A one-meter IKONOS Image over the test area.
2.2 Reference data
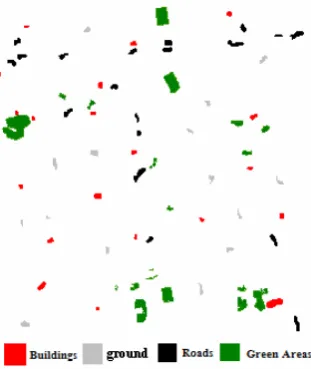
In order to evaluate the accuracy of the classifications undertaken in this research, reference data were captured by digitizing buildings, trees, roads and ground in the image as shown in figure 2. Class “ground” mainly corresponds to parking lots and bare fields. All recognizable features independent of their size were digitized. Adjacent buildings that were joined but obviously separated were digitized as individual buildings; otherwise, they were merged into one polygon. Larger areas covered by trees were digitized as one polygon.
Figure 2. Reference data used for the research. Red: buildings, green: trees, black: roads and grey: ground.
2.3 Feature attributes
Feature attributes are necessary to compensate for some common problems associated with high resolution image data such as: shadows caused by tall buildings or trees; and the spectral variability within the same land-cover class (Lu and Weng, 2007). In conjunction with spectral information, texture and shape information of image objects provide useful information for detailed land cover classification (Hirose et al.,
2004). This research was carried out using a set of attributes calculated for predefined segments or single pixels and presented as input data for the classifiers to help define classes when performing the classification. A detailed description of the formulas for calculating attributes can be found in Russ (2002). Some attributes are more useful when differentiating objects and classification results may not be as accurate when all attributes are used, since the irrelevant attributes could introduce noise into the results. The most useful attributes for the classification have been statistically determined. The underlying logic is based on Yang (2007). Table 1 shows the attributes and the classifier for which they have been selected. Although spatial information is remarkably useful for OO classifiers, how to effectively use it in PB classification remains a research topic. This is because PB classification is conducted based on individual pixels, instead of the objects. On the other hand, spectral attributes, color space and band ratio attributes were not applied in the case of PB SVMs in order to reduce the data redundancy that can greatly influence the performance of PB SVMs.
Table 1. The full set of the possible attributes. √ and x indicate whether or not respectively the attribute has been selected for the classification process.
Group Attribute PB OO
Compactness x √
Convexity x √
Elongation x √
Main direction x √ Major axis
length x √
Minor axis
length x √
Number of
holes x √
Spatial Attributes
Hole solid
ratio x √
Minimum x √ bands
1,2 Spectral
Attributes Standard
deviation x
√ bands 1,2,3
Range √
band1
√ band1
Mean √
band1
√ band1
Variance √
Texture Attributes
Entropy √
band3 x
Hue x √
Saturation x √
Color Space and Band Ratio
Attributes Intensity x √
3. METHODOLOGY
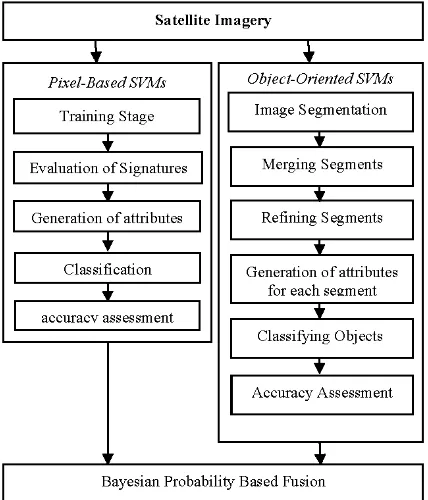
The fusion process of the PB and OO classifications was implemented in several stages as shown in Figure 3:
Figure 3. The Hybrid Classification Workflow.
3.1 Pixel-based Classification
The PB classification process was implemented in several stages as follow:
Training Datasets
The overall objective of the creation of training datasets is to assemble a set of statistics that describe the spectral response patterns for each land cover type to be classified in the image (Lillesand and Kiefer, 2004). The minimum number of pixels required for a signature is the number of bands plus one (N+1), which is the necessary condition for the covariance matrix to be positive definite (Schowengerdt, 2001). The training data used are sets of manually classified samples. Polygons of approximately equal areas, for each land cover class, buildings, trees, roads and ground, were digitized from the image to generate the training data. The positions of the polygons were selected carefully near class centers to be representative and to capture changes in the spectral variability of each class. As well, it was necessary to avoid the effect of between-class local texture variability on the pixels near class boundaries that causes many of these pixels to be placed in an incorrect category (Ferro and Warner, 2002). Figure 4 shows the locations of the training data sets used for the experiments.
Evaluation of signatures:
The created signatures are compared in a box plot illustrating minimum and maximum reflectance values corresponding to the signatures of the features used for training, as shown in Figure 5. The box plot option shows completely separable minimum/maximum boxes.
Figure 4. Training data for Buildings, Ground, Roads and Trees classes.
Figure 5. Minimum and maximum reflectance values for signatures of training features of buildings, ground, roads and trees.
Image classification
SVM is a classification system derived from statistical learning theory (Vapnik, 1979). It separates the classes with a decision surface that maximizes the margin between the classes. The surface is often called the optimal hyperplane, and the data points closest to the hyperplane are called support vectors. As a consequence they generalize well and often outperform other algorithms in terms of classification accuracies. Furthermore, the misclassification errors are minimized by maximizing the margin between the data points and the decision boundary. Since the One-Against-One (1A1) technique usually results in a larger number of binary SVMs and then in subsequently intensive computations, the One-Against-All (1AA) technique was used to solve for the binary classification problem that exists with the SVMs. The SVMs classifier provides four types of kernels: linear, polynomial, radial basis function (RBF), and sigmoid.
In remote sensing applications the RBF kernel has proved to be effective with reasonable processing times (Van der Linden et al., 2009). The RBF kernel nonlinearly maps samples into a higher dimensional space. Unlike the linear kernel, which is a special case of the Gaussian kernel, a Gaussian RBF function can handle more complex and nonlinear class distributions. In addition, the sigmoid kernel behaves like RBF for certain parameters (Lin and Lin, 2003). On the other hand, the polynomial kernel requires more parameters and has more numerical difficulties than the RBF kernel (Hsu et al., 2009).
However, all of those kernels have been tested and compared in this research in order to form a robust decision about the behavior of SVMs in the case of HR satellite imagery. Table 2 shows the mathematical representation of each kernel:
Table 2. The SVMs kernels.
Linear K (xi, xj) = xi . xj
Polynomial K (xi, xj) = ((xi . xj) + r)d, γ > 0 RBF K (xi, xj) = exp(-γ||xi - xj||2), γ > 0 Sigmoid K (xi, xj) = tanh(γ (xi . xj) + r)
Where:
γ :the gamma term in the kernel function for all kernel types except linear.
d :the polynomial degree term in the kernel function for the polynomial kernel.
r :the bias term in the kernel function for the polynomial and sigmoid kernels.
γ, d and r : are user-controlled parameters, as their correct definition significantly increases the accuracy of the SVM solution.
A 10-fold cross-validation was applied to choose the almost best parameter. The cross-validation can prevent overfitting problems and results in better accuracy (Hsu et al., 2009). On the other hand, a second order polynomial kernel was applied for the current nonlinear problem. Table 3 shows kernels parameters used for the experiments.
Table 3. The kernels parameters used for the classification process.
Kernel γ d r
Linear x x x
Polynomial 0.03 2 1
RBF 0.03 x 1
Sigmoid 0.03 x 1
The sequential minimal optimization (SMO) algorithm, with a faster speed and much smaller memory requirements has been used for the experiments for training the SVMs (Platt, 1999). SMO breaks the large quadratic programming optimization problem into a series of smallest possible QP ones in order to avoid time-consuming.
3.2 Object-based Classification
The OO SVM classification process was implemented in several stages as follows:
Image Segmentation
Segmentation is the process of partitioning an image into segments by grouping neighboring pixels with similar feature values (brightness, texture, color, etc.). These segments ideally correspond to real-world objects. Each segment is assigned the mean spectral values of all the pixels that belong to that region. An edge-based segmentation algorithm was employed that is very fast and only requires one input parameter (Scale Level). By suppressing weak edges to different levels, the algorithm can yield multi-scale segmentation results from finer to coarser segmentation. The optimum segmentation scale that delineates the boundaries of features as well as possible was iteratively chosen to be 57 and the results are shown in figure 6 (a).
Merging Segments
Merging is a step used to aggregate small segments within larger ones where over-segmentation may be a problem. The Merge Level that delineates the boundaries of features as well as possible was iteratively chosen to be 27. The Full Lambda-Schedule algorithm created by Robinson et al. (2002) was employed. The algorithm iteratively merges adjacent segments based on a combination of spectral and spatial information. Merging proceeds if the algorithm finds a pair of adjacent regions, i and j, such that the merging cost ti,j is less than a
defined threshold lambda value:
))
||ui - uj||: is the Euclidean distance between the spectral values of regions i and j.
length (∂(Oi, Oj)): the length of the common boundary of Oi and
Oj.
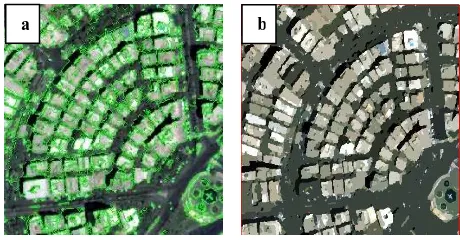
Segmentation results were then refined using another merging method called thresholding. Thresholding is a raster operation that works with the first band of the image to group adjacent segments based on their brightness value. The lower and upper limits of the threshold were defined to be 100 and 905 respectively. Pixel values below the low threshold and above the high threshold are assigned a value of 0, and values between the thresholds are assigned a value of 255. As a result, a new masked image was generated. The black area in the masked image represents one big region, while the white areas represent other distinct regions. The masked image was then segmented and each distinct region was assigned a unique identifier as shown in figure 6 (b). The identifiers are then used in computing attributes.
Figure 6. (a) The optimum segmented image at the scale of 57. (b) Merging adjacent segments based on their brightness values.
Supervised Classification
Supervised classification is the process of using training data to assign objects of unknown identity to one or more known features. A variety of different sizes and colors of objects that represent features of interest has been selected. The more features and training samples selected, the better the results from supervised classification. However, selecting an overwhelming number of training samples will cause poor performance during classification and when previewing
classification results. SVMs have been applied to classify the image with the same set of kernel parameters mentioned in table 3. SVM classification output is the decision values of each pixel for each class, which are used for probability estimates. The probability values represent true probability in the range of 0 to 1, and the sum of these values for each pixel equals 1. The probability images for PB and OO SVMs have been used as input data for the BPT based hybrid system.
3.3 Bayesian Probability Theory based fusion
BPT is concerned with establishing the probability that an entity belongs to any of a number of different sets (classes or states). These are called hypotheses in the typical language of Bayes. BPT evaluates the probability that each hypothesis is true given the information contained in the prior probability and evidence images. When complete information is available or assumed, the primary tool for the evaluation of the relationship between the indirect evidence and the decision set is BPT. BPT is an extension of Classical Probability theory which allows combining new evidenceabout any hypothesis along with prior knowledge to arrive at an estimate of the likelihood that the hypothesis is true. The basis for this is Bayes' Theorem (Lee et al., 1987):
p(h|e): the probability of the hypothesis being true given the evidence (posterior probability).
p(e|h): the probability of finding that evidence given the hypothesis being true.
p(h) : the probability of the hypothesis being true regardless of the evidence (prior probability).
3.4 Accuracy Assessment
Accuracy assessments of the proposed system were undertaken using confusion matrices and Kappa statistics. The Kappa Index of Agreement (KIA) is a statistical measure adapted for accuracy assessment in RS fields by Congalton and Read (1983). KIA is a means to test two images, if their differences are due to 'chance' or 'real disagreement'. It is often used to check for accuracy of classified satellite images versus some 'real' ground-truth data.
r: number of row in crossclassification table. xii :number of combinations along the diagonal.
xi+ : total observations in row i.
x+i : total observations in column i.
N : total number of cells.
For the per-category-KAPPA, the following algorithm was introduced by Rosenfield and Fitzpatrick-Lins (1986):
i
pi+ :proportion of units for expected chance agreement in row i.
p+i :proportion of units for expected chance agreement in
column i.
a b
4. RESULTS AND ANALYSIS
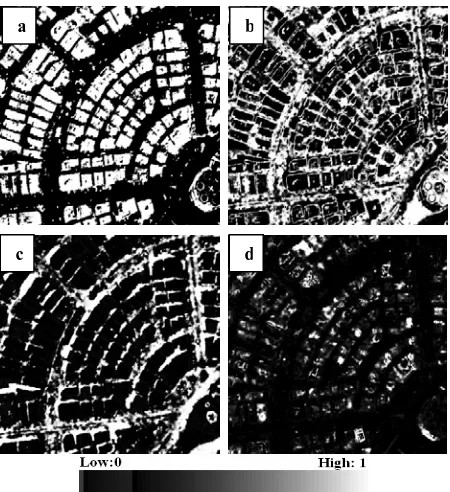
Figure 7 shows a typical example of the hybrid system output which is the decision values of each pixel for each class. The probability values have been used later to create a new classification image without having to recalculate the entire classification. The membership values from all the land covers were compared and the class with the highest membership value was assigned to the pixel label. Figure 8 is a typical example of the classification results. Red: buildings, green: trees, black: roads and grey: ground.
Figure 7. A typical example showing the membership values of the hybrid system. (a) Buildings, (b) Trees, (c) Roads, (d) Ground classes.
Figure 8. A typical example showing the classification results. (a) The MS satellite image, (b) The PB/RBF classified image, (c) The OO/RBF classified image, (d) The BPT/RBF classified image.
4.1 Overall Kappa
Before incorporating the PP and OO SVMs into the hybrid system, the four SVMs kernels were tested and compared in terms of overall Kappa to select the kernel with the best performance as a representative of SVMs. In the case of PB SVMs, the overall Kappa of individual Kernels, based on the reference data, are given in Table 4. The RBF kernel performed the best with 0.6327 overall Kappa, followed by the Sigmoid and polynomial kernels with 0.6160 and 0.6031 overall Kappa respectively. The linear kernel performed the worst with overall Kappa of 0.5985. A closer examination of the PB results reveals that the kappa coefficient is relatively low, indicating the PB method is unsatisfactory for classifying remotely sensed images if non-spectral data, such as lidar data, is not incorporated into a classification procedure. Also, in the case of OO SVMs, the RBF kernel performed the best with 0.8286 overall Kappa, followed by the Sigmoid and polynomial kernels with 0.7470 and 0.7149 overall Kappa respectively. The linear kernel performed the worst with overall Kappa of 0.7020. The improvement in overall Kappa achieved by the combination of PB and OO classifications compared with the individual classifiers, is also shown in Table 4. This improvement in the overall kappa is 0.0608 compared that obtained by the OO SVMs.
Table 4. Performance evaluation of single classifiers and hybrid system.
Classifier Kernel Overall Kappa
Linear 0.5985 Polynomial 0.6031
Sigmoid 0.6160 PB
SVMs
RBF 0.6327 Linear 0.7020 Polynomial 0.7149
Sigmoid 0.7470 OO
SVMs
RBF 0.8286 Hybrid
System RBF 0.8894
These results support those of Li et al. (2013) who conclude that the hybrid method outperformed OO method, with an overall accuracy of 90.53%, compared with the overall accuracy of 77.53% for maximum likelihood classifier at the object level.
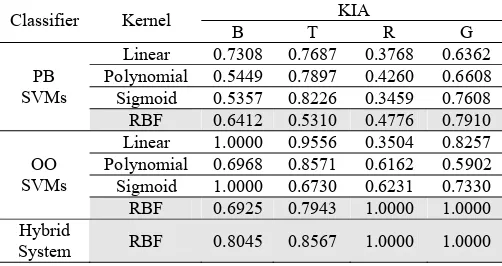
4.2 Class-Specific Accuracies
An assessment of the KIA confirms that the hybrid system performed the best in most cases as shown in table 5. Most of the class-accuracies are improved by the Bayes fusion. Whereas the application of PB and OO SVMs resulted in average KIA of 0.6150 and 0.7755 respectively, the application of Bayes fusion resulted in average KIA of 0.9153.
Another advantage of the Bayes fusion is that the achieved errors are less variable. Whereas the application of SVMs resulted in standard deviation of 0.1281 and 0.0867, for KIA, in case of PB and OO respectively, the application of Bayes fusion resulted in a SD of 0.0769. Thus it meets the requirement of Anderson et al., (1976) that the accuracy of interpretation for the different categories should be about equal.
a b
c d
a b
c d
Table 5. Class-Specific Accuracies. B: buildings, T: trees, R: roads and G: ground.
KIA Classifier Kernel
B T R G Linear 0.7308 0.7687 0.3768 0.6362 Polynomial 0.5449 0.7897 0.4260 0.6608
Sigmoid 0.5357 0.8226 0.3459 0.7608 PB
SVMs
RBF 0.6412 0.5310 0.4776 0.7910 Linear 1.0000 0.9556 0.3504 0.8257 Polynomial 0.6968 0.8571 0.6162 0.5902
Sigmoid 1.0000 0.6730 0.6231 0.7330 OO
SVMs
RBF 0.6925 0.7943 1.0000 1.0000 Hybrid
System RBF 0.8045 0.8567 1.0000 1.0000
Finally, it is worth noting that the classification accuracy for the land cover classes of buildings and trees using RBF kernel is lower compared to those using linear and sigmoid kernels. Under such an observation, if a particular class is very important, kernels should be tested first to select the best kernels for that class before applying the Bayesian probability based-fusion.
5. CONCLUSION
In this paper, a powerful hybrid system to combine PB and OO SVMs classifiers based on BPT has been applied. A set of uncorrelated feature attributes have been generated from a one-meter IKONOS satellite image. Four different SVMs kernels were compared and tested to classify buildings, trees, roads and ground from satellite image and the generated attributes. The results show that the OO method has achieved an overall kappa coefficient of 0.8286, compared with 0.6327 that was derived from the conventional PB method. The improvement in overall kappa obtained from the combined system based was 0.0608 over the OO SVMs. As well, the fused system also performed best in terms of per-class accuracies. Most of the class-accuracies were improved by the Bayes fusion. Whereas the application of PB and OO SVMs resulted in average KIA of 0.6150 and 0.7755 respectively, the application of Bayes fusion resulted in average KIA of 0.9153. Another advantage of the Bayes fusion is that the achieved errors are less variable. The results in this paper demonstrate the overall advantages of the proposed fusion system for combining pixel-based and object-oriented classifiers.
REFERENCES
Anderson, J. R., E. E. Hardy, J. T. Roach and R. E. Witmer. (1976). A land use and land cover classification system for use with remote sensor data. Washington, DC: US Geological Survey.
Baker, C., R. Lawrence, C. Montagne and D. Patten. (2006). Mapping wetlands and riparian areas using Landsat ETM+ imagery and decision-tree-based models. Wetlands, 26: 465-474.
Bhaskaran, S., Paramananda, S. and Ramnarayan, M. (2010). Per-pixel and object-oriented classification methods for mapping urban features using Ikonos satellite data. Applied Geography, 30, 650–665.
Blaschke, T. (2010). Object based image analysis for remote sensing. ISPRS Journal of Photogrammetry and Remote Sensin. 65, 2–16.
Brown M., Lewis H.G. and S.R. Gunn (2000). Linear Spectral Mixture Models and Support Vector Machines for Remote Sensing. IEEE Transactions On Geoscience And Remote Sensing, Vol. 38, No. 5, September 2000
Bruce, D. (2008). Object Oriented Classification: case studies using different image types with different spatial resolutions, in proceedings of the 21st ISPRS World Congress, Beijing, July 4 – 11, 2008.
Chubey, M.S., S.E. Franklin and M.A. Wulder. (2006). Object-based analysis of Ikonos-2 imagery for extraction of forest inventory parameters. Photogrammetric Engineering and Remote Sensing, 72: 383.
Congalton R. G. and Roy A. Mead. (1983). A Quantitative Method to Test for Consistency and Correctness in Photointerpretation. – Photogrammetric Engineering and Remote Sensing. 49,1: 69 – 74.
Ferro, C. J. and Warner, T. A. (2002). Scale and texture in digital image classification. Photogrammetric Engineering and Remote Sensing, 68, pp. 51–63.
Foody G.M. and A. Mathur (2004). A Relative Evaluation of Multiclass Image Classification by Support Vector Machines. IEEE Transactions On Geoscience And Remote Sensing, Vol. 42, No. 6, June 2004.
Garcia-Gutierreza, J., Goncalves-Secob, L. and Riquelme-Santosa, J. (2009). Decision trees on lidar to classify land uses and covers. In F. Bretar, M. Pierrot-Deseiligny and G. Vosselman (Eds.). Proceedings of the ISPRS workshop on Laser scanning-XXXVIII /W8, 1-2 September 2009, Paris, France.
Gualtieri J.A. and R. F. Cromp (1999). Support vector machines for hyperspectral remote sensing classification,” in Proceedings of the SPIE, vol. 3584, 1999, pp. 221–232.
Hay, G.J. and Castilla, G. (2006). Object-Based Image Analysis: Strengths, Weaknesses, Opportunities and Threats (SWOT). 1st Int. Conference on Object-Based Image Analysis (OBIA 2006), ISPRS Commission V1, WG V1/4, Salzburg, Austria, July 4 -5
Hirose, Y., Mori, M., Akamatsu , Y. and Li, Y. (2004). Vegetation Cover Mapping Using Hybrid Analysis Of Ikonos Data. ISPRS Archives – Volume XXXV Part B7, 2004. Istanbul, Turkey, July 12-23, 2004.
Hsu, C.W., Chang, C.C. and Lin, C.J. (2009). A Practical Guide to Support Vector Classification. Department of Computer Science, National Taiwan University, http://www.csie.ntu.edu.tw/~cjlin/papers/guide/guide.pdf.
Huang C., L. S. Davis and J. R. G. Townshend (2002). An assessement of support vector machines for land cover classifiocation,” Int. J. Remote sensing, vol. 23, no. 4, pp. 725– 749, 2002.
Kamagata, N., Hara, K., Mori, M., Akamatsu,Y., Li, Y. and Hoshino, Y. (2006). A New Method of Vegetation Mapping by Object-Based Classification Using High Resolution Satellite Data. 1st Int. Conference on Object-Based Image Analysis (OBIA 2006), ISPRS Commission V1, WG V1/4, Salzburg, Austria, July 4 -5.
Lawrence, R., A. Bunn, S. Powell and M. Zambon. (2004). Classification of remotely sensed imagery using stochastic
gradient boosting as a refinement of classification tree analysis. Remote Sensing of Environment, 90: 331-336.
Lawrence, R.L., S. D. Wood and R.L. Sheley. (2006). Mapping invasive plants using hyperspectral imagery and Breiman Cutler classifications (RandomForest). Remote Sensing of Environment, 100: 356-362.
Lee, N.S., Y.L. Grize and K. Dehnad, (1987) Quantitative Models for Reasoning under Uncertainty in Knowledge-Based Expert Systems, International Journal of Intelligent Systems, II, 15-38.
Lei Zhang, Yueming Zhou and Bingfang Wu. (2008). Expert System Based On Object-Oriented Approach For Land Cover Mapping. The International Archives of the Photogrammetry, Remote Sensing and Spatial Information Sciences. Vol. XXXVII. Part B7. Beijing 2008
Li Haitao, GU Haiyan, HAN Yanshun and YANG Jinghui. (2007). Fusion Of High-Resolution Aerial Imagery And Lidar Data For Object-Oriented Urban Land-Cover Classification Based On SVM. ISPRS Workshop on Updating Geo-spatial Databases with Imagery & The 5th ISPRS Workshop on DMGISs. Urumchi, China, 28-29 August 2007
Li Xiaojiang, Meng Qingyan, Gu Xingfa, Jancso Tamas, Yu Tao, Wang Ke and Mavromatis Sebastien. (2013). A hybrid method combining pixel-based and object-oriented methods and its application in Hungary using Chinese HJ-1 satellite images. International Journal of Remote Sensing. Volume 34, Issue 13, 2013, pages 4655-4668
Lillesand, T. and Kiefer, R. (2004). Remote Sensing and Image Interpretation. Fourth Edition, John Willey & Sons, Inc., New York.
Lin, H.T. and C.J., Lin (2003). A study on sigmoid kernels for SVM and the training of non-PSD kernels by SMO-type methods. Technical report, Department of Computer Science, National Taiwan University.
Lu, D. and Weng, Q. (2007). A survey of image classification methods and techniques for improving classification performance. International Journal of Remote Sensing, 28(5): pp. 823 - 870.
Melgani F. and L. Bruzzone (2004). Classification of Hyperspectral Remote Sensing Images with Support Vector Machines. IEEE Transactions On Geoscience And Remote Sensing, Vol. 42, No. 8, August 2004.
Myint, S.W., Gober, P., Brazel, A., Grossman-Clarke, S. and Weng, Q. (2011). Per-pixel vs. object based classification of urban land cover extraction using high spatial resolution imagery. Remote Sensing of Environment. 115, 1145–1161.
Navulur, K. (2007). Multispectral Image Analysis Using the Object-oriented Paradigm. CRC Press, Boca Raton, FL.165 pp.
Platt, J. (1999). Fast training of support vector machines using sequential minimal optimization. In: B. Schölkopf, C. J. C. Burges, and A. J. Smola (Eds.), Advances in Kernel Methods - Support Vector Learning, Cambridge, MA.: MIT Press, pp.185-208.
Robinson, D. J., Redding, N. J. and Crisp, D. J. (2002). Implementation of a fast algorithm for segmenting SAR imagery, Scientific and Technical Report, 01 January 2002. Australia: Defense Science and Technology Organization.
Rosenfield, G. H. and Fitzpatrick-Lins, K. (1986). A Coefficient of Agreement as a Measure of Thematic Classification Accuracy. Photogrammetric Engineering and Remote Sensing, 52,2: 223 - 227
Russ, J. C. (2002). The Image Processing Handbook, Fourth Edition. Boca Raton, FL: CRC Press.
Schowengerdt, R. (2001). Models and Methods for Image Processing. Second Edition, ACADEMIC PRESS, San Diego.
Shataee, S., Kellenberger, T. and Darvishsefat, A. A. (2004). Forest Types Classification Using ETM+ Data In The North Of Iran/Comparison Of Object-Oriented With Pixel-Based Classification techniques, ISPRS, Istanbul, 2004.
Van der Linden, S., Rabe, A., Okujeni, A. and Hostert, P. (2009). Image SVM Classification, Application Manual: imageSVM version 2.0. Humboldt- Universität zu Berlin, Germany.
Vapnik, V. (1979). Estimation of Dependences Based on Empirical Data [in Russian]. Nauka, Moscow, 1979. (English translation: Springer Verlag, New York, 1982).
Yang, Z. (2007). An interval based attribute ranking technique. Unpublished report, ITT Visual Information Solutions. A copy of this paper is available from ITT Visual Information Solutions Technical Support. Chang, C.-C. and C.-J. Lin, "LIBSVM: a library for support vector machines, 2001.
ACKNOWLEDGEMENTS
The support provided by Benha University and the Egyptian Government is gratefully acknowledged. The author would like also to thank Professor John C. Trinder for helpful comments, edits and discussions.