UPDATING LIDAR DSM USING HIGH RESOLUTION STEREO-BASED DSM FROM
WORLDVIEW-2
H. Arefia, H. Hashemia,*
1, Th. Krauss
b, M.Gharibia
a Dept. of Surveying and Geometics Eng., College of Engineering, University of Tehran, Tehran, Iran - {hossein.arefi,
hosseinhashemi, mahdigharibi}@ut.ac.ir
b German Aerospace Center (DLR), Remote Sensing Technology Institute (IMF) - [email protected]
KEY WORDS: updating, DSM, LiDAR, high resolution satellite images, 3D change detection, automatic building extraction
ABSTRACT:
In recent years, the acquisition and processing techniques of high resolution Digital Surface Models (DSM) have been rapidly improved. Airborne LiDAR production as a well-known and high quality DSM is still unbeatable in elevation accuracy and highly produced dense point clouds. In this paper, the objective is to update an old but high quality DSM produced by LiDAR data using a DSM generated from high resolution stereo satellite images. A classification-base algorithm is proposed to extract building changes between DSMs in two epochs. For image classification procedure, the DSM and Worldview-2 orthorectified images have been used as input data for a fuzzy-based classification method. Then, extracted buildings are classified into unchanged, destroyed, new, and changed classes. In this study a dataset related to Munich city, has been utilized to test the experimental investigation. The implemented qualitative and quantitative assessments demonstrate high quality as well as high feasibility of the proposed approach.
* Corresponding author.
1. INTRODUCTION
1.1 Introduction
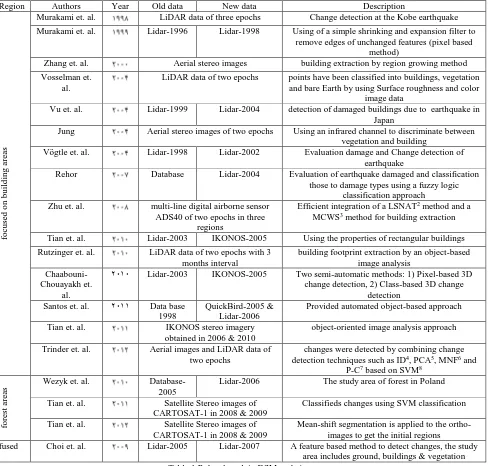
Nowadays updating topographic databases is one of the challenges and concerns of the mapping agencies. So the geo-spatial database needs to be updated regularly to be always reliable for decision makers (Hanson et. al., 2010, Sande et. al., 2008). Buildings are the most concerned objects for updating in 2D and 3D. In table 1 the most recent and active researches regarding to DSM updating is listed. In this table, the studies are categorized based on the type of the feature that has been updated. This table includes the new and old available data, summarize of proposed algorithm and cause of the changes as well as the year of publishing and the authors. The updating process has two main steps including change detection and updating the detected changes in database. Generally, the change detection studies can be divided into two categories:
1. The buildings are extracted in old and new epochs and then, the obtained results are classified into different classes such as unchanged, changed, reduced and increased.
2. The two DSMs are subtracted from each other and meaningful discrepancies are determined.
Numerous studies has been done to detect the occurred changes, while proposing an updating strategy to enhance the old DSM is still challenging issue which will be particularly discussed in this paper. In this paper, a new method for updating elevation model based on an object-based approach is proposed. The updating process is carried out just in parts of the building which has been changed, while in most papers the updating has been applied in whole of area such as a building block. In other words, if a new part is added to a building, the updating process is only employed in changed parts of building and not in complete building block. The compactness and area are two criteria which are used for evaluation of the regions in this
study for change detection. Evidently, DSM updating process is meaningful when the newly data has low accuracy compared to old data. The proposed method consists of two steps. In the first step, building blocks are extracted from each of old and new dataset. In second step, DSM changes are obtained and DSM updating is carried out in three dimensions. Hierarchical filtering approach using morphological operators which introduced by Arefi et. al. (2005) is used for extraction of non-terrain objects from available DSMs. Image classification is done by fuzzy classification method proposed by Krauss et. al. (2012). Building changes are extracted using 3D change analysis. The result of this analysis has been divided into changed, destroyed, new and unchanged classes.
1.2 Input Data
LiDAR point cloud dataset prepared from Munich urban area collected in 2005, whereas new dataset is an orthorectified images generated from stereo Worldview-2 images containing one panchromatic and 8 spectral bands captured in 2007. Corresponding DSM produced from image matching is also available. The resolution of LiDAR and Worldview-2 height data are 1-m and 0.5-m, respectively (figure 1).
2. METHOD
Proposed method for DSM updating based on available datasets is represented in Figure 2. The proposed method has six steps that each of them is explained in the next sub-sections.
2.1 Classification
method the available 8 spectral bands of Worldview-2 and generated nDSM is used as input data for fuzzy classification. The result of this classification is four classes including water, trees (vegetation cover), buildings, and ground. The existence of shadow in stereo images leads to mismatching in image matching process and accordingly, the produced DSM would not have sharp edges on objects boundaries. In order to improve the classification results, the shadow mask derived from panchromatic band, are applied into the extracted classes (Tian
et. al., 2011). So, for obtaining better results from classification, an image refinement procedure has been implemented. Refinement procedure is utilized based on neighbourhood analysis upon the result of classification. In this process, if the length of shared borders between two objects is longer than the pre-defined threshold, the region belongs to adjacent class (Rezaee, 2012). As shown in Figure 3 (top-right), some small regions (green) which belong to vegetation class can be observed above the building roofs.
Region Authors Year Old data New data Description
fo
Murakami et. al. LiDAR data of three epochs Change detection at the Kobe earthquake
Murakami et. al. Lidar-1996 Lidar-1998 Using of a simple shrinking and expansion filter to remove edges of unchanged features (pixel based
method)
Zhang et. al. Aerial stereo images building extraction by region growing method
Vosselman et. al.
LiDAR data of two epochs points have been classified into buildings, vegetation and bare Earth by using Surface roughness and color
image data
Vu et. al. Lidar-1999 Lidar-2004 detection of damaged buildings due to earthquake in Japan
Jung Aerial stereo images of two epochs Using an infrared channel to discriminate between vegetation and building
Vögtle et. al. Lidar-1998 Lidar-2002 Evaluation damage and Change detection of earthquake
Rehor Database Lidar-2004 Evaluation of earthquake damaged and classification those to damage types using a fuzzy logic
classification approach Zhu et. al. multi-line digital airborne sensor
ADS40 of two epochs in three regions
Efficient integration of a LSNAT2 method and a MCWS3 method for building extraction
Tian et. al. Lidar-2003 IKONOS-2005 Using the properties of rectangular buildings
Rutzinger et. al. LiDAR data of two epochs with 3 months interval
building footprint extraction by an object-based image analysis
Chaabouni-Chouayakh et.
al.
0202 Lidar-2003 IKONOS-2005 Two semi-automatic methods: 1) Pixel-based 3D change detection, 2) Class-based 3D change
detection
Tian et. al. IKONOS stereo imagery
obtained in 2006 & 2010
object-oriented image analysis approach
Trinder et. al. Aerial images and LiDAR data of two epochs
changes were detected by combining change detection techniques such as ID4, PCA5, MNF6 and
Lidar-2006 The study area of forest in Poland
Tian et. al. Satellite Stereo images of CARTOSAT-1 in 2008 & 2009
Classifieds changes using SVM classification
Tian et. al. Satellite Stereo images of CARTOSAT-1 in 2008 & 2009
Mean-shift segmentation is applied to the ortho-images to get the initial regions
fused Choi et. al. Lidar-2005 Lidar-2007 A feature based method to detect changes, the study area includes ground, buildings & vegetation Table 1.Related work in DSM updating
2 local surface normal angle transform 3 marker controlled watershed segmentation 4 image differencing
Figure 1.From top to bottom, LIDAR DSM, RGB image created from bands 2, 3 & 5 and Stereo-based DSM from Worldview-2.
After neighbourhood analysis, these regions will change to building class. Figure 3 (top-left) illustrates the classification results. The red, green, blue and black colours depict the building, tree, water and ground classes, respectively.
2.2 Co-registration of two elevation models
The available DSMs are in different coordinate systems. Therefore, the co-registering process is been performed in terrain and building classes. The least squares 3D surface matching technique is one of the main techniques for co-registration of two surfaces introduced by Gruen et. al. (2005). The following equation is the optimization function for least squares 3D surface matching technique:
2
min
d
)0)Where
d
is Euclidean distance between two surfacesThe aim of the above equation is minimization of the sum of distances between two surfaces. Generally, the relation between
two orthogonal systems with different scales is described as below:
X
R
X
T
(2)Where
X = x , y , z
1 1 1
t= coordinates in the first system,
,
tx y z
T
t
t
t
= translationsR
= rotational matrix
1,
2,
3
diag
= scale in the coordinates axisesSince, in this paper the scale in x and y directions are equal and both systems have the same orientations, so the following terms are considered as constraints in optimization function:
1 2
&R
I
Figure 2.Flowchart of the proposed method
2.3 nDSM9 generation
After co-registration, the nDSMs of both DSMs are generated using hierarchical geodesic based filtering technique proposed by Arefi et. al. (2005). This technique extracts non-terrain objects by means of a method based on geodesic dilation.
2.4 Building blocks extraction
By considering the minimum building height on the test area as a threshold in nDSM generation technique, the building blocks are extracted and labelled. The building blocks in Worldview-2 DSM are extracted by using the result of classification process.
2.5 Corresponding block detection
The detection of corresponding building blocks is carried out using calculation of minimum overlapping area of the candidate buildings in both DSMs. Each building block in LiDAR DSM can contain several corresponding blocks in worldview-2 DSM and vice versa. The building blocks in each of the DSMs which has no correspondence in another one will be classified as destroyed or new building classes.
2.6 Updating the elevation model
The total difference value (TDV) of both nDSMs is calculated using following equation:
s laser worldview
TDV
abs DSM
DSM
(3)Where
s
= total area surface of block extracted in two elevation modelIf the calculated total differences value (TDV) for each building block is less than the predefined threshold value, the building is not changed and therefore, LiDAR elevation model should be used. Otherwise, if the TDV is more than the threshold value, it is not definitely classified as changed building particularly if changes happen on building boundaries. The small and elongated changes on building boundaries often happen due to interpolation effect during DSM generation. Difference will have large amount at big building blocks which has been illustrated in Figure 5. In order to determine the changed building correctly, the compactness parameter as an object-base criterion has been utilized. This parameter is calculated as following equation:
2
4 *
p
compactness
a
(4)Where
p
=perimetera
=areaThis parameter has maximum value for linear objects and has minimum value for closed objects like circles. With increasing the size of buildings, parameters such as area couldn't efficiency be used for change detection, whereas compactness is suitable criterion for detecting the building block changes. As shown in figure 6 can be seen, the result of this difference is a large object as a changed area with numerous small linear regions as spurious objects around it. These small elongated regions have high compactness value and therefore will be removed. With
9 Normalized Digital Surface Model
this way, only those parts of the building which has been changed will be updated. For each of the obtained regions from DSMs differencing, the compactness is measured. The regions of the selected building block with high compactness value are labeled as unchanged, otherwise are labeled as changed. If the building is located only in one of the available elevation models, the Worldview-2 DSM are used for updating. In non-building areas in both DSMs, the LiDAR DSM should be used to updating.
Figure 5.Top: Lidar DSM (right), Worldview-2 DSM (left), Bottom: The absolute difference between two DSMs (right), the sum of two DSMs (left)
Figure 6.Top: Lidar DSM (right), Worldview-2 DSM (Middle), RGB image (left), Bottom: updated DSM (right), the absolute difference between two DSMs (Middle), the sum of two DSMs (left)
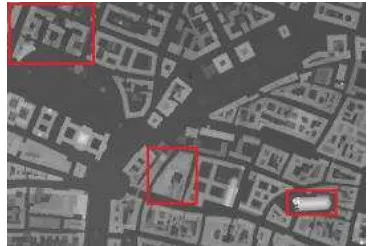
Figure 7.Visual assessment: Updated DSM from input Data. DSM has been changed in red areas.
3. IMPLEMENTATION
In this section the results of the proposed method for DSM updating which has been implemented, are described.
3.1 Co-registration of two elevation models
points on elevation models has been selected for conformal transformation of models. Then, two following constraints have been considered:
1 2
2
,t
x
t
y0
.These two DSMs has been normalized to [0, 1] range, hence the
values of λ3 and tz will be 1 and 0, respectively. After resolving the optimization function the unknown parameters are determined:
1
x
dt
,dt
y
1
,dt
z
0.2667
,d
1
d
2
0
,3
0.1598
d
.3.2 Result and discussion
As shown in Figure 9 the building block in LiDAR elevation model has been decomposed to four building parts in the
Worldview-2 elevation model. The obtained results demonstrate the success of proposed method for this example. Figure 10 displays a building block which has not been changed in real situation but due to an error occurred in Worldview-2 elevation model, the elevation model has been updated wrongly. As illustrated in Figures 7 and 8, qualitative evaluation proves the success of proposed method. In order to achieve numerical evaluation, a statistical analysis has been carried out on the results. For this purpose, mean, median and standard deviation are considered as statistical criteria to analysis the measured differences between LiDAR, Worldview-2 and updated DSMs. The difference of elevation models excluding vegetation is defined as follow:
(5)
1
Lidar Worldviewdifference
DSM
DSM
Figure 8.Visual evaluation of obtained results. Cross sections of Worldview-2 DSM (Top), Cross sections of Lidar DSM (Middle), Cross sections of updated DSM (Bottom). Code 1: unchanged areas, Code 2: changed areas.
2
Updating Worldviewdifferenc
DSM
DSM
Table 2 shows statistical criteria for two defined differences. The value of these parameters for difference2 is less than difference1 that demonstrates the success of proposed method.
Figure 9.Top: Worldview-2 DSM (right), RGB image (left), Middle: the sum of two DSMs (right), Lidar DSM (left), Bottom: updated DSM (right), the absolute difference between two DSMs (left)
difference2 (m) difference1(m)
DSM difference
2.6727 3.0857
Mean (abs)
1.6526 1.7198
Median (abs)
3.4216 4.3333
Standard deviation
Table 2.Characteristics relating to DSM difference
Figure 10.Top: Lidar DSM (right), Worldview2 DSM (middle), RGB image (left), Bottom: updated DSM (right), the absolute difference between two DSMs (middle), the sum of two DSMs (left)
4. CONCLUSION
This leads to a wrong updating result. Accordingly, it affirms the weakness of worldview-2 elevation model which produced by image matching of worldview-2 satellite stereo images comparing LiDAR DSM.
ACKNOWLEDGEMENT
The authors are grateful from DLR for giving data.
REFERENCES
E. Hanson and E. Wolff, “Change detection for update of
topographic databases through multi-level region-based classification of VHR optical and SAR data,” Int. Arch. Photogramm. Remote Sens. Spat. Inf. Sci., vol. 38, 2010.
E. Hanson and E. Wolff, “Change detection for update of
topographic databases through multi-level region-based
classification of VHR optical and SAR data,” Int. Arch. Photogramm. Remote Sens. Spat. Inf. Sci., vol. 38, 2010.
T. T. Vu, M. Matsuoka, and F. Yamazaki, “LIDAR-based
change detection of buildings in dense urban areas,” in
Geoscience and Remote Sensing Symposium, 2004.
IGARSS’04. Proceedings. 2004 IEEE International, 2004, vol. 5, pp. 3413–3416.
Krauss, T., Sirmacek, B., Arefi, H., & Reinartz, P. (2012). Fusing stereo and multispectral data from WorldView-2 for urban modeling. In Proc. of SPIE Vol (Vol. 8390, p. 83901X– 1)
J. Tian, H. Chaabouni-Chouayakh, and P. Reinartz, “3D building change detection from high resolution spaceborne
stereo imagery,” in Multi-Platform/Multi-Sensor Remote Sensing and Mapping (M2RSM), 2011 International Workshop on, 2011, pp. 1–7.
Gruen, A., & Akca, D. (2005). Least squares 3D surface and curve matching. ISPRS Journal of Photogrammetry and Remote Sensing, 59(3), 151–174.
Arefi, H., & Hahn, M. (2005). A hierarchical procedure for segmentation and classification of airborne LIDAR images. In INTERNATIONAL GEOSCIENCE AND REMOTE SENSING SYMPOSIUM (Vol. 7, p. 4950)
K. Choi, I. Lee, and S. Kim, “A feature based approach to automatic change detection from LiDAR data in Urban areas,”
Laserscanning09, pp. 259–264, 2009
J. Trinder and M. Salah, “Aerial images and LiDAR data fusion
for disaster change detection,” in The XXII Congress of the International Society for Photogrammetry and Remote Sensing, Melbourne, 2012, pp. 227–232.
J. Tian, H. Chaabouni-Chouayakh, P. Reinartz, T. Krauss, and
P. d’ Angelo, “Automatic 3D change detection based on optical
satellite stereo imagery,” in ISPRS TC VII Symposium, Vienna,
2010.
L. Zhu, H. Shimamura, K. Tachibana, Y. Li, and P. Gong,
“Building change detection based on object extraction in dense urban areas,” Int. Arch. Photogramm. Remote Sens. Spat. Inf. Sci. Beijing China, vol. 37, pp. 905–908.
J. Tian, P. Reinartz, and P. d’ Angelo, “Change Detection Analysis of Forest Areas Using Satellite Stereo Data.,” in GIL
Jahrestagung, 2012, pp. 311–314.
G. Vosselman, B. G. H. Gorte, and G. Sithole, “Change detection for updating medium scale maps using laser
altimetry,” Int. Arch. Photogramm. Remote Sens. Spat. Inf. Sci.,
vol. 34, pp. 1–6, 2004.
J. Zhang, Z. Zhang, H. FAN, Z. FANG, and Z. LIU, “Change
Detection in Urban Area Based on Stereo Image Pairs from
Different Duration,” Int. Arch. Photogramm. REMOTE Sens.,
vol. 33, no. B4/3; PART 4, pp. 1203–1208, 2000.
M. Rutzinger, B. Rüf, B. Höfle, and M. Vetter, “Change
detection of building footprints from airborne laser scanning acquired in short time intervals,” in ISPRS TC VII Symposium, 2010, vol. 100, pp. 475–480.
H. Murakami, K. Nakagawa, H. Hasegawa, T. Shibata, and E.
Iwanami, “Change detection of buildings using an airborne laser scanner,” ISPRS J. Photogramm. Remote Sens., vol. 54,
no. 2, pp. 148–152, 1999.
M. Rehor, “Classification of building damage based on laser scanning data,” Photogramm. J. Finl., vol. 20, no. 2, 2007.
F. Jung, “Detecting building changes from multitemporal aerial stereopairs,” ISPRS J. Photogramm. Remote Sens., vol. 58, no.
3, pp. 187–201, 2004.
T. Vögtle and E. Steinle, “Detection and recognition of changes
in building geometry derived from multitemporal laserscanning
data,” Int. Arch. Photogramm. Remote Sens., vol. 35, no. B2,
pp. 428–433, 2004.
H. Murakami, K. Nakagawa, T. Shibata, and E. Iwanami,
“Potential of an airborne laser scanner system for change detection of urban features and orthoimage development,” Int.
Arch. Photogramm. Remote Sens., vol. 32, pp. 422–427, 1998.
T. Santos, S. Freire, A. Fonseca, and J. A. Tenedório,
“Producing a building change map for urban management,”
EARSeL EProceedings, vol. 10, no. 1, p. 56, 2011.
J. Tian, J. Leitloff, T. Krauss, and P. Reinartz, “Region based
forest change detection from Cartosat-1 stereo imagery,” in ISPRS Hannover Workshop, 2011.
H. Chaabouni-Chouayakh, T. Krauss, P. d’Angelo and P.
Reinartz, “3D change detection inside urban areas using different Digital Surface Models,” In: PaparoditisN., Pierrot -Deseil li gny M., Mal let C., Tournai reO. (Eds), IAPRS, Vol. XXXVII I, Part 3B – Saint-Mandé, France, September 1-3, 2010
P. Wezyk, M. Szostak, P. Tompalski, and G. Zajaczkowski,
“The role of Airborne Laser scanning in updating and revising
GIS databases-a case study in the Polish State Forest (Chojna
District),” Proc. Silvilaser, 2010.