New Change Detection Techniques to monitor land cover dynamics in mine environment
Suparn Pathak
Scientist/Engineer “SF”
Regional Remote Sensing Centre–West (RRSC-W) National Remote Sensing Centre (NRSC) ISRO/Department of space, Govt. of India
CAZRI Campus, Jodhpur 342 003 [email protected]
Phone :+91-291-2660830 FAX : +91-291-2786516
Commission VIII, WG VIII/8
KEY WORDS: Change Detection, Segmentation, Multitemporal, High resolution, Iteratively Re-weighted Multivariate Alteration Detection (IR-MAD)
ABSTRACT:
Land use and land cover are dynamic and is an important component in understanding the interactions of the human activities with the environment and thus it is necessary to simulate environmental changes. Land use/cover (LU/LC) change detection is very essential for better understanding of landuse dynamic during a known period of time for sustainable management. Mining is one of the most dynamic processes with direct as well as indirect impact on the environment. Hence, mine area provides ideal situation for evaluating the chronological changes in land-use patterns. Digital change detection of satellite data at different time interval helps in analyzing the changes in the spatial extent of mine along with the associated activities. In present study, various algorithms Iteratively Re-weighted Multivariate Alteration Detection (MAD) on raw data where class wise comparison becomes a difficult proposition and object based segmentation and change detection as post classification comparison were assessed.
1. INTRODUCTION
1.1 Change detection
Change detection is the process of identifying differences in the state of an object or phenomenon by observing it at different times (Singh, 1989). With increasingly intensifying social and economic development, the local ecological environment has changed dramatically. Change detection is an important process in monitoring and managing natural resources and assessing Environmental impact because it provides quantitative analysis of the spatial distribution of changes. (Macleod and Congation, 1998) list four aspects of change detection which are important when monitoring natural resources:
i. Detecting the changes that have occurred ii. Identifying the nature of the change iii. Measuring the area extent of the change iv. Assessing the spatial pattern of the change
1.2 Change detections Techniques
Many techniques have been developed which can be organised into algebraic/statistical, change vector/transformation, classification or combinations of them. Different change detection algorithms that were documented in the literature include:
1. Mono-temporal change delineation. 2. Delta or post classification comparisons.
3. Multidimensional temporal feature space analysis. 4. Composite analysis.
5. Image differencing.
6. Multi-temporal linear data transformation. 7. Change vector analysis.
8. Image regression.
9. Multi-temporal biomass index 10. Background subtraction. 11. Image ratioing
The basic premise of “Everything is related to everything but near things are more related than distant things”. Spatio-temporal interpolation to generate voxel-field data in a space-time domain from observational data is indispensable to many spatio-temporal reconstruction and visualization of dynamic spatial phenomena (Shibasaki and Huang, 2001).
1.3 Literature review
resolution level set (MLS) evolution and support vector machine (SVM) classification, which combined both the pixel-level method and the object-pixel-level method (Cao, 2014). Radiometric normalisation of image is prerequisite for any change detection (Mateos, 2010). Relative normalisation based on intrinsic radiometric information of the images is an alternative method instead of absolute normalisation.
1.4 Study area
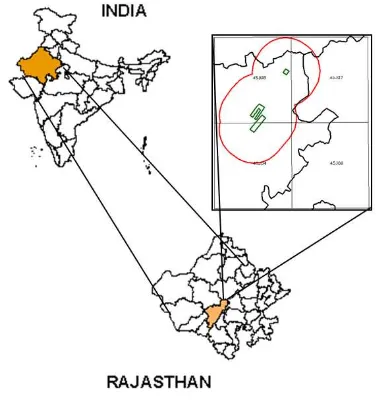
Study was conducted on lease area of Rabariyawas lime stone mining area in Jaitaran tehsil of Pali district in Rajasthan. This is the northern tip of the district and lies between Latitude 26º04’01” and 26º29’53” N and Longitude 73º58’37” and 74º35’49” E covering total area of 1916 ha comprising of three segments. Nearest town is Beawar, Ajmer district is about 35 km from factory/mine area. Study area is covering around 845 sqkm area comprising of 10km buffer around three mining blocks. Geologically the leased area belongs to Raialo group of limestone and marble, which has good potential for mining.
Figure 1: Study area
2. MATERIAL & METHOD
2.1 Data used
Satellite data – Indian remote sensing satellite data (IRS-P6 LISS-III 94/53, 09 January 2006, LISS IV 202/63, 07 January 2010,& PAN data of IRS-P5 512/276 05 March, 2006 & 12 April 2009) were used for change detection in land use/cover. Reports of both land use/cover as baseline as well as updation and rainfall data of 1999-2010. PAN sharpened multispectral image were used within lease area.
2.2 Change detection strategies
The land use /cover changes were identified for 10km buffer of lease area using hybrid classification approach. Gain and loss per category were assessed using LCM. Subsequently, within lease area IR-MAD and OBIA techniques were compared for change detection.
2.2.1 Land Change Modeler Technique: The change modeling using Artificial Neural Network (ANN) are based on the transition rule specified, which is very critical to the model. This model is based on biological neural network. It is made up of interconnected group of artificial neuron. It consists of three types of data layers: input data layer, hidden layers and output layers. As the human brain model can be trained to learn from sample data during initial phase parameter values are modified until model can generate acceptable output. Therefore, it falls in the category of semi-parametric model of probability density estimation. ANN based models are able to simulate better when non-linear complex system exist.
The Land use classes for each overpass dates were assigned class values based on land utilization and separate land use maps for the year 2006 and 2010 were generated. For change evaluation the aggregated land use/cover maps (2006 and 2010) were used separately. Land Change Modeler (LCM) software an extension product by Clark lab of the University, USA on Arc/Info GIS was used for analysis. Change detection over a period of time is assessed based on post classification comparison where two input layers of both seasons viz. 2005-06 and 2009-10 were taken and logical output was generated.
A set of tools is included for the rapid assessment of change, allowing for one-click evaluation of gains and losses, net change, persistence and specific transitions both in map and graphical form. In some situations, the amount and nature of change can be very complex. LCM includes a change abstraction tool, based on trend surface analysis, to uncover the underlying trends.
2.2.2 Iteratively Reweighted Multivariate Alteration Detection (IR-MAD). Change detection using remote sensing technique is based on basic premise that change in land use must result in change in radiance value and this must be substantially large/different from changes due to any other factor. Various algorithms including Multivariate alteration detection (MAD) works on raw data and class wise comparison becomes a difficult proposition. The core idea of MAD is to find out maximum differences between two images by removing correlations between them as much as possible (Zhang, 2007).
The implementation of this programme reads two multi-spectral images having same spectral/spatial dimension and generates canonical variates and chi-square statistics which is subsequently used for radiometric normalisation (Canty, 2007). Instead of difference between two point of time data they are combined into single image. To maximise variance under the constraint of variance of individual image is equal to one, vector which minimize the correlation is desired. This is achieved by canonical correlation analysis. Resultant first variate has maximum variance and so on, but depending upon type of changes e.g. small scale changes will come in higher order MAD variate. Time invariant difficult to find and choice of reference is cumbersome.
2.2.3 Object based change detection: While working with high resolution data pixel-based methods are have limitation as more than application requirement changes are shown which leads to ‘salt-pepper’ appearance. This accentuate to use post classification smoothening. With the advances in satellite sensor technologies as to spatial resolution, the concept of object-based image analysis (OBIA) has been become widely-used in different remote sensing applications.
The basic idea of the approach is that image interpretation is not based only on the interpretation of single pixels but on whole object structures. Therefore, we do not classify only single pixels but groups of pixels that represent already existing objects. In addition our interest was not in absolute classification accuracy but changes in the vegetation status due to mining activity.
The first step in the object-based change detection analysis is image segmentation to create an analysis layer that holds all the objects which are necessary for the change detection analysis. These objects are derived from normalised images in the previous method both the 2006 and the 2010 combined land cover maps. To prepare such a map, two different maps were prepared and stored at separate levels and grouped based on threshold of NDVI values thus individual land cover maps were used as thematic layers in polygon format during the segmentation process. The use of thematic polygon layers restricts the segmentation to the boundaries that separate different land cover classes. Subsequently the output of vegetated polygons was merged and non-vegetated polygons were merged creating binary output.
In the second step, to detect land cover changes by comparing all the polygons resulting from the segmentation process with the vegetation layers of 2006 and 2010. Remaining land cover changes occurred if a corresponding polygon has different vegetation status in the 2006 or 2010 thematic layers.
3. RESULT & DISCUSSION
3.1 Classification
The IR-MAD output is still a component, although with higher information content, to convert them into thematic classification and label them as real world.
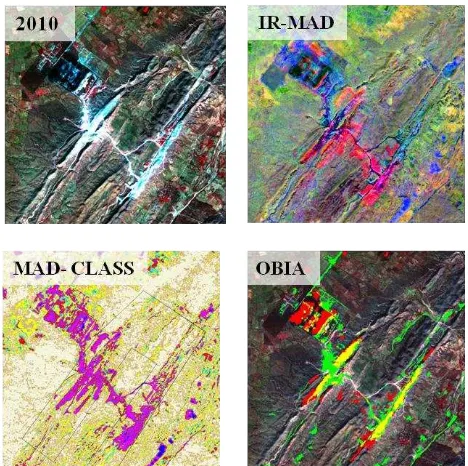
Un-supervised classification of IR-MAD output after 25 iterations was performed depicted in figure 2 (left bottom). Magenta and pink color shows changes in mining fringe area and mining pit/dump. Cyan and yellow color indicated change in shadow regions as the mining is along strike ridges. Beige and light brown areas are no change and blue is change in dense vegetation area.
In the object based image analysis (OBIA) changed output overlaid on FCC (bottom right) bright red & green color shows non-vegetal area in 2006 & 2010 and yellow show common non-vegetal area in both the years.
Figure 2. A subset of the multi-temporal images (FCC) of 2010 & the MAD component (top).The classification result of IR-MAD and object based segmentation indicating the land cover changes (bottom).
3.2 Change analysis
In IR-MAD method unlike post classification comparison there is single output for 2006 & 2010 and one needs to label common non-vegetal area in both the years, accordingly total changed area is due to mining activity is around 2 Sqkm during this period (table below).
Change description Area (sqkm) Changed to mining in fringe area 1.374
Changed to mining dump 0.717
Total change 2.091
For object based segmentation and change detection, it is very difficult to separate the active mining /pit and dump area because of similarity in spectral signature without additional information. However the variation picked using object oriented segmentation are tabulated below in the form of no-vegetation category confined to lease and factory area as object.
Change description Area (sqkm)
No-vegetation2006 0.910
No-vegetation2010 1.350
No-vegetation2006-2010 0.563
Total change 2.823
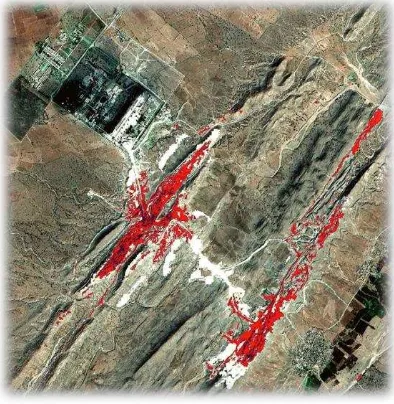
Figure 3. Change due to mining activity (Red colour shows status of mining in 2006)
3.3 Accuracy assessment
The accuracy of individual classification and change detection were carried out in case of change detection the modified error matrix, the rows present the categories as derived from the images due to applying IR-MAD & object based change detection technique, while the columns present the categories identified from the reference maps. Accuracy assessment of change detection is mainly based on pixel and little work has been done to assess accuracy for feature-level or object-level change detection (Jianya, 2008). Recently, a similarity matrix based geometric and classification accuracy has been suggested particularly for object based analysis where object classification accuracy is important instead of pixel (Lizarazo, 2014).
The overall classification accuracies of LULC maps of all 2006, and 2010 were - 72 % & 86% with Kappa statistic of 0.6513 & 0.7286, respectively. The accuracy of change detection using IR-MAD was 78% with Kappa statistic of 0.6942 compared to object based change detection method where overall accuracy was 89% with Kappa statistic of 0.7711. Main error emanated in IR-MAD method as it has identified shadows as change whereas in object based method such changes were ignored.
4. CONCLUSIONS & LIMITATION
4.1 Conclusion
Both methods have own merits useful in different domain while former is preferred method where inputs are comparable satellite data while later combining high resolution data and the information from various sources a segmented image provides better solution.
IR-MAD output needs to be classified for quantification of changes and further post classification smoothened to avoid pixel based “salt pepper” appearance. Object based classifier allowed variable threshold to individual image and therefore better control over the segmentation.
Such controlling parameters improve the accuracy of change detection. The changed area as quantified by both methods is around 2 sq km. and accuracy of assessment of change is better in segmentation.
Major driver of change in mining area is human activity unlike natural environment. Increase in mining pit/dump area in the leased boundary of Rabariyawas –II and overall increase in the plantation area is evident over the years.
4.2 Change Detection Limitation
Although the process of change detection may seem straightforward from the descriptions above, there are limitations, and most are attributable to the incomplete manifestations of change within satellite imagery. Limitations in image characteristics include spatial and temporal resolutions, spectral matching of key indicators of change, view and illumination angles, atmospheric conditions and radiometric corrections/calibration, and geographic registration. Selection of threshold value and if each of these perturbing factors is carefully considered and minimized through the change detection effort, a useful result may be revealed.
Multi-source data can partially help in overcoming the first limitation while improved techniques can reduce the error associated with feature/object level comparison rather than pixel.
ACKNOWLEDGEMENTS
Author is grateful to Dr. V. K. Dadhwal, Director, and Dr. P.G. Diwakar, Dy. Director (RSAA), NRSC Hyderabad for encouragements and support.
REFERENCES
Afify, H. A. 2011.Evaluation of change detection techniques for monitoring land-cover changes: A case study in newBurg El-Arab area. Alexandria Engineering Journal. Vol50, pp 187–195
Canty, M.J., 2007. Change detection-Iteratively reweighted multivariate alteration detection. In: Image analysis, classification and change detection in remote sensing. CRC press, Taylor & Francis. ISBN 0-8493-7251-8, pp. 245-247
Canty, M.J., Nielsen, A. A. 2008 Automatic radiometric normalization of multitemporal satellite imagery with the iteratively re-weighted MAD transformation. Remote Sensing of Environment, Volume 112 (3), pp 1025-1036
Cao, G., Li, Y., Liu, Y., Shang, Y.2014. Automatic change detection in high-resolution remote-sensing images by means of level set evolution and support vector machine classification, International Journal of Remote Sensing, 35:16, pp.6255-6270, DOI: 10.1080/01431161.2014.951740.
Gutiérrez, J. A., Seijmonsbergen, A., Duivenvoorden, J., 2010. Optimizing land cover change detection using combined pixel-based and object-pixel-based image classification in a mountainous area in Mexico. Anais XV Simpósio Brasileiro de Sensoriamento Remoto - SBSR, Curitiba, PR, Brasil, 30 de abril a 05 de maio de 2011, INPE p.6556
regrowth in a time series. Photogrammetric Engineering & Remote Sensing Vol. 67(9), pp. 1067–1075.
Macleod, R.D.,Conglaton,R.G. 1998. A quantitative comparison of change detection, algorithm for monitoring Elegrass from remote sensing data. Photogrammetric Engineering and Remote Sensing, Vol. 64(3), pp. 207-216
Jianya, G., Haiganga, S., Guoruia, M. and Qimingb, Z. 2008.A review of multi-temporal remote sensing data change detection algorithms. The International Archives of the Photogrammetry, Remote Sensing and Spatial Information Sciences. Vol. XXXVII. Part B7pp. 757-762
Lizarazo, I. 2014. Accuracy assessment of object-based image classification: another STEP. International Journal of Remote Sensing, 35:16, pp. 6135-6156, DOI: 10.1080 / 01431161.2014.943328.
Lu, D., Mausel, P. , Brondízio, E. and Moran, E. , 2004.Change detection techniques, International Journal of Remote Sensing, 25:12, 2365-2401, DOI: 10.1080/0143116031000139863
Mas, J.F., 1999. Monitoring land-cover changes: A comparison of change detection techniques. International Journal of Remote Sensing. 20:1, pp. 139-152, DOI: 10.1080/014311699213659
Mateos, C.J.B, Ruiz, C.P., Crespo, R.G., Sanz, A.C., 2010. Relative Radiometric Normalization of Multitemporal images. International Journal of Artificial Intelligence and Interactive Multimedia, Vol. 1 (3). pp.54-59 DOI: 10.9781/ijimai.2010.139
Nielsen, A. A. 2007. The regularized iteratively reweighted MAD method for change detection in multi-and hyperspectral data. IEEE Transactions on Image Processing, Vol 16(2) pp 463-478.
Singh, A. 1989. Digital change detection techniques using remotely sensed data. International Journal of Remote Sensing, Vol 10(6), pp.989-1003
Shibasaki, R ., Huang, S. 2001.Integration of Observational Data and Behavioral Models for Spatio-Temporal Interpolation —Application to Reconstructing Long-Term Land Use and Land Cover Changes . In: Present and Future of Modeling Global Environmental Change: Toward Integrated Modeling, Eds., T. Matsuno and H. Kida, pp. 293-309
Walter, V. 2004. Object-based classification of remote sensing data for change detection. ISPRS Journal of Photogrammetry and Remote Sensing, Vol.. 58 (3), pp. 225-238
Yu, Q. Gong, P., Clinton, N., Biging, G., Kelly, M., Schirokauer, D. 2006. Object-based detailed vegetation classification with airborne high spatial resolution remote sensing imagery. Photogrammetric Engineering and Remote Sensing, Vol. 72(7), pp. 799-811
Zhang, L., Liao, M., Yang, L., Lin, H.2007. Remote Sensing Change Detection Based on Canonical Correlation Analysis and Contextual Bayes Decision. Photogrammetric Engineering & Remote Sensing Vol. 73 (3), pp. 311–318.