SHADOW ANALYSIS TECHNIQUE FOR EXTRACTION OF BUILDING HEIGHT
USING HIGH RESOLUTION SATELLITE SINGLE IMAGE AND ACCURACY
ASSESSMENT
P.L.N. Rajua *, Himani Chaudharyb and A.K. Jhaa
a
Remote Sensing and Geoinformatics Group, Indian Institute of Remote Sensing, ISRO, Dehradun, India - [email protected] b
G.D. Colony, Mayur Vihar Phase 3, New Delhi, 110096 - [email protected]
Commission IV, WG I/V4
KEY WORDS: High Resolution Satellite Data, Automatic Extraction, Shadow Analysis
ABSTRACT:
These High resolution satellite data with metadata information is used to extract the height of the building using shadow. Proposed approach divides into two phases 1) rooftop and shadow extraction and 2) height estimation. Firstly the rooftop and shadow region were extracted by manual/ automatic methods using Example – Based and Rule – Based approaches. After feature extraction next step is estimating height of the building by taking rooftop in association with shadow using Ratio Method and by using the relation between sun-satellite geometry. The performance analysis shows the total mean error of height is 0.67m from ratio method, 1.51m from Example – Based Approach and 0.96m from Rule – Based Approach. Analysis concluded that Ratio Method i.e. manual method is best for height estimation but it is time consuming so the automatic Rule Based approach is best for height estimation in comparison to Example Based Approach because it require more knowledge and selection of more training samples as well as slows the processing rate of the method.
1. INTRODUCTION
1.1 Background
The advent of very high resolution (VHR) satellite imagery (CARTOSAT, IKONOS, QuickBird, WorldView-2) has made it possible to observe the objects in an urban scene at finer details which facilitates classification and extraction of urban features. The increasing availability of high resolution satellite images has provide the better source for building height extraction as comparison to aerial photograph because they provide several advantages including the cost and accessibility. High resolution satellite image provides good basis reorganization and monitoring of structural changes to map the urban details. Higher the resolution of the image, more man - made objects could be identified easily such as building, roads, moving objects etc. Various researches have been done using high resolution satellite data. Singh et al., 2012, Z. Ziaei et al., 2013, Song et al., 2013, Benarchid et al., 2013 and Lee et al., 2010 used high resolution satellite data either multispectral or panchromatic and stereo pair of the satellite data to extract the buildings, roads, and also to estimate the building height. The acquisition of height information and its precision have direct influence on its utility, particularly in preparation of topographic maps, terrain analysis, infrastructure development and many engineering studies etc. There are many methods available for height information extraction, in which the main methods are ground surveys (field direct measurements) and from satellite data by using different processes like stereo data of optical data, interferometric methods, LiDAR data techniques etc. but these data are costly and require sophisticated processing software tools and highly skilled manpower. The simple approach of height information extraction is tried to overcome these problems. In this project, height information of the buildings is extracted from the shadow using remote sensing satellite data. Shadow exists obviously in high resolution satellite image and is defined as “an area where direct light from
a light source cannot reach due to obstruction by an object”. But shadow in Remote Sensing analysis, are considered as a noise which may cause the loss of information in the shadow area so various automatic, semi-automatic techniques are to be developed to detect and remove the shadow. Song et al., 2013 proposed a method for shadow extraction and reconstructions using high resolution satellite data, first shadows were extracted using three steps thresholding, morphological filtering, and edge compensation and then reconstruction of shadow has been done using two steps: example-based training and shadow reconstruction via Bayesian belief propagation (BBP). Santosa et al. used high resolution Quickbird Image with LIDAR data to extract the buildings.
When considering the shadow cast by a typical high-rise building, there are actually two shadows present: the cast shadow (the one cast on the ground) and the self-shadow (the part of the object that is not illuminated, i.e., the façade of the building). In this study cast shadow obtained in high resolution satellite data is used to calculate the building height. Many researchers analysed shadow to extract the building height from image metadata, shadow properties, sun angle and sensor orientation. Comber Alexis et. al.(2012) provides rule-based approach to extract the building height using shadow in which they classifies the building shadow based on their relative density within scene characteristics, spatial context, rules for which are determined empirically against geo-located photograph of the study area. This approach was suitable for the analysis which may require approximate measure of the building height. Lee and Kim (2010) proposed the method for extracting building height and footprint to create the 3D building model by using VSA (Volumetric Shadow Analysis) from single image of commercial database and the direction of sun and camera was estimated by simple image measurement and a known height of the building. Benarchid et al. (2013) presented an automatic building extraction using object-based
classification and shadow information in very high resolution multispectral images applied to Tetouan city (Morocco). Lee et al.(2013) proposed an intelligent scheme based on the VSA for automatic building height extraction. They achieve this by checking the location change of projected shadow lines with respect to the actual shadow regions while building heights are increased incrementally. In their research, the performance of the proposed automatic height extraction was compared to that of manual extraction. Hartl et al. (2007) delimited the building heights and the heights' distribution of a city from the shadows that are identified on a panchromatic SPOT-image. Seok et al. (2008) use the shadow information and building footprint to estimate the building height for generating the 3D building model. Alhaddad et al. (2008) also used shadow information to extract the building height but the building which was densely distributed in some area and the shadow of one building was usually mixed with the shadow of other buildings on the image, some building height could not be estimated directly from the shadow. In this case they use airborne laser scanner to help in calculate the height. In the project Building and their respected shadow is extracted and the height of the building is calculated. Automatic extraction technique is used to extract both features. Traditionally, features were extracted manually which is time consuming and tiresome so automatic extraction is the best way to extract the features to save the time. Singh et al. (2012) proposed an approach for building extraction from very high resolution (VHR) multispectral images using NDVI (Normalized Difference Vegetation Index) based segmentation and morphological operations.
In this study, the building height is calculated using the methodology adopted from Shettigara et. Al, 1998 where the buildings were extracted manually and automatically and shadow region also extracted automatically using object-based approach because due to the existence of extreme level of detail in very high resolution urban satellite images (VHRSI), object-based methods are being increasingly employed for feature extraction. After extraction the common line segment of building and shadow is extracted and then height is calculated using the shadow width and the metadata information i.e the azimuth and elevation angles of satellite and the sun. The shadow width is obtained by dividing the area of shadow zone and the length of the zone. On the other hand another method also used to calculate the building height in which no metadata information is used only but the shadow length of the building is used.
2. STUDY AREA
Study area is Indian Institute of Remote Sensing (IIRS) campus, a premier institute in transferring the technology in the field of Remote Sensing and Geoinformatics and capacity building to User Organisations. It is located in the city of Dehradun, India. The extent of the study area lies between 30020’ 20” N - 300 20’ 32” N and 78002’ 00” E
- 78002’ 52” which covers an area of approximately 2 km2. Basically study area of IIRS campus is located at Kalidas road, Dehradun, Uttrakhand. The total area of the campus is approximately 10 Ha. It covers residential, non- residential, official buildings. Figure 1 shows study area including high resolution satellite for the IIRS Campus.
Figure 1.Study area in respect of Dehradun district and India
3. MATERIAL AND METHODOLOGY
3.1 Data Used
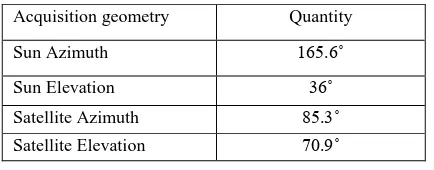
This research was carried out by using High Resolution Remote Sensing Satellite Data i.e. QUICKBIRD, It provide Panchromatic data and Multispectral data. Panchromatic data of the Dehradun city acquired on December06, 2007 was used. Acquisition Geometry (azimuth and elevation angle of sun and satellite at the time of data acquisition which is shown in table 1) of the satellite data were used to know the direction of shadow and to calculate the building height.
Acquisition geometry Quantity
Sun Azimuth 165.6˚
Sun Elevation 36˚
Satellite Azimuth 85.3˚
Satellite Elevation 70.9˚
Table 1: Azimuth and elevation angles of sun and satellite at the time of data acquisition
3.2 Methodology
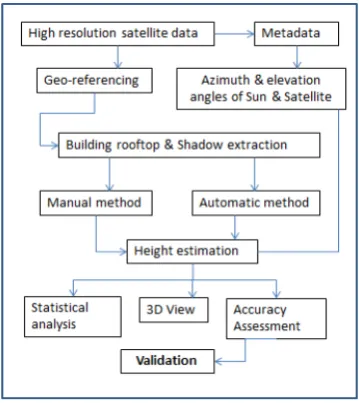
Methodology adopted in the project is based on the estimating building height using shadow analysis technique from single high resolution QUICKBIRD satellite data and the metadata information. Project divides into two phases: 1) Rooftop and shadow Extraction and 2) Estimating Building Height. Rooftop of the Building is extracted manually and automatically. Similarly Shadows are also extracted automatically. Two automatic extraction techniques are used i.e. Example Based and Rule Based Feature extraction methods. After extraction next step is estimating building height using shadow length and sun- satellite geometry. Shadow length is obtained by dividing the area of shadow zone and the length of the zone. On the other hand anther method i.e. ratio method is also used to estimate building height using one reference building and the other unknown building. Before performing above steps data firstly is geo-referenced and the subset of the IIRS Campus from satellite data is extracted using ERDAS IMAGINE. Overall flowchart of methodology is shown in figure 2.
Figure 2. Overall flowchart of methodology
4. ANALYSIS AND RESULTS
4.1 Rooftop and Shadow Extraction
Rooftops and the shadow of the buildings were extracted manually i.e digitization and automatically using two techniques Example and rule based techniques.
4.2 Automatic Extraction
Automatic extraction is two steps process 1) Segmentation, and 2) Classification. ENVI5.0 was used to perform the automatic Extraction which uses an Object-Based Approach to classify imagery of the satellite data. ENVI Feature Extraction is the combined process of segmenting an image into regions of pixels, computing attributes for each region to create objects, and classifying the objects (with rule-based or supervised classification) based on those attributes, to extract features. Figure 3 show the step by step process of automatic extraction of buildings and their shadows using two techniques.
Figure 3: Automatic shadow feature extraction
4.3 Example Based Technique
Segmentation: Segmentation is the process of partitioning raster image into objects by grouping neighbouring pixels with common values. The objects in the raster image ideally
correspond to real-world features. Choosing a high Scale Level causes fewer segments to be defined, and choosing a low Scale level causes more segments to be defined. We should ideally choose the highest Scale Level that delineates the boundaries of features as well as possible. Good segmentation ensures that classification results are more accurate. If we choose too high of a Scale Level, the boundaries between segments will not be properly delineated and you will lose features of interest. Table 3 shows the segmentation parameters used to delineate the required features.
Algorithm Edge
Scale Level 55.6
Merge level 82
Kernel Size 3×3
Table 3: Segmentation parameters
Figure 4 show the output result of the segmentation. In which shadow region of the building is segmented properly, shown in black colour and the building segments in small-small segments.
Figure 4: Segmentation output
4.4 Classification:
Supervised classification is the process of using training data (samples of known identity) to assign objects of unknown to one or more known features. Proper training samples we select, the better the results from supervised classification. For this study SVM Classification approach is used to classify the image. Support Vector Machine (SVM) is a supervised classification method derived from statistical learning theory that often yields good classification results from complex and noisy data. It separates the classes with a decision surface that maximizes the margin between the classes. The surface is often called the optimal hyper-plane, and the data points closest to the hyper-plane are called support vectors. The Output of final result was stored in Raster form as well as vector form and the final extracted features are shown in figure 5.
Figure 5: Output of the SVM Classification
From the classification data, the required Building and Shadow were extracted and shown in figure 6
Figure 6: Extracted Buildings and their Shadows
4.5 Rule - Based Feature Extraction
Rule-based classification is an advanced method in which we define features by building rules based on object attributes. Rule-based classification is a powerful tool for feature extraction, often performing better than supervised classification for many feature types. Rule-building is primarily based on human knowledge. Table 4 shows rules used for extraction of shadow features.
Attribute Range
Spectral Mean < 193.54865
Spectral Min Max 191.64826 – 203.46077
Area 125.53844 – 262
Length 73 – 111.31947
Compactness 0.11796 – 0.20156
Main Direction 0.03571 – 40.98214 Table 4: Rule Set used for Shadow Extraction
Like example based, firstly segment the image using scale and merge level and then build the rules to extract the features. Rules are built on the basis of spectral (mean, std, max, min), texture (mean, range, entropy), spatial (area, length, compactness, main direction, elongation, etc.) attributes. In the study only shadow region is extracted using this technique. So to calculate the height of the building the digitized building and automatically extracted shadow is used. Figure show the shadow extracted automatically in which extra shadow also extracted but shadow region of the building is required so the required shadow region is obtained by using ArcMap10. And the obtained shadow region is shown in figure 7
Figure 7: Extracted Shadow
4.6 Height Estimation
Height of the building is calculated using two methods:
1) Method based on Sun- Satellite Geometry.
2) Ratio Method
4.6.1 Method based on Sun-Satellite Geometry
Height of the building is measured by using equation (A) obtained from V.K. Shettigara et. al., 1998. If the sun and sensor geometry are known, it is fairly simple to establish a relationship between shadow lengths and the heights of objects
Figure 8 shows the sun-satellite geometry as an end view (2D display of 3D geometry for simplicity). As illustrated in the figure, the shadow part seen by the sensor is dependent upon its location with respect to the sun and the buildings.
Figure 8: End view of the sun-satellite-building configuration as seen during imaging
Figure 9: Plan view of the sun-satellite-building configuration as seen during imaging
For relating shadow width to object (building) height, few assumptions were made (Figure 9). First, the object is assumed to be vertical, that is, the object is perpendicular to the Earth's surface which is flat. Second, the shadows are cast directly onto the ground. Third, it is also assumed that the shadow starts from the bottom of the building on the ground. Using Figure 8, the shadow width along the sun azimuth as
Ssu = ht/tan (θsu) (1)
The shadow width obstructed along the azimuth of the sensor (Figure 8) by the object (tree) in the sensor's field of view is
Ssa = ht/tan (θsa). (2)
The component of the shadow of the object along the normal to the building line (Figure 9) is:
Ssun = Ssu .Cos (ϕsun) (3)
The component of the shadow obstructed by the object along the normal to the tree line (Figure 9) is
Ssan = Ssa.Cos (ϕsan) (4) Where,
ϕsun = ϕsa + 90 –ϕt. ϕsan = ϕsu + 90–ϕt.
and in which ϕsa, ϕsu, ϕt are the azimuth of sun, image scan line (satellite azimuth), and building line respectively as shown in figure.
Height of the building as
ht= s/{[cos(ϕsun)tan(θsu)] - [cos(ϕsan)/tan(θsa )]} (A)
Where, “s” is the shadow width (area of the shadow zone divided by the length of the zone).
4.6.2 Ratio Method
This is another method used in the study to calculate the building height manually without using metadata information in which building height of unknown building is measured by taking the ration of height of reference building multiplied by the shadow length of the unknown building and the shadow length of the reference building and the formula is
Hun = (hr * SLun) / slr (B) Where:
Hun: height of the unknown building.
hr: height of the reference building (measured manually from the ground).
SLun & slr : shadow length of unknown and reference buildings (both length measured from the satellite Data).
5. CONCLUSSIONS
5.1 Rooftop and Shadow Extraction:
Rooftop and shadow features are extracted manually (only rooftop) and automatically. Buildings manually digitized to extract the corner edges of the buildings from satellite data because 1) to measure shadow length manually, assumption is made that the length is measured from the building rooftop corner to the end of the shadow corner of the respective building. 2) The rooftop is used to estimate building height in association with automatically extracted shadow region (obtained from Rule – Based approach). Total numbers of extracted rooftops are 35.
Automatic extraction of both rooftop and shadow are done using Example – Based and Rule – Based approaches. In Example – Based approach both features are extracted. Numbers of buildings extracted are: 29 and shadow regions are: 26 and in Rule –Based approach 28 shadow region of the buildings are extracted out of 35 regions of actual buildings. Table 5 provide a brief summary of total number of building rooftop and Shadow region extraction.
S.N
o Features
No. of building
s
Example based Approach
Rule based Approach
1 Building
Rooftop 35 29
Not Extracted
2 Shadow
Regions 35 26 28
Table 5: Extracted rooftop and shadow region
5.2 Height Estimation:
After extraction, height of the building is estimated using 1) Ratio Method 2) sun-satellite geometry formula.
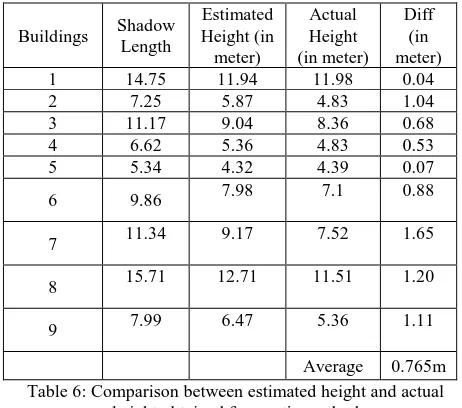
Ratio method is manual method in which shadow length measure manually and then height of the building extracted. This method provides total mean error of 0.67m but this is time consuming method. Table 6 show the Comparison between Estimated Height and Actual Height of the building using Ratio Method. Table 6: Comparison between estimated height and actual
height obtained from ratio method
Another method used is based on Sun Satellite geometry to estimate height of the building and calculated the height using “equation A” but there is a problem that height of the building goes into decimal value because of the azimuth angle (ϕt) of the buildings is 180˚. Table 7 and 8 shows the comparison between actual height and the estimated height using Example Based and Rule - Based approach respectively. Total mean error from both the approaches is: 1.51m and 0.96m respectively. Rule based approach provide better result of building height in comparison of Example Based approach.
Table 7: Comparison between estimated height and actual height obtained from example based approach
B
Table 8: Comparison between estimated height and actual height obtained from rule based approach
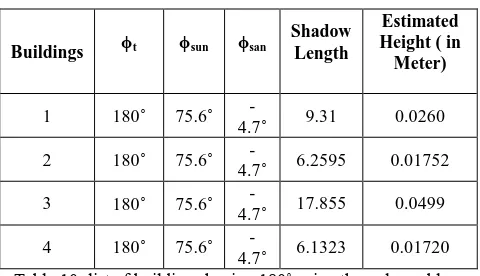
In the table, ϕt are the azimuth angle of building line, and ϕsun, ϕsan, arethe azimuth angle of thesun and satellite with respect to the shadow of the buildings respectively.
6. RECOMMENDATIONS
Proposed approach extracted features such as building rooftop and shadow from the satellite data and utilized both outcomes to estimate the height of the building. Automatic building extraction using remotely sensed data suffers with some problems, especially in urban areas due to spectral complexity
in scene. Similarly for automatic extraction of shadow problem occur in highly dense urban areas.
Some of the problems facing during the extraction process for both the Example Based and Rule Based techniques are:
Buildings lying in low and poor contrast image could not be extracted using QuickBird data,
Some Objects have similar spectral reflectance as the buildings have.
Spectral reflectance of the buildings and trees shadow are almost same so problem occur to extract the required building shadows.
6.1 Feature Detection on High Resolution Satellite data High Resolution Imagery like Quickbird reveals detailed information about ground. High resolution data gives texture, shape, spectral values and spatial resolution etc. In the study firstly the rooftop of the buildings are extracted manually using ArcMap 10 to identify the building corners for further processing. But this process is time consuming so the automatic extraction of rooftop and shadow is performed. These detailed information causes imprecise feature extraction using pixel – based approaches due to high tonal variation. In this regard, object – based method serves the purpose to extract buildings and shadow as an object. An object oriented approach was one of the most existing methods to extract the buildings as well as the shadow using high resolution satellite data. For that ENVI feature extraction module is used. Edge detection algorithm used in the segmentation process to segment the images. In segmentation, the parameter like scale level, merge level have greater influence. Once these parameters are set properly, better outputs can be extracted. knowledge for selecting training data samples and other parameters to perform SVM classification. So to reduce this problem, another method is adopted for feature extraction i.e. rule based technique.
6.3 Rule- Based Technique
The main problem with this technique is selection of rule set for feature extraction. More selections of attributes provide better extraction result. Once the rule set is created it extract required features from the image.
Merits:
Required class is generated no need to generate extra classes unlike Example- Based.
No need for selection of training data.
Classification is not required.
Demerits:
Required proper knowledge of selection of attribute and generation of rule- set for feature extraction.
6.4 Height Estimation
The main problem or we can say an error occur in the height estimation process is that the few building have their azimuth angle is 180˚ which causes the height of the building goes into decimal value and this error is not acceptable. Table 9 and 10 shows the buildings which have 180˚ azimuth angle have problem in extracting heights properly.
Buildings ϕt ϕsun ϕsan Table 9: List of buildings having 180˚ azimuth angle problem
using Example Based Technique Table 10: list of buildings having 180˚ azimuth angle problem
using Rule based method
After calculation the height of the building for both the techniques it is concluded that rule – based method in association with manually extracted building is best in comparison of example based technique.
The method adopted is applicable and provide good results on the spacious area where shadow cast on the ground directly but not applicable for the congested or we can say the dense urban areas where shadow of the buildings cast on each other and the area where the tree shadow mixed with building shadow which creates a problem to identify the exact shadow region of that particular building which is consider as a drawback of this method.
7. REFERENCES
7.1 References from Journals
Alhaddad B. I., Roca J., Burns M. C., Garcia J., 2008 “Satellite Imagery and LIDAR data for efficiently describing Structures and Densities in Residential Urban Land Uses Classification” The International Archives of the Photogrammetry, Remote Sensing and Spatial Information Sciences. Vol. XXXVII. Part B8. Beijing 2008.
Benarchid O., Raissouni N., Adib S. El, Abbous A., Azyat A., Ben Achhab N., Lahraoua M., and Chahboun A.. "Building Extraction using Object-Based Classification and Shadow Information in Very High Resolution Multispectral Images, a Case Study: Tetuan, Morocco " Canadian Journal on Image Processing and Computer Vision Vol. 4 No. 1, January 2013.
Comber Alexis , Umezaki Masahiro , Zhou Rena , Ding Yongming , Li Yang , Fu Hua, Jiang Hongwei & Tewkesbury Andrew (2012) "Using Shadows in High Resolution Imagery to
determine Building Height", Remote Sensing Letters, 3:7, 551-556.DOI: 10.1080/01431161.2011.635161.
Hartl Ph. & CHENG F. (2007), “Delimiting the Building Heights in a City from the Shadow on a Panchromatic SPOT-Image”, International Journal of Remote Sensing, pages 2829 -2842. DOI: 10.1080/01431169508954594
Lee Taeyoon & Kim Taejung(2013) “Automatic Building Height Extraction by Volumetric Shadow Analysis of Monoscopic Imagery”, International Journal of Remote
Sensing, 34:16, 5834-5850. Link:
http://dx.doi.org/10.1080/01431161.2013.796434.
Shettigara, V.K., Sumerling, G.M., 1998, “Height determination of extended objects using shadows in SPOT images”, Photogrammetric Engineering and Remote Sensing 64 (1), pp. 35-44, 1998.
7.3 References from Other Literature:
Comber, Masahiro Umezaki, Rena Zhou, Yongming Ding Bao-ming Zhang, Hai-tao Guo, Jun Lu, Zhi-qing Liu, Hong He, 2011, “The Study on Height Information Extraction of Cultural Features in Remote Sensing Images Based on Shadow Areas”, International Archives of the Photogrammetry, Remote Sensing and Spatial Information Sciences, Volume XXXVIII-5/W16, ISPRS Trento 2011 Workshop, 2-4 March 2011, Trento, Italy.
Lee Taeyoon & Kim Taejung “Generation of 3D Building Models from Commercial Image database through Shadow Analysis”, ASPRS 2010 annual conference. Link: http://www.asprs.org/a/publications/proceedings/sandiego2010/ sandiego10/Lee_T.pdf
Santosa T., Freirea S., Navarrob A., Soaresb F., Dinisb J., Afonsoc N., Fonsecac A., Tenedórioa J.A., 2010 “extracting buildings in the city of lisbon using quickbird images and lidar data”, The International Archives of the Photogrammetry, Remote Sensing and Spatial Information Sciences, Vol. XXXVIII-4/C7.
Seok Won, Yoon Seo Chang Geol, Jang Jae Seok, Oh Ho Seon and Jung Ki Soon, (2008) “Development of 3D Model Reconstruction and Terrain Registration Technology Using Satelliate Images”, A Previous Project of Virtual Reality Laboratory, Jan 2007 - Dec 2008.
Singh Durgesh, Maurya Rohit, Shukla Ajay Shankar, Sharma Manish Kumar and Gupta P.R, 2012 “Building Extraction from Very High Resolution Multispectral Images using NDVI based Segmentation and Morphological Operators”, 978 -1-4673-0455-9/12/$31.00 ©2012 IEEE.
Song Huihui, Huang Bo, and Zhang Kaihua, 2013 “Shadow Detection and Reconstruction in High-Resolution Satellite Images via Morphological Filtering and Example-Based Learning”, IEEE Transactions on Geoscience and Remote Sensing.
Ziaei Zahra, Pradhan Biswajeet and Mansor Shattri Bin “A rule-based parameter aided with object-based classification Online link: http://dx.doi.org/10.1080/10106049.2013.819039 7.4 References from Websites
http://apollomapping.com/imagery/high-resolution-imageryQUICKBIRD.
Website: http://en.wikipedia.org/wiki/Dehradun accessed on November 7, 2014.
Website: http://en.wikipedia.org/wiki/Shadow accessed on November 7, 2014.
8. ACKNOWLEDGEMENTS
Authors are thankful to Director, IIRS for providing the infrastructure facility and support to carry out the research work at IIRS.