INDIVIDUAL TREE OF URBAN FOREST EXTRACTION FROM VERY HIGH DENSITY
LIDAR DATA
A. Moradi a, M. Satari a,b *, M. Momeni a,b
a
Dept. of Geomatic Engineering, University of Isfahan, Hezarjarib Street, Isfahan, Iran - (a. moradi.rs, satari, momeni)@eng.ui.ac.ir b
Institute of Remote Sensing, University of Isfahan, Hezarjarib Street, Isfahan, Iran
Commission III, WG III/2
KEY WORDS: Tree Extraction, LiDAR, Point Cloud, OPTICs Clustering, Principal Components Analysis
ABSTRACT:
Airborne LiDAR (Light Detection and Ranging) data have a high potential to provide 3D information from trees. Most proposed methods to extract individual trees detect points of tree top or bottom firstly and then using them as starting points in a segmentation algorithm. Hence, in these methods, the number and the locations of detected peak points heavily effect on the process of detecting individual trees. In this study, a new method is presented to extract individual tree segments using LiDAR points with 10cm point density. In this method, a two-step strategy is performed for the extraction of individual tree LiDAR points: finding deterministic segments of individual trees points and allocation of other LiDAR points based on these segments. This research is performed on two study areas in Zeebrugge, Bruges, Belgium (51.33° N, 3.20° E). The accuracy assessment of this method showed that it could correctly classified 74.51% of trees with 21.57% and 3.92% under- and over-segmentation errors respectively.
* Corresponding author
1. INTRODUCTION
Tree extraction from remotely sensed data, in addition to applications in mapping and three-dimensional modelling, is worthwhile from the aspect of environmental term and urban green space management. So far, many studies on the tree extraction have been done using aerial and satellite images (Kalapala, 2014; Immitzer et al., 2012; Larsen, 2007). With the increase in the spatial and spectral sensor resolutions, computation powerand reducing in the cost of data gathering, the level of detail for automatic individual trees extraction has been increased. However, the vertical structure of trees, tangled crowns and automatic detection in the level of details of remote sensing data, are tree extraction challenges that researchers are faced with them. Nevertheless, aerial image interpretation is impeded by different spectroradiometric distortions caused by vignetting effects (caused by more light reaching the centre of an image than the edges), atmospheric variations, sun-target-sensor geometry or view/illumination geometry and topography-induced illumination variations (Lillesand et al. 2008). Airborne LiDAR can penetrate in tree crown, provide the geometric
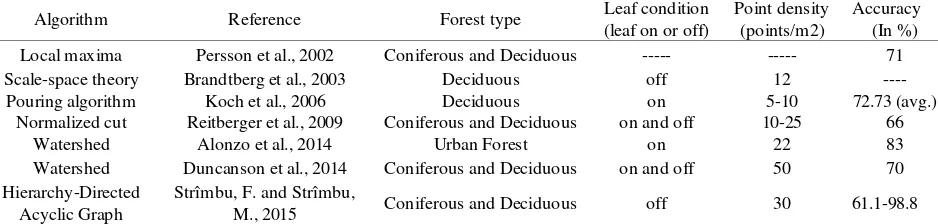
information and show some internal structure of the trees, and also these capabilities may increase by increasing in point density. With the high ability of airborne LiDAR to provide three-dimensional information directly and to receive multiple return signals from vegetation, it has become a viable alternative to image. The singletree detection using airborne LiDAR data was primarily proposed by Brandtberg (1999), Hyyppä and Inkinen (1999) and Samberg and Hyyppä, (1999), which subsequently became an accepted topic for investigators (Hyyppä et al. 2008). Most published algorithms detect individual trees from an interpolated raster surface from LiDAR points that hit on the tree canopy surface (Zhang et al., 2015). Table 1 shows some of these methods. For example, in the developed algorithm by Koch et al., a Digital Crown Height Model (DCHM) is first calculated by subtracting the height value of the Digital Terrain Model (DTM) at each pixel from the height value of the Digital Surface Model (DSM). In the smoothed DCHM, tree tops are then detected with a local maximum filter. The Pouring algorithm is then used to obtain crowns (Koch et al., 2006).
Algorithm Reference Forest type Leaf condition
(leaf on or off)
Point density (points/m2)
Accuracy (In %) Local maxima Persson et al., 2002 Coniferous and Deciduous --- --- 71
Scale-space theory Brandtberg et al., 2003 Deciduous off 12 ----
Pouring algorithm Koch et al., 2006 Deciduous on 5-10 72.73 (avg.)
Normalized cut Reitberger et al., 2009 Coniferous and Deciduous on and off 10-25 66
Watershed Alonzo et al., 2014 Urban Forest on 22 83
Watershed Duncanson et al., 2014 Coniferous and Deciduous on and off 50 70 Hierarchy-Directed
Acyclic Graph
Strîmbu, F. and Strîmbu,
M., 2015 Coniferous and Deciduous off 30 61.1-98.8
Table 1. Different individual tree detection methods based on LiDAR-derived raster surface
The CHM can have inherent errors and uncertainties from a number of sources. For example, spatial error can be introduced during the interpolation process from the point cloud to the gridded height model (Guo et al., 2010), which can decrease the accuracy of tree segmentations and relevant measurements (Li et al., 2012). To increase the accuracy of detection, Persson et al. applied a Gaussian function to elevation model (Persson et al. 2002), but the use of smoothing filter cause to estimate the tree height incorrectly (Tiede et al., 2005). As the amount of softening increases, the possibility of losing trees top increases. This can cause the indiscrimination of small trees (under-segmentation error) and vice versa (e.g. the very low softening level can cause to create additional tops and over-segmentation error). In the study of Kumar, the impact of the degree of softening on the number of detected peaks is clearly visible on table 2. Hence, in these algorithms, the number and the locations of detected peaks heavily effect on the process of detecting individual trees (Kumar, 2012).
Smoothed CHM Tree Peaks Detected
sCHM3 164,787
sCHM5 92,867
sCHM7 72,609
sCHM9 54,194
Table 2. Number of detected peaks in smooth CHM with varying degree of smoothness
As small trees are dominated by larger trees in dense forests, it is impossible to find them by pixel analysis (Reitberger et al., 2009). In the study of Duncanson et al. intermediate trees are over predicted (commission error) and understory trees are often undetected (omission error) (Duncanson et al., 2014). To overcome this problem, Alonzo et al., tried to control the distance between the detected peaks by applying one or more thresholds (Alonzo et al., 2014). But one or more thresholds may not enough to identify a variety of trees (variety of species, age, environmental conditions and growth rate) and so trees don’t be correctly identified. Unlike the above methods, some methods use LiDAR-point clouds directly to extract individual
trees points. Table 3 shows some of these methods. It’s hard to
define top points of deciduous or young trees under the other tree canopy in the point cloud (Wang et al., 2008). According to the three-dimensional coordinates of LiDAR points, Li et al.
used a distance threshold to tree segmentation. But it’s hard to
define this threshold, especially in dense forests. Inappropriate threshold may cause to under- and/or over-segmentation errors (Li et al., 2012). Another problem is that pointsmust participate in the segmentation and classification processes one by one, that in itself rises the computation time. Lu et al. offered a method to detect tree trunks points based on higher levels of intensity. In their method, the tree segmentation begins from bottom of the trees. Consequently, their method will be influenced by bushes in some areas (Lu et al., 2014).
All above mentioned methods search seed points as tree top or bottom to start segmentation algorithm. Hence, the number and the locations of the selected seed points effect on the detection process directly. In our study, a new method to extract individual trees points from LiDAR data with no need to extract seed points is developed. The main idea of this method consists in extracting deterministic segments of individual tree points and investigating membership of other points to them.
2. GENERAL SCHEMA
As mentioned above, a two-step strategy is performed for the extraction of individual tree LiDAR points. These steps are (1) finding the Deterministic Segments of Individual Trees points (DSITs), and (2) the allocation of other LiDAR points based on these DSITs. Figure 1 indicates a presentation of the different phases of this proposed approach. In continue of this paper, details of this method are explained.
Figure 1. The flowchart of proposed algorithm
2.1 DataPre-processing
Pre-processing of LiDAR data in this study consisted two phases: (1) Because of using urban forest point cloud for tree segmentation, we first separated urban forest point clouds class from other urban objects class (such as roads and buildings) using a city plan. (2) The surface of the ground is not flat and our algorithm is based on the relative spacing of each point, therefore we first need to eliminate the effect of land. For this purpose, a digital elevation model (DEM) was first generated by interpolating the ground points using ordinary kriging (Guo et al., 2010). The LiDAR point cloud was then normalized by subtracting the DEM height from the LiDAR point cloud (Lee et al., 2010). According to the generalshape of trees, a cylindrical shape is considered as a DSIT (Figure 2). These cylinders are
Algorithm Reference Forest type Leaf condition (Leaf on or off)
Point density (points/m2)
Accuracy (In %)
Voxel space projection Wang et al., 2008 Coniferous and
Deciduous ---- 7-8 72.12
Adaptive multi-scale
filter Lee et al., 2010 Managed pine forest On 14.2 95
Region growing Li et al., 2012 Coniferous On > 6 90
2D and 3D spacing
thresholds Lu et al., 2014 Deciduous Off 10.28 90
donut expanding and
sliding method Zhang et al., 2015 Urban Forest On 3.5 93.5
Table 3. Different individual tree detection methods based on LiDAR-point cloud
Figure 2. The schematic concept of a DSIT for two trees
2.2 Obtaining Cylinders’ Direction
Tree growth of each tree is in line with its tree trunk. Hence, the central axis of the cylinder should be defined along the tree trunk. The steps of extracting tree trunk in this paper are implied as following steps: firstly, the bushes and the ground points are removed from the point cloud by applying a maximum and minimum height thresholds which are defined experimentally (Figure 3a) based on the study area. In this research, these thresholds were equal to 1.4 m and 4.5 m. Then, in order to classify the resulted point cloud to trunk and non-trunk classes, third thresholding is performed on intensity of each point (Figure 3b). This experimental threshold is obtained from this fact that the number of echoes of a pulse related to the tree trunks and its branches are usually less than the number of echoes related to the leaves. Hence, the intensity of the trunk and branches are higher thanthe intensity of the leaves (Lu et al. 2014). With this thresholding, the leaves points are removed from the tree trunk classas far as possible
.
In this research, the intensity threshold was equal to 25.Figure 3. Initial classifications for trunk class extraction
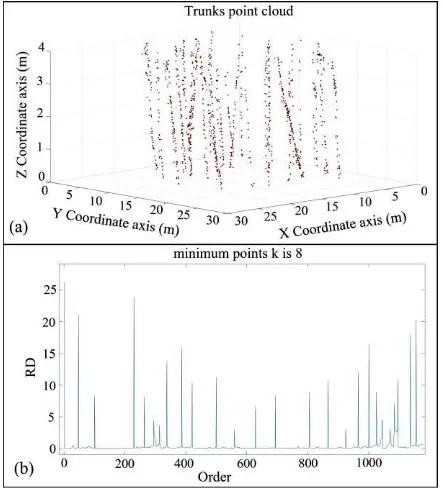
Secondly, in resulted trunks class, Ordering Points To Identify the Clustering Structure (OPTICs) algorithm (Ankerst et al., 1999) is applied to obtain individual tree trunk point clusters. OPTICs algorithm is a clustering method based on density data; this means that wherever the data density is high, there may be a pattern. The input parameters of this algorithm are minimum points and the neighbourhood radius parameters, which are indicated with K and ε respectively. A point is considered as a core point, if there are at least K points in the ε radius for it. Connected core points represent a pattern and the representative of this pattern is a core point that point density around it, is more than the rest.
The output of the OPTICs algorithm is a curve that represents this structure in two-dimensions. In this curve vertical axis, RD, is each point's reachability distance and horizontal axis, order, is the order of points in the reachability graph. Every valley in this curve represents a cluster. We used a Matlab code of OPTICs algorithm that set the value of ε, automatically (Daszykowski et al. 2002). In this study, an appropriate value for K is considered by examining the half of trunk class at plot 1 (Figure 4a). The number 8 was obtained for Kby trial and error method
.
The resultedplot of OPTICs algorithm has been shown in Figure 4b.Figure 4. Trunks point cloud of half of trees of Plot 1 and (b) output of OPTICs algorithm that was carried out on this point
cloud.
By putting any point into cluster of its nearest representative, tree trunk point's clusters are obtained (Figure 5a). The obtained Trunk Clusters are accompanying with some bushes points and should be eliminated to extract final individual tree trunks. This elimination is done by a thresholding operation on their Euclidean distance from mean of each cluster. The final trunks point's clusters are obtained after this operation (Figure 5b). In the last step of obtaining cylinders’ direction, by extracting the trunk of single trees, their directions are extracted using principal component analysis (PCA). Figure 5c shows extracted trunk direction of two neighbouring trees.
Figure 5. (a) The results of clustering with OPTICs algorithm, (b) the final trunks and (c) trunk direction of two neighbouring trees
2.3 Obtaining Cylinders’ Radii
According to the trees growth, as the diameter of a tree trunk is larger, its crown is more expanded. Crowns are tangled with each other in dense areas. Therefore, the radii of the cylinders are defined as a function of two parameters: distance and diameter. If the tree diameter is large or tree is farther from its neighbour trees, the radius of its cylinder should be defined large. As mentioned above, we express the steps of our method for two neighbouring tree. Cylinder radius of the tree 1 and 2 (r1 and r2 respectively), are defined by the following equations:
If trunk directions of two neighbour trees are approximately parallel to each other (Figure 6a), their radiuses are determined based on equations 1:
and (1)
Where = distances between centres of tree trunks , = trunk diameter for tree 1 and 2 respectively.
If two neighbour trees are getting away from each other (Figure 6b), their radiuses are determined based on equations 2:
and (2)
Where , = trunks direction angles for target and neighbour trees, respectively
= is determined based on equations 3
( ) and (3)
Where = perpendicular distance of i-th tree trunk top point from intersection line of perpendicular planes on tree trunk centre line.
Figure 6. Visual expression of equations parameters: (a) trees are parallel, (b) trees are getting away from each other and (c and d)
trees are approaching to each other.
If two neighbour trees are approaching to each other and trees trunk centre lines are intersecting (Figure 6c), same equation with previous case is applied, but we limit the cylindrical zones with a break plane. This plane creates and angles with plane perpendicular to the central line of the target and neighbour tree respectively.Thus, this plane allows changing cylinder radius along with height changes. This radius change helps cylinders to keep the concept of DSITs. Finally, as shown in the figure 6d, if two neighbour trees are approaching to each other and trees trunk centre lines are skew, then we define
the
truncated cones instead of cylinders. In this case we define radii of these truncated cones as equations 4:, ,
and
(4)
Where = nearest and the farthest neighbour tree trunk respectively,
, = radius of the truncated cones for target tree,
, = radius of the truncated cones for neighbour tree.
By having DSITs for each pair of neighbouring trees:
2.4 DSITs Inner Points Extraction
In continue of our proposed algorithm, for each neighbouring trees pair, other tree points out of defined DSITs are extracted. The steps of this section are developed as follows:
1. Firstly, tree trunk centre of gravity of each cluster is obtained and a Triangulated Irregular Network (TIN) model is constructed on them. This TIN model is used to determine trees topology and extract neighbour trees. In addition to trees topology, TIN model is applied to restrict the number of points which are under classification process.
2. A trunk of a single tree is selected as the target tree, randomly, and its neighbours are sorted from nearest to the farthest distance. Then, the target tree and its nearest neighbour are selected as a trees pair and their DSITs are defined. The points between the trees pair that are inside of DSIT target/neighbour tree , may be related to the target/neighbour tree and indicated as initial target/ neighbour points (neighbour points) (Figure 7).
Figure 7. The DSITs definition for couple tree
3. Perpendicular distance between each point outside of the DSITs pair and each DSIT's boundary are obtained firstly. Then, these points are allocated to their DSIT, based on their minimum distances (Figure 8). The points allocated to the target/neighbour tree indicated as initial target/neighbour points.
Figure 8. Allocation of points outside of the Deterministic Segment of Individual Trees (DSITs) to their trees.
4. Neighbour points must be removed from point cloud for the target tree and be added to the point cloud for the next target tree. Initial target points must be involved in the process of segmentation for the next neighbour tree.
5. The steps 2, 3 and 4 are repeated for the target tree until the last of its neighbour tree.
6. The latest initial target points are the final target points and must be extracted as that target tree points.
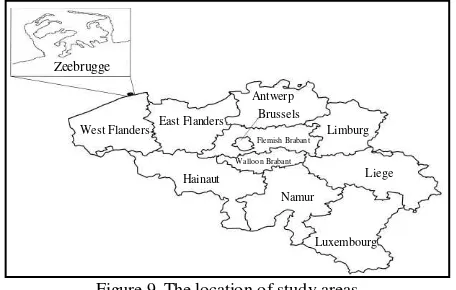
7. The steps 2 to 6 are run until the last target tree. approximately 65points/m², which is related to point spacing of approximately 10cm. The study sites are plot 1 and 2 with an area of 4900 m2 and 3300 m2 respectively. The trees of both plots are deciduous.
Figure 9. The location of study areas
In order to validate of our proposed method, we compared the classification result with manual extracted trees from aerial ortho-images (Figure 10). For this purpose, the ortho-images are
West Flanders East Flanders
Plot No. of trees Correct-Classification Under-Segmentation Over-Segmentation
In % In % In %
1 57 42 73.68 13 22.81 2 3.51
2 45 34 75.56 9 20.00 2 4.44
Total 102 76 74.51 22 21.57 4 3.92
Table 4. Segmentation results compared to aerial image
superimposed on the LiDAR point cloud. Then, the points of each tree are extracted by an expert operator. This comparison shows that our algorithm, correctly classify 74.51% of trees with 21.57% and 3.92% under and over segmentation errors respectively (Table 4).
Figure 10. Aerial image of the study areas (Plot 1 and Plot 2)
A general view of part of the results is presented in Fig. 11.
Figure 11. Final segmentation results related to trees from half of plot 1.
4. CONCLUSIONS AND FUTURE WORK
In this study, we proposed a new method to extract individual trees points from LiDAR point data. The basis of this method is to define cylindrical areas for each tree and to allocate points to each tree based on these areas. This process allowed us to determine the class of large number of points and to use a process to segment less number of points in non-deterministic segments at the same time. The results of the evaluation show that the proposed method has good potential to extract individual trees points
Future work could be focused on improving this algorithm in mixed forests. Tree crowns have a very complex structure, and changefrom one species to anotherand from one place to another largely
.
In individual tree extraction operations, there are some points in non-deterministic areas between trees that membership verification process of them is complex especiallyin very high density LiDAR data of semi-intensive urban forests. Prior knowledge of trees in the study area, helps to choose a better shape for DSITs and then to calculate DSITs parameters. In our scheme, the deterministic and non-deterministic area around each tree is separated by cylindrical zones. Other geometric volumes can be used. The tuning processes in the proposed methodology is partly dependent on the type and height of the trees in the study area. For example, 1.4 m and
4 m threshold values for maximum and minimum height
thresholding to extract initial tree trunks. Obviously these thresholds are area specific and needs re-tuning for trees in different environments. Nevertheless, much research work still needs to be conducted with a view to achieving complete elimination of the tuning stage from the entire individual tree extraction process.
The used LiDAR data only had intensity and three-dimensional coordinates of the points. Full-waveform analysis of LiDAR data can reach better results.
5. ACKNOWLEDGEMENTS
The authors would like to thank the Belgian Royal Military Academy for acquiring and providing the data used in this study, and the IEEE GRSS Image Analysis and Data Fusion Technical Committee.
REFERENCES
Alonzo, M., Bookhagen, B., Roberts, D.A., 2014. Urban tree species mapping using hyperspectral and lidar data fusion. Remote Sensing of Environment 148, 70-83.
Ankerst, M., Breunig, M.M., Kriegel, H.-P., Sander, J., 1999. OPTICS: ordering points to identify the clustering structure, ACM Sigmod Record. ACM, pp. 49-60.
Brandtberg, T., Warner, T.A., Landenberger, R.E., McGraw, J.B., 2003. Detection and analysis of individual leaf-off tree crowns in small footprint, high sampling density lidar data from the eastern deciduous forest in North America. Remote sensing of Environment 85, 290-303.
Daszykowski, M., Walczak, B. and Massart, D.L., 2002. Looking for natural patterns in analytical data. 2. Tracing local density with OPTICS. Journal of chemical information and computer sciences, 42(3), pp.500-507.
Duncanson, L., Cook, B., Hurtt, G., Dubayah, R., 2014. An efficient, multi-layered crown delineation algorithm for mapping individual tree structure across multiple ecosystems. Remote Sensing of Environment 154, 378-386.
Guo, Q., W. Li, H. Yu, and O. Alvarez, 2010. Effects of topographic variability and lidar sampling density on several DEM interpolation methods, Photogrammetric Engineering & Remote Sensing, 76(6):701–712.
Gupta, S., 2010. Single tree detection and modeling using airborne laser scanner data. Faculty of Forest and Environmental Sciences, Albert-Ludwigs-Universität Freiburg.
Hyyppä, J., Hyyppä, H., Leckie, D., Gougeon, F., Yu, X., Maltamo, M., 2008. Review of methods of small‐footprint airborne laser scanning for extracting forest inventory data in boreal forests. International Journal of Remote Sensing 29, 1339-1366.
Immitzer, M., Atzberger, C., Koukal, T., 2012. Tree species classification with random forest using very high spatial resolution 8-band WorldView-2 satellite data. Remote Sensing 4, 2661-2693.
Kalapala, M., 2014. Estimation of Tree Count from Satellite Imagery through Mathematical Morphology. International Journal 4.
Koch, B., Heyder, U., Weinacker, H., 2006. Detection of individual tree crowns in airborne lidar data. Photogrammetric Engineering & Remote Sensing 72, 357-363.
Kumar, V., 2012. Forest inventory parameters and carbon mapping from airborne LIDAR. MSc Thesis University of Twente Faculty of Geo-Information and Earth Observation (ITC), Enschede.
Larsen, M., 2007. Single tree species classification with a hypothetical multi-spectral satellite. Remote Sensing of Environment 110, 523-532.
Lee, H., Slatton, K.C., Roth, B., Cropper Jr, W., 2010. Adaptive clustering of airborne LiDAR data to segment individual tree crowns in managed pine forests. International Journal of Remote Sensing 31, 117-139.
Li, W., Guo, Q., Jakubowski, M.K., Kelly, M., 2012. A new method for segmenting individual trees from the lidar point cloud. Photogrammetric Engineering & Remote Sensing 78, 75-84.
Lillesand, T.M., Kiefer, R.W. and Chipman, J.W., 2008, Remote sensing and image interpretation. 6th ed., Wiley & Sons, 804 p.
Lu, X., Guo, Q., Li, W., Flanagan, J., 2014. A bottom-up approach to segment individual deciduous trees using leaf-off lidar point cloud data. ISPRS Journal of Photogrammetry and Remote Sensing 94, 1-12.
Persson, A., Holmgren, J., Söderman, U., 2002. Detecting and measuring individual trees using an airborne laser scanner. Photogrammetric Engineering and Remote Sensing 68, 925-932.
Rahman, M., Gorte, B., 2009. Tree crown delineation from high resolution airborne lidar based on densities of high points, Proceedings ISPRS Workshop Laserscanning 2009, September 1-2, France, IAPRS, XXXVIII (3/W8), 2009. ISPRS.
Reitberger, J., Schnörr, C., Krzystek, P., Stilla, U., 2009. 3D segmentation of single trees exploiting full waveform LIDAR data. ISPRS Journal of Photogrammetry and Remote Sensing 64, 561-574.
Solberg, S., Naesset, E., Bollandsas, O.M., 2006. Single tree segmentation using airborne laser scanner data in a structurally heterogeneous spruce forest. Photogrammetric Engineering & Remote Sensing 72, 1369-1378.
Strîmbu, V.F., Strîmbu, B.M., 2015. A graph-based segmentation algorithm for tree crown extraction using airborne LiDAR data. ISPRS Journal of Photogrammetry and Remote Sensing 104, 30-43.
Tiede, D., Hochleitner, G., Blaschke, T., 2005. A full GIS-based workflow for tree identification and tree crown delineation using laser scanning, ISPRS Workshop CMRT, p. 2005.
Wang, Y., Weinacker, H., Koch, B., Sterenczak, K., 2008. Lidar point cloud based fully automatic 3D single tree modelling in forest and evaluations of the procedure. International Archives of Photogrammetry, Remote Sensing and Spatial Information Sciences 37, 45-51.
Zhang, C., Zhou, Y., Qiu, F., 2015. Individual Tree Segmentation from LiDAR Point Clouds for Urban Forest Inventory. Remote Sensing 7, 7892-7913.