INTEGRATION OF IMAGE-DERIVED AND POS-DERIVED FEATURES FOR
IMAGE BLUR DETECTION
Tee-Ann Teo a*, Kai-Zhi Zhanb
a
Dept. of Civil Engineering, National Chiao Tung University, Hsinchu, Taiwan 30010 - [email protected] b
Dept. of Civil Engineering, National Chiao Tung University, Hsinchu, Taiwan 30010 - [email protected]
Commission I, ICWG I/Vb
KEY WORDS: Position and Orientation System (POS), Unmanned Aerial Vehicle (UAV), blur image detection, degree of motion
blur
ABSTRACT:
The image quality plays an important role for Unmanned Aerial Vehicle (UAV)’s applications. The small fixed wings UAV is suffering from the image blur due to the crosswind and the turbulence. Position and Orientation System (POS), which provides the position and orientation information, is installed onto an UAV to enable acquisition of UAV trajectory. It can be used to calculate the positional and angular velocities when the camera shutter is open. This study proposes a POS-assisted method to detect the blur image. The major steps include feature extraction, blur image detection and verification. In feature extraction, this study extracts different features from images and POS. The image-derived features include mean and standard deviation of image gradient. For POS-derived features, we modify the traditional degree-of-linear-blur (blinear) method to degree-of-motion-blur (bmotion) based on the collinear condition equations and POS parameters. Besides, POS parameters such as positional and angular velocities are also adopted as POS-derived features. In blur detection, this study uses Support Vector Machines (SVM) classifier and extracted features (i.e. image information, POS data, blinear and bmotion) to separate blur and sharp UAV images. The experiment utilizes SenseFly eBee UAV system. The number of image is 129. In blur image detection, we use the proposed degree-of-motion-blur and other image features to classify the blur image and sharp images. The classification result shows that the overall accuracy using image features is only 56%. The integration of image-derived and POS-derived features have improved the overall accuracy from 56% to 76% in blur detection. Besides, this study indicates that the performance of the proposed degree-of-motion-blur is better than the traditional degree-of-linear-blur.
1. INTRODUCTION
Unmanned Aerial Vehicle, UAV (also known as Unmanned Aircraft System, UAS), is an advance Remote Sensing (RS) technology, which usually is equipped with small sensors to obtain ground data without a pilot onboard. UAV has many advantages including high spatial resolution, auto pilot, lightweight, flexible for small area data acquisition and remote control. In recent years, UAV has been drawing more and more public attention. The International Society for Photogrammetry and Remote Sensing (ISPRS) has organized three conferences on UAV, namely Unmanned Aerial Vehicle in Geomatics (UAV-g), in 2011, 2013 and 2015, respectively. Besides, Google has unveiled a concept for delivery parcel UAV in 2014. Also, Amazon has obtained The Federal Aviation Administration (FAA) certificate to verify UAV delivery in 2015. More and more applications are emerged and associated with the developments of UAV technology.
In general, a UAV consists of three major parts: an unmanned aircraft, a control system and control links (Eisenbeiss, 2011). The unmanned aircraft can be further separated into three components: a platform, a Position and Orientation System (POS) and a payload sensor. The platform of unmanned aircraft can be fixed wings or rotor. The small fixed wings UAV is suffering from the image blur due to the crosswind and the turbulence. The blurred images degrade the production quality. Traditionally, small framed size UAV acquires a large number of images. So, to remove the blurred image manually is a labour intensive work. The automation of blur image detection and
image restoration may improve the processing time and the quality of UAV-derived geospatial data.
Image quality is one of the most concern topic for the UAV product and automation. There are four major factors which will influence the UAV image quality: image ground resolution, Signal to Noise Ratio (SNR), image blur and image compression. Image blur is caused by many factors such as motion, defocusing, and depth of field. Sources of image blur include vibration, focal length and relative motion (Vidhu, 2012). The blurred image may influence the product's precision, such as orthophoto and digital surface model.
Koik and Ibrahim (2013) classified the image blur detection methods into seven categories: (1) edge sharpness analysis, (2) depth of field, (3) blind de-convolution, (4) Bayes discriminant function, (5) non-reference block, (6) lowest directional frequency energy and (7) wavelet-based histogram. Additionally, sensor-assisted blur detection (Jiang et al., 2014) is another way to detect blurred images.
POS information to detect blurred images, it estimates image PSF more precisely.
Although the influence of motion-blurred images for UAV photogrammetric purposes has been widely studied in literatures (Sieberth et al. 2014), the integration of sensor and image information for blur detection remains lack of discussion. Conventionally, the POS sensors are mostly used in direct georeferencing but are seldom adopted to quantify the image quality. There is great potential of using POS sensors to identify the image quality in UAV applications.
The objective of this research is to detect the blur image by POS-derived and image-derived information. The proposed method combines several features to separate blurred and non-blurred images. We also quantify the image blur using line spread function (LSF) (Yang et al., 2015) from image linear feature. POS-derived features include degree-of-linear-blur and degree-of-motion-blur; image-derived features include mean and standard deviation of image gradient. Both features are integrated to isolate blurred and non-blurred images.
2. METHODOLOGIES
The proposed method includes three major parts: (1) feature extraction, (2) blur detection, and (3) validation. The explanations of each step are stated below.
2.1 Feature Extraction
The POS, providing the position and orientation, was installed onto the UAV to enable acquisition of UAV trajectory and calculation of the positional and angular velocities when camera shutter was open. Beside, image blur was linked to other camera parameters, for example, shutter speed and focal length, which however were constants in our research and were not appropriate to be features for classification. Additionally, we considered the image contents of blur and sharp images differently. All the calculated features are listed in Table 1.
Table 1. Features for blur detection
Type Feature Symbol
Degree of linear motion blur ������� Degree of motion blur �������
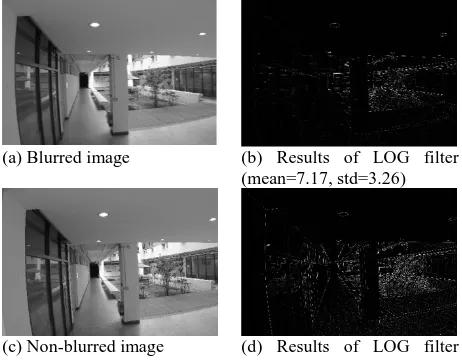
The image-derived features were calculated by the image itself. The mean and standard deviation of image gradient varied according to image content. For blurred images, the mean and standard deviation of image gradient would be low (Ko and Kim, 2009). In this study, we calculated the mean and standard deviation of image gradient based on Laplacian of Gaussian (LOG) filter. Figure 1 compares the image-derived feature between blurred and non-blurred images. The means and standard deviation of blurred image were relatively lower than the non-blurred image.
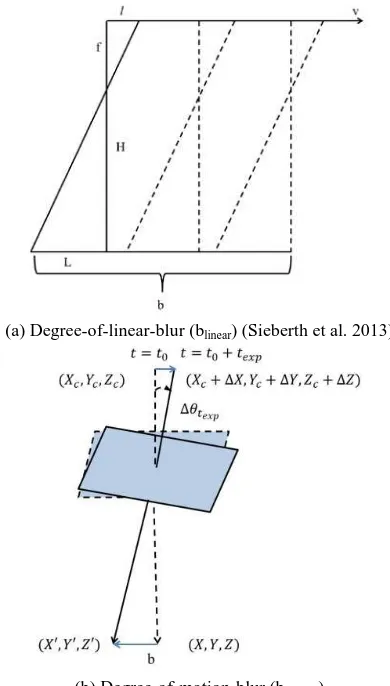
The linear velocity was estimated from camera positions while the angular velocity was estimated from camera attitudes. The degree-of-linear-blur (Sieberth et al. 2013) implies the
relationship of camera orientations and the image displacement on the ground (Equations 1 to 3). The idea of degree-of-linear-blur is shown in Figure 2a.
(a) Blurred image (b) Results of LOG filter (mean=7.17, std=3.26)
(c) Non-blurred image (d) Results of LOG filter (mean=10.93, std=6.35) Figure 1. Example of image-derived features
�
Where, ������� represents the degree-of-linear-blur, f represents the focal length, H represents the flight altitude, ���� represents the camera exposure time, l represents the pixel size, L represents the ground sample distance (GSD), v represents the UAV velocity, m represents the forward movement during exposure.
bmotion=�/� (8)
Initially, when �=�0, camera position was obtained at (��,��,��) and the attitude was at (�,�,�) to calculate the plane coordinate on the ground (�,�) (i.e. Equation 4). When t = �0+����, the camera position and attitude became (��+
Δ�,��+Δ�,��+Δ� ) and (ω+∆ω,φ+∆φ,κ+∆κ) , respectively. So we could solve the plane coordinate (�′,�′)
(i.e. Equation 5) after the shutter was closed. The distance m before and after ���� was calculated from Equation 7. The degree-of-motion-blur bmotion (i.e. Equation 8) was calculated by distance m divided by ground sampling distance L. Notice that, we obtained the exposure time and shutter speed from EXIF image header.
(a) Degree-of-linear-blur (blinear) (Sieberth et al. 2013)
(b) Degree-of-motion-blur (bmotion)
Figure 2. Illustraion of linear-blur and degree-of-motion-blur
2.2 Blur Image Detection
After extracting the image information, we applied SVM classifier to sort out the blurred and sharp images. We utilized the image information as a classification feature. SVM classifier is a supervised learning model which constructs a high-dimensional hyperplane or a set of hyperplanes to separate data into different clusters (Platt, J., 1995). Moreover, SVM performs well at maximizing the distance to the nearest training-data point for any class. So SVM has larger margin and lower generalization error among the classifiers. In other words, SVM can classify the data set precisely because of its good estimation of the boundary of data clusters. We adopted different features to separate the blurred and sharp images.
2.3 Verification
The verification step checked the correctness of blur detection by the proposed features. Determination of an image being blur or sharp is difficult. Human judgment may be subjective and time consuming. Traditionally, Siemens star is a signalize target to assess the quality of the image. However, Siemens star must be present on the ground, and the size of the device varies depending on the mission claim. In our research, we did not deploy any Siemens star. Alternatively, we utilized the natural target to establish a blur index so as to determine the blurred images. The blur index was derived from ����, and utilized the natural target edges with high contrast of the grayscale, such as white road mark and asphalt. We manually selected well defined edge on the image and calculated ���� as blur index. If the ���� of an image was larger than a threshold, that image was treated as blurred image, otherwise, it would be a non-blurred image. We simulated several blurred images at different levels and calculated the blur indices. From the visual perspective, the blurred images were defined when the blur index was greater than 4.
3. EXPERIMENTAL RESULTS
3.1 Test Data
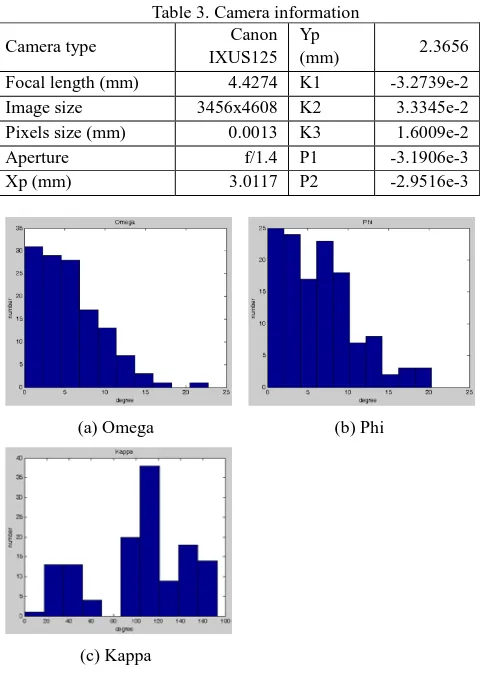
The test imagery was collected by SenseFly eBee. This UAV was equipped with a single frequency GPS and an IMU for positioning and navigation. The image data was obtained by Canon IXUS125. The flying height of the UAV was about 300 m. Tables 2 and 3 show the relevant information of the UAV and the camera. Figure 3 shows the example of blurred and non-blurred images in a mission. Because of the crosswind during data acquisition, the attitudes of the UAV changed dramatically and caused serious image blur. The rotation angles along X-axis and Y-axis ranged from 0 to 25 degrees (Figure 4).
Table 2. Related information of UAV
UAV type SenseFly eBee
Camera type Canon IXUS125
Image size 4608 x 3456 pixels
Test area Hsinchu
Date 2013/5/28
Flight height 300m
Number of images 129
Resolution 6cm
GPS type Single frequency
Table 3. Camera information
Camera type Canon
IXUS125 Yp
(mm) 2.3656
Focal length (mm) 4.4274 K1 -3.2739e-2
Image size 3456x4608 K2 3.3345e-2
Pixels size (mm) 0.0013 K3 1.6009e-2
Aperture f/1.4 P1 -3.1906e-3
Xp (mm) 3.0117 P2 -2.9516e-3
(a) Omega (b) Phi
(c) Kappa
Figure 4. Distribution of rotation angles
3.2 Comparison of linear-blur and degree-of-motion-blur
Sieberth et al. (2013) proposed the blur in pixel (i.e., blinear) to describe the degree of blur. The blinear covered the linear motion blur of a UAV. However, the motion blur of a UAV includes both linear motion blur and rotation blur. In our research, we considered both the linear motion and rotation blur of a UAV, and made a comparison of the results of blinear and bmotion as shown in Table 4. Figure 5 compares blinear and bmotion in three images. The tested images revealed that the displacement from bmotion was larger than blinear when the attitudes was applied.
Table 4. Statistic of blinear and bmotion
blinear (pixels) bmotion (pixels)
Mean 0.349 Mean 0.672
Maximum 0.941 Maximum 3.064
Minimum 0.078 Minimum 0.064
Standard deviation 0.156 Standard deviation 2.490
(a) blinear=0.142, bmotion=0.321 (IMG_892)
(b) blinear=0.438, bmotion=1.457 (IMG_876)
(c) blinear=0.713, bmotion=3.07 (IMG_934)
Figure 5. Comparison of blur index and degree-of-motion-blur
3.3 Analysis of Degree of Motion Blur from POS
We used SVM classifier in blurred image detection. Ten sharp images and 10 blurred images were manually selected as training data for SVM classification. The reference data for validation were also manually selected by ����. The numbers of blurred and non-blurred images were 34 and 75, respectively. The classification features were extracted from the image and POS data. We chose different features in classification and compared the degree of separation. The combinations were:
Case 1. Image-derived features: ������, �����
Case 2. Integration of image-derived features, ��,��,��,��
and blinear
Case 3. Integration of image-derived features, ��,��,��,��
and bmotion.
In Case 1, the overall accuracy was 56.8%. Besides, the correctness and completeness of blurred images were 88.8% and 88.2%, respectively. Experimental results indicated that the blurred image could not be extracted counting solely on image features. In Case 2, we combined image-derived features, blinear and other POS-derived features. The overall accuracy was 66.1%. Besides, the correctness and completeness of blurred images were 72.6% and 81.3%, respectively. In Case 3, we combined image-derived features, proposed bmotion and other POS-derived features. The overall accuracy was 76.1%. Besides, the correctness and completeness of blurred images were 76.9% and 93.9%, respectively.
Table 5. Comparison of different combinations Correctness(%) Completeness(%) OA
Case Blur Sharp Blur Sharp (%)
1 88.8 58.9 88.2 42.6 56.8
2 72.6 44.0 81.3 32.3 66.1
3 76.9 72.2 93.3 38.2 76.1
We analysed the misclassified images, and found that those misclassified could be attributed to two reasons: (1) The image was blurred, and bmotion was small and (2) The image was sharp, and bmotion was large. We used the camera information to estimate the camera position, orientation, positional and the angular velocities. Those cases might be caused by the quality of POS data.
4. CONCLUSIONS AND FUTURE WORKS
In this research, we have proposed a blur detection method for UAV image by the integration of image-derived and POS-derived features. The proposed POS-assisted method includes feature extraction, blur image detection and verification. We have also demonstrated and compared the degree-of-linear-blur and degree-of-motion-blur in blur detection. The POS-derived blur parameters were proved useful in blurred image detection. Moreover, the proposed degree-of-motion-blur considered more complete factors to estimate the motion blur.
The experiment indicated that the sensor-assisted blurred image detection could automatically detect the blurred and sharp images by SVM classifier. The degree-of-motion-blur from POS could be an ideal parameter to determine the image quality in image preprocessing. The overall accuracy in blurred image detection reached 76%.
In this research, we applied the SVM classifier to classify the sharp image and blurred image with an overall accuracy about 76%. We only considered the same camera information, UAV POS data and image information. In the future, we could take other features such as the blur index and camera information into account to improve the overall accuracy.
ACKNOWLEDGEMENTS
This research was partially supported by the Ministry of Science and Technology of Taiwan under project number MOST 104-2633-M-009-002.
REFERENCES
Eisenbeiss, H., 2011. Tutorial UAV-g Introduction. International Conference on Unmanned Aerial Vehicles in
Geomatics. Zurich, Switzerland. URL:
http://www.geometh.ethz.ch/uav_g/tutorial/eisenbeiss_web (last date accessed: 3 April 2016)
Jiang, W., Zhang, D., and Yu, H., 2014. Sensor-assisted image deblurring of consumer photos on smartphones, IEEE International Conference on Multimedia and Expo (ICME), pp. 1-6.
Joshi, N., Kang, S.B., Zitnick, C.L., and Szeliski, R., 2010. Image deblurring using inertial measurement sensors, ACM Transactions on Graphics (TOG), p. 30-37.
Ko, J., and Kim, C., 2009. Low cost blur image detection and estimation for mobile devices. Proceedings of Advanced Communication Technology (ICACT), 11th International
Conference on, Vol. 3, pp. 1605-1610.
Koik, B.T., and Ibrahim, H., 2013. Exploration of Current Trend on Blur Detection Method Utilized in Digital Image Processing. Journal of Industrial and Intelligent Information, 1(3): 143-147.
Platt, J., 1999. Fast training of support vector machines using sequential minimal optimization. Advances in kernel methods: support vector learning (Bernhard, S., Christopher, J.C.B., and Alexander, J.S.), MIT Press Cambridge, MA, pp. 41-65.
Sieberth, T., Wackrow, R. and Chandler, J.H., 2013. Automatic isolation of blurred images from UAV image sequences. International Archives of the Photogrammetry, Remote Sensing and Spatial Information Sciences, UAV-g 2013, 4–6 September 2013, Rostock, Germany, pp.361-366.
Sieberth, T., Wackrow, R., and Chandler, J., 2014. Motion blur disturbs–the influence of motion ‐ blurred images in photogrammetry. The Photogrammetric Record, 29(148): 434-453.
Vidhu, S. 2012. 7 causes of blurry photos, Shutterstoppers, URL: http://shutterstoppers.com/7-causes-of-blurry-photos/ (last date accessed: 3 April 2016)