AN INTEGRATED SPATIAL INDEXING
OF HUGE POINT IMAGE MODEL
Yanmin Wang a, Ming Guo a,*
a Key Laboratory for Urban Geomatics of National Administration of Surveying, Mapping and Geoinformation, Beijing
University of Civil Engineering and Architecture, Beijing 100044, China - wangyanmin@bucea.edu.cn;
guoming@bucea.edu.cn
Commission IV, WG IV/4
ABSTRACT:
In order to manage point image model easier and build the point cloud model on the basis of the need and improve the query efficiency, a 2D&3D integrated spatial index of large point image model is proposed in this paper. Point image is managed by 2D quad tree and 3D MBB. Point image modelconstituted by point image are indexed by 3D-R tree. Finally the organized hierarchical model and other attribute data are stored in commercial database. The storage, management and visualization of large point image model are verified on the ordinary PCs. The experiment data are derived from the representative ancient buildings in Forbidden City. Experimental results show that the algorithm is able to manage more than 10G-level data and one billion valid points with
satisfactory rendering efficiency.
KEY WORDS: Terrestrial LIDAR, Point Image, Spatial Index, LOD
* Corresponding author. E-mail:guoming@bucea.edu.cn. 1. INTRODUCTION
1.1 Point Image
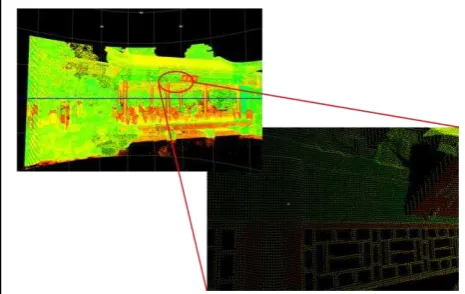
Terrestrial LIDAR has become one of the principal means of acquiring fine 3D graphics information in the near earth space. 3D laser scanner launches the laser and ranges by receiving the laser that had been launched for many times. The data are acquired by high resolution domed scanning. The points are recorded by 3D coordinates with intensity, which are stored by the way of 2D array logically.
Figure 1. The domed scanning data: point image
We define original scanned data with the array way as point image. The multi-view (multi-station) point images which are only registrated are called point image model. Point image model has the characteristics of large volumes (mass)、 arrangement with scanning line(grid)、raw data without any processing(originality) 、 single point in the same rays direction(uniqueness). Some terrestrial laser scanner equipped with a camera can acquire texture information of scanning target. There is no direction vector of points generally. However, the rich information acquired by laser scanner has not been used
effectively. It is used to convert the data to scattered point cloud and recalculate the geometric properties of scattered point cloud again. The topological relationships acquired by scanning directly among the 3D points are abandoned. Some scholars have noticed this characteristic of point image model and have made some meaningful work. In order to construct TIN model more effectively, a algorithm of spherical directed search and spherical Local Optimization Procedure(LOP) is presented, which not only improves the efficiency of network configuration, but also avoids triangulation error and hole caused by the data noise(Zhang Fan, Huang Xianfeng,2009);In order to optimize point image registration process, a spherical re-sampling method based on distance dependence is used to simplify point image data, which reduces the time cost of registration effectively (Mandow, A., Martínez, J.L,2010).
1.2 Research Significance
Point image can express true target shape as a whole. They are original data that must be saved permanently, and the post-processing work of point cloud data must depend on the point image model. However, the volume of data is very high and point image data may include millions of 3D points. It is obvious that point image model has lots of scanning stations. For example, inside and outside the Hall of Supreme Harmony in Forbidden City, the volume had been reached to hundreds of stations. And how to store, manage and visualize such a huge point image model has become a problem that must be solved at present. Commercial software have functions of edit, registration, 3D modelling and data conversion of point cloud data, etc. But they are mainly used to solve the problems from the traditional view of reverse engineering and can't render the whole of point cloud data at once.These software can only divide the data into sub-block to process, then choose the available data and abandon the others, which loses the originality and grid of point image data. It not only takes more time cost and effort but also can’t be used conveniently. Especially for the ancient buildings in Forbidden City, they International Archives of the Photogrammetry, Remote Sensing and Spatial Information Sciences, Volume XXXIX-B4, 2012
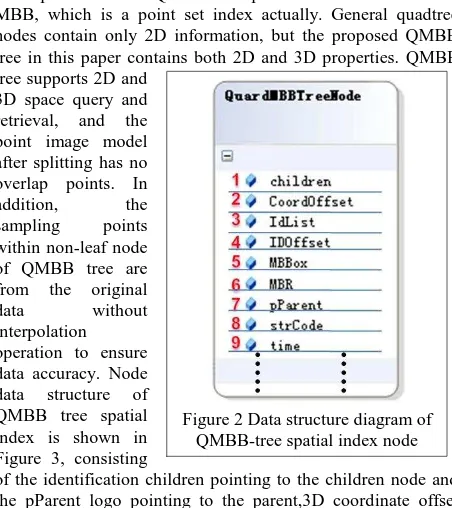
Figure 2 Data structure diagram of QMBB-tree spatial index node have features of components diversification、high query
requirements and so on. So it has greater difficulties in organizing、storing、and managing the spatial data.
In order to facilitate the scene rendering of overall point image model of buildings and improve the efficiency of processing and visualizing huge point image data, and ensure the safety of original data, this paper provides a new spatial index mechanism of huge point image model, which lays the foundation for post-processing and management of huge point cloud data.
1.3 Present Status of Research on 3D Spatial Index
In recent years, the research on spatial index of huge point cloud has made considerable development. In this section, we give a historical overview of the research in this field.
Some researchers have also developed and used many ways to organize point image data, such as grid index (Wang Yanmin, 2002a; Zheng Kun, 2006; Xia Yu, 2006), quadtree, octree, k-d tree (Shi Wenzhong,etc.,2007), three-dimensional R-tree and its variants (Guttman A,1984; Gong Jun, etc., 2011).
From evolution process of spatial index structure, some representative hybrid and integration spatial index are presented for various application requirements (Fu Yuchen, 2003; Xia Yu, etc., 2006). For example, in order to solve the problem of multidimensional point access, Robinson proposed Kd-b-tree index (Robinson, 1981); In order to solve the multi-path search problem which is caused by quadtree and R-tree index space overlap, Guo Jing, who mixed 2k-ary trees and R-tree index, presented the QR-tree spatial index. The spatial index improves search performance (Guo Jing, 2003). In order to manage massive point cloud data efficiently, some scholars have proposed a two-level hybrid method which is based on Hilbert code and R-tree index. The method clusters point cloud group by Hilbert space-filling curve and controls data volume of each group under the desired size (Lai Zulong,etc., 2009). In order to improve the generation and query efficiency of two-dimensional and three-dimensional target space index, Qing Zhu(Qing Zhu, 2009;Gong Jun,2011)invented a three-dimensional R-tree spatial index method taking into account the multiple Levels Of Detail(LOD). The method uses the global optimum node selection algorithm and node shape factor of three-dimensional Cauchy value to ensure that the three-dimensional R-tree node distribution is more balanced.
Most spatial index is based on Minimum Bounding Box (MBB) of point objects and spatial entities. However, the index granularity of spatial index basically reaches to a single point object. It is obvious that it can not apply to the amount of spatial data, especially huge point cloud data. Existing spatial index tend to support the LOD technology of the memory or external memory, which is copied to the point cloud data backup typically while generating spatial index and the LOD data. It uses the approach of "space for time" to select the desired level for processing and visualization. Current software systems often use the program of hybrid and integration spatial index mechanism and the strategy of use from each other. There is not a spatial index is superior to others (Cheng Kun, 2006; Shi Wenzhong, 2007).It often needs to design an appropriate spatial index depending on the different application.
2. SPATIAL INDEX MECHANISM OF POINT IMAGE
2.1 The Design Idea of Quad-MBB Tree
The design of Quad-MBB(QMBB) tree uses the grid property of point image. The building method is based on 2D quadtree
space index in top-down way according to the point image's number of rows and columns. It carries on dichotomy on the basis of horizontal and vertical step angle respectively and does 2D segmentation to the point image data. Every segment forms a 2-D Minimal Bounding Rectangle (MBR).As shown in the left column of Figure 2, it represents the quadtree segmentation based on 2D range image of point image. According to each of the corresponding point image of MBR, a Minimal Bounding Box (MBB) is calculated in 3D space, with 2D quadtree to form 3D-MBB tree, as is shown in the right column of Figure 2.The 2D quadtree and 3D-MBB tree integrate up and constitute the 2D-3D spatial index:QMBB tree, which has both 2D and 3D features.
Figure 1 The Data partition of QMBB-tree spatial index
Index particle size of QMBB tree spatial index is a MBR and a MBB, which is a point set index actually. General quadtree nodes contain only 2D information, but the proposed QMBB tree in this paper contains both 2D and 3D properties. QMBB tree supports 2D and
3D space query and retrieval, and the point image model after splitting has no overlap points. In addition, the sampling points within non-leaf node of QMBB tree are from the original
data without
interpolation operation to ensure data accuracy. Node data structure of QMBB tree spatial index is shown in Figure 3, consisting
of the identification children pointing to the children node and the pParent logo pointing to the parent,3D coordinate offset named CoordOffset, 3D point ID migration called IDOffset, 3D point data ID called IdList, MBBox property of node MBB, MBR property for the ranks of the node location, the name of the node coding named strCode etc. The code of the node's name uses linear quadtree coding method,and encoded string length of each node name represents the node depth in QMBB spatial index tree.
2.2 The Spatial Index Construction of Quad-MBB Tree
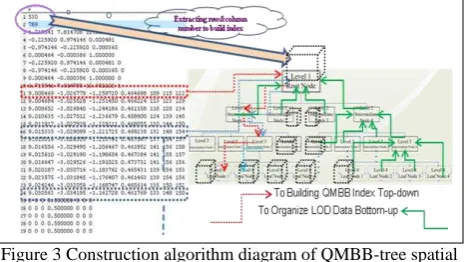
The construction process for QMBB tree spatial index is as follows, firstly ID value of points are defined in turn in the process of reading each point coordinates. According to the ID value the points are inserted into leaves node of the QMBB tree index. If the number of points stored in a node is more than the threshold, the nodes will be split until all the spatial points are inserted into QMBB tree. After construction of QMBB tree, the action is calculating MBB of each leaf node, using the method of uniform sampling in the way of bottom-to-top to fill non-leaf node data of spatial index tree until the root node, that is to say, non-leaf node of the QMBB tree can also store multi-resolution point image data, but not real 3D coordinate data, and it only stores the ID data of 3D point coordinate. The construction algorithm diagram is shown in Figure 4,in which it acquires the number of rows and column for single viewpoint image at first, and build QMBB tree according to the ranks number 530 * 789 from up to down, then insert every 3D point into corresponding leaf node in order, for instance the point of red dashed into "Level 3 leaf node 1", the point of blue dashed into "Level 3 leaf node 2",and when each effective 3D point are inserted into QMBB leaf node, it starts re-sampling to fill in non-leaf nodes with point image data in turn from the leaves node, as is shown by green lines arrow in the Figure 4.Such a 3D spatial index structure-QMBB tree on the basis of quadtree is generated for one-time and real-time. In the process of reading data, at the same time, large scale of point image model are divided into multi-resolution LOD data block logically.
Figure 3 Construction algorithm diagram of QMBB-tree spatial index of point image
2.3 Data Organization and Lossless Compression
After the structure of QMBB tree spatial index is built, multi-resolution LOD point image data is expressed through the depth of QMBB tree, and each layer of QMBB tree represents point image data of different resolution, which depends on uniformity sampling rate at the time building QMBB tree spatial index. The structure of QMBB tree spatial index can only store ID number of 3D point as information pointer of real point coordinates and intensity, and point coordinate data stores only a single copy, and in retrieval the data is queried through the ID conversion for moving pointer, so as to avoid storage redundancy of multi-level data. When point image data is managed using 3D R-trees spatial index in every scanning station, all the leaf nodes of 3D R-tree store the root node MBB of QMBB tree, at the same time, each node of 3D R-trees also store uniformity sampling data in each point image, using the way of 2-level mixed spatial index to manage all the point image model. Using Depth-First Traversal to serialize and store spatial index, spatial index structure of point image can be quickly recovered after retrieving serialized data.
Point image usually include such attribute information as ID, geometric coordinate, intensity, texture (RGB) and so on. Each 3D coordinates and the RGB texture of a point requires are recorded in three floating type data at least, a total of 24 bytes, while the ID and intensity value of a point needs one floating type data , 4 bytes. So the storage of a point object needs 32 bytes 256 bits totally, and if the data volume of storing twenty million points reaches about 610 MB, while it cannot be render completely with current video card memory in reserved mode. In order to speed up network transmission of the point image data, we must compress the point image data. Different data type should apply different compression methods, for the intensity value and RGB texture value, we stretch their each component to the range of 0-255 positive integers, using one byte to store them respectively, and draw in the way of integer type directly with OpenGL tools, and the stretching method will not affect point image's textured display; Inspired by 47th reference (Wang Yanmin, 2002), using quantitative methods of spatial compression for the coordinates of 3D float type point. Generally the Z coordinate of block data is large, but it is in commonly less than 1000 m. In the experiment, point quantity stored in QMBB tree node of the spatial index structure is controlled in 16384, reaching the balance between reading speed of point image data and efficiency of index retrieval. With minimal point distance between each scanning point as 1 mm, 16384 points in certain coordinate direction in space are at most in range of 16.384 m, and in general at X, Y direction can accurately express a point's direction coordinate using 14 bits; Because Z coordinates may be large, but generally can't be more than 1000 m. We adopt 20 bits to express Z-direction coordinates, and if the value is more than 1000 m it will be truncated and regarded as invalid points. Similarly we use two bytes to express the ID number of points. As shown in the Table 1, overall compression ratio of the method reaches 37.5%, namely two thirds of the data is compressed nearly.
Property type Bytes Before
Table 1. Lossless compression statistics of point image Data
3. EXPERIMENT AND ANALYSIS
A prototype system is implemented for interactive visualization management with fast browsing and retrieval of the query experiment prototype system is developed in ODP.NET program environment and OpenGL 3D graphic library.
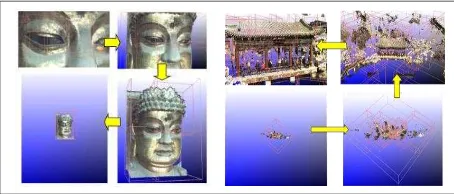
The LOD display of point image and point image model is shown in the Figure 5. The left diagram is point image data of a
Buddha’s head. The data file size is 18.52M, including 358062
effective and colorful points. The rendering number of the points approximately is 150000 in the screen every time. We use OpenGL 3D graphics library to realize this article’s algorithm on personal computer that has been introduced above, average frame rate is approximately 120 fps; the right diagram International Archives of the Photogrammetry, Remote Sensing and Spatial Information Sciences, Volume XXXIX-B4, 2012
is a multi-block point image model data. The data file size is 269.14M. It contains 12 blocks of point images and 5347765 colorful points. The average frame rate is approximately 60 fps.
Figure 5 LOD display of point image (Left:Buddha’s head) and point image model (Right: Beihai Park)
The red wireframe represents the MBB property of node data. The MBB size is related on the resolution. The higher the resolution is, more intensive MBB wireframe is, and the higher LOD level is, more details will be displayed in the computer screen. What should be noted is that the calculation operation of frame rate not starts when the graphics buffer is full but deal with the rendering data forcedly and immediately. This method calculating the frame rate is out of the limitations of the screen refresh rate. True visualization speed can be reflected better. What is reflected in Table 2 is that the efficiency of rendering point image data. According to the size of point sets after the LOD select the frame rate of valid point is different. Guarantee the basic premise of rendering quality, the rendering speed meet or exceed 10000000 (points/second) in our experiment. It is more than 2 times faster than Reference 15(ZHANG Long, ,ect,2005), and more than 6 times faster than Reference 16(L. Ren, ect, 2002). Total time of LOD data retrieval includes multi-station frustum cutting, LOD selecting and occlusion culling.
Table 2.Rendering efficiency statistics of point image model data using the proposed algorithm
The algorithm that this article presents supports to render huge point image model data. If the size of point’s number is larger than a threshold it will retrieval a certain level’s data from 3D R-Tree and QMBB-Tree. So it is able to maintain a high frame rate with acceptable rendering quality. As shown in the Figure 6, the left is whole point image model of the Hall of Supreme Harmony in Forbidden City, the file size is 1.54G, it is composed of 241596602 effective points, the valid quantity of 3D points is 10711195; the right is whole point image model of Zhonghedian, the file size is 4.74G, it is composed of 2038308028 effective points, the valid quantity of 3D points is 3940690.
Figure 6 Overall visualization of point image models
4. CONCLUSIONS AND FUTURE DEVELOPMENTS
The algorithm can read huge point image data and construct QMBB tree spatial index quickly at the same time. It accesses to organized spatial index data and point cloud data with 3D R-tree and QMBB-R-tree hybrid index. It can avoid unnecessary LOD data backup in external memory and the redundancy of the sampling points. It can save the space of external memory and main memory. Its query efficiency is higher in visualization operation and data structure is simple and effective. Under the premise of basic rendering quality it achieves higher rendering efficiency. The security of data and concurrency are ensured while taking advantage of commercial database to store spatial data. However, network bandwidth will limit transmission speed of point image data. It maybe affects the speed of point image model of real-time visualization.
With the rapid development of LIDAR data acquisition and processing technology, the data amount of a variety of spatial data and non-spatial data will continue to increase. So we need to consider the distributed and grid database management. Aiming to rendering quality and rendering efficiency a new GPU programmable means and adaptive point image model rendering mode should be used. At the same time, CUDA parallel computing architecture will be developed and applied for higher quality and efficient visualization systems.
References:
Zhang Fan, Huang Xian-feng, Li De-ren, 2009. Spherical Projection Based Triangulation for One Station Terrestrial Laser Scanning Point Cloud[J]. Acta Geodaetica et Cartographica Sinic. Vol.38( 1).
Mandow, A., Martínez, J.L., Reina, A., and Morales, J,2010. Fast range-independent spherical subsampling of 3D laser scanner points and data reduction performance evaluation for scene registration. In Proceedings of Pattern Recognition Letters. 1239-1250.
ZHENG Kun, ZHU Liang-feng, WU Xin-cai,LIU Xiu-guo, LI Jing. Study on Spatial Indexing Techniques f or 3D GIS[J]. Geography and Geo-Information Science. Vol.22 No.4, July 2006.
HE Zhen-wen, ZHENG Zu-fang, LIU Gang, WU Chong-long, 2011. Dynamic Generalized List Spatial Index Method. Geography and Geo-Information Science. Vol.27( 5),pp9-15. Li Qingquan, Yang Bisheng, Shi Wenzhong, Li Zhijun, Hu Qingwu, 2003. The theory and methods of spatial data acquisition, modeling, visualization[M], Wuhan University publication. Wuhan: Wuhan University Press.
Shi Wenzhong, Wu Lixin, Li Qingquan, Wang Yanbing, Yang Bisheng, 2007. Models and Algorithms for Three Dimensional Spatial Information System[M].Beijing: Publishing House of Electronics Industry.
Fu Yuchen,Guo Wei,Zhou Dongru, 2003. Hybrid-Tree: A Indexing Structure of Spatial Database[J]. Computer Engineering and Applications. Vol39(17).
Lu Mingyue,He Yongjian, 2008. Organization and Indexing Method for 3D Points Cloud Data. GEO-INFORMATION SCIENCE. Vol.10( 2),pp190-194.
Guo Ming, Wang Yanmin, Zhao Youshan, Zhou Junzha, 2009. Modeling of Large-Scale Point Model[C]. 2009 IEEE International Conference on Intelligence Computing and Intelligent Systems (ICIS 2009) , Vol. 4 , pp448-452.
ZHENG Kun,LIU Xiu-guo, YANG Hui, 2005. Research on Spatial Index Structure of LOD_ OR Tree in 3D GIS. BULLETIN OF SURVEYING AND MAPPING. Issue: 5,pp 27-29,39.
Xu Shaoping, Wang Minyan, Wang Weili, 2006. A New Index Structure for Moving Object Spatial Database Based on R Tree and Quan Tree. COMPUTER AND DIGITAL ENGINEERING. Vol.34(3),pp54-57.
LAI Zu-long, WAN You-chuan, SHEN Shao-hong, XU Jing-zhong, 2009. A Hilbert code and R-tree organizing method for large point clouds from LIDAR. SCIENCE OF SURVEYING AND MAPPING. Vol.34(6),pp128-130.
GONG Jun, ZHU Qing, ZHANG Hanwu, LI Xiaoming, ZHOU Dongbo, 2011. An Adaptive Control Method of LODs for 3D Scene Based on R-tree Index[J]. Acta Geodaetica et Cartographica Sinic. Vol.40, No.2.
Wang Yanmin, 2002a. A Study of Vector Spatial Data Organization for Multi-scale GIS[D]. Hubei: PhD thesis, Wuhan University.China.
ZHANG Long, DONG Zhao, CHEN Wei, PENG Qun-Shen, 2005. High Quality Real-Time Rendering of Large Scale Point Model[J]. CHINESE JOURNAL OF COMPUTER. Vol. 28 No. 2.
L. Ren, H. Pfister, and M. Zwicker,2002. Object space ewa surface splatting: A hardware accelerated approach to high quality point rendering. In Eurographics 2002 Conference Proceedings,pp 461-470.
Acknowledgements
This paper was founded by Funding for Natural Science of Beijing (KZ200910016001);Funding Project for Academic Human Resources Development in Institutions of Higher Learning Under the Jurisdiction of Beijing Municipality (PHR20110511).