RECORDING APPROACH OF HERITAGE SITES
BASED ON MERGING POINT CLOUDS FROM HIGH RESOLUTION
PHOTOGRAMMETRY AND TERRESTRIAL LASER SCANNING
P. Grussenmeyer*, E. Alby, T. Landes, M. Koehl, S. Guillemin, J.-F. Hullo, P. Assali, E. Smigiel
The Image Sciences, Computer Sciences and Remote Sensing Laboratory
LSIIT-TRIO UMR 7005, INSA Strasbourg, France
[email protected]
CIPA, ICOMOS and WG V/2 Session: Advances in Digital Documentation
KEY WORDS: Cultural Heritage, Photogrammetry, Recording, Matching, Geo-referencing, TLS, High resolution, Specifications
ABSTRACT:
Different approaches and tools are required in Cultural Heritage Documentation to deal with the complexity of monuments and sites. The documentation process has strongly changed in the last few years, always driven by technology. Accurate documentation is closely relied to advances of technology (imaging sensors, high speed scanning, automation in recording and processing data) for the purposes of conservation works, management, appraisal, assessment of the structural condition, archiving, publication and research (Patias et al., 2008). We want to focus in this paper on the recording aspects of cultural heritage documentation, especially the generation of geometric and photorealistic 3D models for accurate reconstruction and visualization purposes. The selected approaches are based on the combination of photogrammetric dense matching and Terrestrial Laser Scanning (TLS) techniques. Both techniques have pros and cons and recent advances have changed the way of the recording approach. The choice of the best workflow relies on the site configuration, the performances of the sensors, and criteria as geometry, accuracy, resolution, geo-referencing, texture, and of course processing time. TLS techniques (time of flight or phase shift systems) are widely used for recording large and complex objects and sites. Point cloud generation from images by dense stereo or multi-view matching can be used as an alternative or as a complementary method to TLS. Compared to TLS, the photogrammetric solution is a low cost one, as the acquisition system is limited to a high-performance digital camera and a few accessories only. Indeed, the stereo or multi-view matching process offers a cheap, flexible and accurate solution to get 3D point clouds. Moreover, the captured images might also be used for models texturing. Several software packages are available, whether web-based, open source or commercial. The main advantage of this photogrammetric or computer vision based technology is to get at the same time a point cloud (the resolution depends on the size of the pixel on the object), and therefore an accurate meshed object with its texture. After matching and processing steps, we can use the resulting data in much the same way as a TLS point cloud, but in addition with radiometric information for textures.
The discussion in this paper reviews recording and important processing steps as geo-referencing and data merging, the essential assessment of the results, and examples of deliverables from projects of the Photogrammetry and Geomatics Group (INSA Strasbourg, France).
* Corresponding author.
1. INTRODUCTION
The topic of digitization Cultural Heritage sites is often related to interdisciplinary research projects. Such projects are linked to the operability of recording approaches by taking into account the user’s needs in different fields as archaeology, architecture, geography, geology, etc. The approach is usually based on 3 steps: spatial data acquisition, modelling and texturing, management of spatial data.
Currently, the two most appropriate recording techniques are photogrammetry and laser scanning, both able to deliver dense point clouds. In section 2, experiences based on the combination of photogrammetric dense matching and Terrestrial Laser Scanning (TLS) in Cultural Heritage are shortly reviewed. Section 3 is a summary of important methodological steps in both methods. Results from a few
examples of recording are then discussed in section 4 and 5: a cave from the Bronze Age, a Roman Theatre, and a medieval castle. Finally, we draw the conclusion on accurate documentation by merging high resolution photogrammetry and laser scanning from these experiences.
2. RECORDING IN CULTURAL HERITAGE IS TECHNOLOGY DRIVEN
Actors working in the field of heritage documentation agree that
recording, documentation, and information management are among all the central activities of the decision-making process for heritage conservation management and a fully integrated part of research, investigation and treatment (Letellier et al.,
2007). The choice of the appropriate methods depends on the background and level of training or education of these actors in the field of surveying. Sometimes very simple recording International Archives of the Photogrammetry, Remote Sensing and Spatial Information Sciences, Volume XXXIX-B5, 2012
methods are adequate but more and more, 3D-(documentation, reconstructions, representations, surface models, photorealistic models, textured models, point clouds, etc.) are expected from the recording. The improvement of all methods for the surveying of cultural monuments and sites, especially by synergy effects gained by the combination of methods under special consideration of photogrammetry with all its aspects, is an important contribution to recording and perceptual monitoring of cultural heritage, to preservation and restoration of any valuable architectural or other cultural monument, object or site, as a support to architectural, archaeological and other art-historical research (http://cipa.icomos.org). A documentation project will be successful if data providers and users as architects, archaeologists can meet and work together with surveyors and other experts from the recording and modelling fields. That’s why CIPA’s main objective is to provide an international forum and focal point for efforts in the improvement of all methods for cultural heritage documentation.
The integration of several technologies in heritage documentation is discussed every time a new technology appears. Photogrammetry has always been technology driven. TLS technology is more recent and changed the documentation approach from vector based models to point cloud based approaches (Grussenmeyer and Hanke, 2010). For a long time, laser scanning was the main solution to produce dense 3D point-clouds allowing high resolution geometric models, while photogrammetry was more suited to produce high resolution 3D textured models of small objects. Today, both photogrammetry and laser scanning can produce dense and accurate point clouds. A review of papers related to the topic of merging TLS and photogrammetry data has been presented in Grussenmeyer et al.
(2011). The choice of the most effective technique is not always obvious (El-Hakim et al., 2004; Grussenmeyer et al., 2008; Remondino and Rizzi, 2010).). There is no single method or technique capable of giving satisfactory results in all measuring conditions (Voltolini et al., 2007). It is therefore interesting to consider different levels of integrated laser scanning and photogrammetric data. Medieval castles are often used as test bench for modelling issues related to the automation of photogrammetric methods and to the fusion of 3D models acquired with different techniques, at different point densities and measurement accuracies (Voltolini et al., 2007; Grussenmeyer et al., 2008). Interesting documentation requirements and specifications about the actual 3D surveying and modelling techniques and methodologies with their limitations and potentialities are given in Remondino and Rizzi (2010).
In the next section, methodology steps in TLS and photogrammetry are summarized.
3. RECENT CHANGES IN TLS AND PHOTOGRAMMETRY
3.1 TLS
After a decade of continuous development, TLS systems have reached a high level of automation allowing fast and accurate surveys in cultural heritage (Grussenmeyer et al., 2010; Lerma
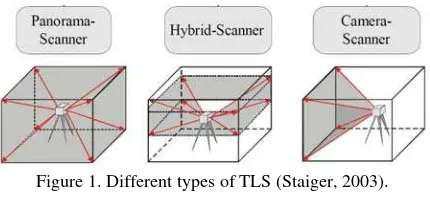
et al., 2009). Laser scanning systems can produce data that can vary in terms of point density, field of view (figure 1), amount of noise, incident angle, waveform and texture information. Data processing procedures are complex due to edge detection, filtering, and other registrations which require dedicated software packages, high performance computers and storage capacity. Accurate texturing of point clouds is a difficult task.
However, a very low level of post-processing is required to visualize the coloured 3D point clouds and navigate through.
Figure 1. Different types of TLS (Staiger, 2003).
For the practice of TLS projects, the reader can refer to the guidelines given in (Lerma et al., 2008) and (English Heritage, 2007). The usual steps of the pipeline are the following: - Survey planning
- Field operation - Data preparation - Data registration - Data processing
- Quality control and delivery
Data registration and geo-referencing steps are very important when considering point clouds from various sources. Each scanner position and orientation must be defined according to a local or global site coordinate system. An accurate geo-referencing is the root of an accurate project. Direct Geo-Referencing of point clouds is possible with scanners like Trimble GX or Leica Scan Station C10. Indirect Geo-Referencing is applied when the centring and orienting options are not available in the scanner. Target-to-target or cloud-to-cloud based registration are possible. For the post-processing of dense point clouds from photogrammetry, the indirect Geo-Referencing is also applied.
3.2 Photogrammetry
We focus here only on methods of generation of dense 3D point clouds and detailed surface models of physical objects from calibrated cameras, sometimes called photo-based scanning. Multiview 3D reconstruction solutions with detection of automated image correspondences using area and feature based matching algorithms are key solutions for the future of documentation. Barazzetti et al. (2010) and Ducke et al. (2011) published methodologies based on multi-image matching techniques from computer vision or photogrammetry in order to produce dense and accurate point clouds from series of overlapping images. Both academic and commercial solutions are available today for automated image orientation, surface measurement, mesh generation and texture mapping. In Hullo et al. (2009), we present a practical example based on dense stereo matching approaches for the documentation of a site in a desert where only digital cameras could be used.
The usual steps of the pipeline are the following:
- Data acquisition (camera calibration, multi-view recording) - Automatic orientation of the images (relative orientation, scaling or geo-referencing, bundle adjustment)
- Dense matching (stereo matching or multi-view) - Post-processing
- Quality control and delivery.
- Distortion free images can be processed after calibration International Archives of the Photogrammetry, Remote Sensing and Spatial Information Sciences, Volume XXXIX-B5, 2012
The main advance in the last few years has been the automation of image orientation (with or without coded targets) at a sub-pixel resolution. Several software packages are available, whether web-based, open source or commercial.
The accuracy of the resulting point-cloud relies mainly on the quality of the camera, the object pixel-size and of course the configuration of the field survey.
3.3 Merging TLS and Photogrammetry
Most of the scanners are today able to measure panoramas (figure 2, right). To overcome limits (holes and gaps) due to the use of hybrid scanners (figure 2, left), photogrammetry can provide complementary point clouds for uncovered areas (Alby
et al., 2011b).
Figure 2. Horizontal section of underground galleries (1m wide) recorded by TLS (left: gaps due to the use of hybrid scanner as
Trimble GX, and right: better coverage with the Leica C10 panorama scanner)
Both TLS and photogrammetry techniques are able to deliver dense point clouds. Compared to TLS, the photogrammetric solution is a low cost one as the acquisition system is limited to a digital camera and a few accessories only. Indeed, the stereo matching process offers a cheap, flexible and accurate solution to get 3D point clouds and textured models. The main advantage of this photogrammetric methodology is to get at the same time a point cloud (the resolution depends on the size of the pixel on the object), and therefore an accurate meshed object with its texture. After the matching and processing steps, we can use the resulting data in much the same way as a TLS point cloud, but with really better raster information for textures.
In addition, point clouds from close range scans (as e.g. acquired by laser scan arms) can also be merged with TLS and photogrammetry data (see section 4).
In the following sections, examples showing different levels of integrated photogrammetry and TLS data will be discussed.
4. THE BRONZE AGE CAVE “LES FRAUX”
(DORDOGNE, FRANCE)
4.1 Site description and recording
The Bronze Age cave “Les Fraux” at Saint-Martin-de-Fressengeas (Dordogne, France) is made of a network of galleries of several hundred meters, used since 2008 as a field of investigation by several researchers.
The cave is linked to the above terrain thanks to surveying techniques, allowing accurate geo-referencing in the French Geodetic Reference System. The aim of the documentation work (Grussenmeyer et al., 2010) is to generate a geometric and photorealistic 3D model from the combination of point clouds and photogrammetric images, for both visualization and accurate documentation purposes. As the movements in the cave are restricted along a path designed by the head of the project due to several archaeological remains all around the cave, complementary recording methods are necessary.
4.2 Instrumentation and tasks
The documentation and recording processes include different steps:
- Accurate network of reference points (GPS points outside, a few marks only on paths of the cave inside), spheres and coded targets for the registration of point clouds and photogrammetric bundle adjustment;
- Overall recording of all the galleries by Terrestrial Laser Scanning (FARO Photon 80, 120 or Focus 3D) at high spatial resolution (figure 3);
- Overall photogrammetric recording by calibrated digital SLR cameras (Canon EOS 5D with 28mm and 85mm lenses); - Sub-millimetre scanning of clay carvings with a FARO Scan Arm;
- Panoramas captured with a Manfrotto Pan Head.
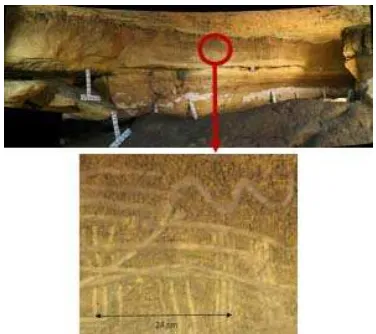
We focus in this section on the 3D models of a clay panel with carvings (figures 4, 5 and 6). The data available are both TLS point clouds, Canon EOS 5D images for photogrammetry and Scan Arm data of parietal art on the clay panels
4.3 Overview of results
Figure 3. Example of recording in the cave with the TLS FARO Focus 3D, with the overall meshed model on the right.
Figure 4. Panoramas and zoom on details of parietal art features requiring very accurate recording (object pixel size is less than 0.5mm)
Figure 5. Visualization of the sub-millimetric meshed model (250mm x 160mm) of a clay panel recorded with the FARO ScanArm, with textures (right)
Figure 6. 3D textured raw model obtained by dense stereo matching from two panorama standpoints in front of the clay panel (the distance to object is 5m, focal length 85mm, pixel size in the object is less than0,5mm, base/distance ratio is 0,4).
Our experiences confirm that TLS is fast and appropriate for the overall recording of the cave but unsuitable for sub-millimetre modelling where photogrammetry dense matching and laser ScanArm can both provide very accurate models for research in parietal art.
5. THE GALLO-ROMAN THEATRE OF MANDEURE
5.1 Site description and recording
The Roman theatre of Mandeure (France) is the second biggest in Gaule. At the roman era, the city around was used to be known as Epomanduodurum. Its overall area is estimated to 2 km2. The theatre, leaning on a hill of the river Doubs, has a diameter of 142 meters and its capacity is estimated between 15000 and 18000 seats. Excavations have been carried out for about ten years. The main objective of the recording project consists of the realization of a digital terrain model and built elements of the theatre in its current state. Because of the size of the site and the resources available we opted for a combination of photogrammetric methods and TLS. The hybrid model is thus obtained from the fusion of different data:
- Terrestrial Laser Scanner (Trimble GX)
- Aerial LiDAR (from Aerodata International Survey) - Dense Stereo Matching Photogrammetry
Currently, sub-millimeter point clouds of milestone fragments are recorded with a Faro Laser ScanArm.
5.2 Instrumentation - Tasks
Because of the size of the site, a long-range TLS is needed (figures 7 and 8). On the other hand, the remains of the building would have required a very large number of stations. Since, the Trimble GX TLS (standard deviation: 3mm at 50m) has a quite narrow field of view and a low scanning speed, it became obvious that this technique is not well suited for some parts of the site (the remains of the buildings and the excavations). We chose then to complete the TLS point cloud by data obtained by Dense Stereo Matching Photogrammetry (figure 9).
A global geo-referenced point cloud has first been obtained by Terrestrial Laser Scanning which consists of 8 Million points obtained from 14 different stations. The spatial resolution is comprised between 1 cm and 5 cm and the accuracy is estimated to 1 cm. Another 16 million points has been obtained by dense matching.
With the 28mm focal length and for a five meters distance to the object, one obtains an object-pixel size of 1.5mm. We have
used standard Photomodeler coded targets to ease the orientation step and the scale setting step.
Figure 7. Positioning of the Trimble GX TLS at the ground level of the theatre of Mandeure.
Figure 8. Overall view of the Gallo-roman Theatre of Mandeure (France) from the Trimble GX coloured point clouds.
Figure 9. Canon EOS 5D with 28mm focal length: stereopair (left) and 3D textured model from matching (right).
500 images have been used in 2010 for the dense matching part in 125 sub-projects. The total acquisition time was about 20 hours. The local spatial resolution was about 5 to 10 mm.
Then, thanks to overlapping areas, we have merged the different projects in order to obtain « blocks » (figure 10). After registration of the “blocks” together with the TLS point cloud, they are getting geo-referenced as described hereafter. This has been achieved through the 3DReshaper ® software by means of
two steps. A first coarse registration is made by selecting manually corresponding points in the two different clouds. As a second step, an automatic fine registration is being processed by means of a 7 parameters transformation (ICP algorithm) with the geo-referenced TLS cloud as the reference (figure 8). One can notice that the scale factor in this transformation has proved to be very close to unity because the clouds originating from photogrammetry had already been scaled.
Figure 10. Complete 3D point cloud of the theatre (diameter 142m) of Mandeure (France). Point clouds (in red) based on dense matching are combined with TLS data (green-blue).
5.3 Assessment of merging TLS and image based data
Visual analysis: A first quick control of the data may be done by visualizing appropriate sections as seen on figure 11. It allows to take note instantly that a gross error has been done and then to correct the process. However, in order to certify the quality of the whole process, it remains necessary to achieve quantitative control.
Figure 11. Horizontal section of the southern part of the theatre coloured by cloud: green for the image based point cloud and
blue for the TLS point cloud.
Quantitative analysis: The quantitative control consists in measuring the distance between both clouds and is achieved by means of the CloudCompare software developed by the research department of EDF (France). The Hausdorff distance is computed on overlapping areas of both point clouds and the results are given hereafter. The standard deviation of the error has been computed to 2.8 cm which has been judged as being satisfying as regard to the global size of the archaeological site. One can notice on the histogram of the error that 57 % of the points have an error inferior to 2 cm, 66 % inferior to 3 cm and 87 % inferior to 4 cm. Some quite important errors are reported on current excavations as seen on figure 12 (parts in red). It is most likely that these errors originate from the fact that elements (blocks) may be displaced slightly during the excavation period, both clouds having not been acquired simultaneously.
Figure 12. Quantitative assessment and error map
More details about this project are presented in Hullo et al.
(2010) and Alby et al. (2011a).
6. ENGELBOURG CASTLE (THANN, FRANCE)
6.1 Project description and recording process
The Engelbourg castle (13th century) has been destroyed in 1673 due to its situation in eagle’s nest overlooking one of the major crossings between Alsace and Lorraine. These ruins have been the subject of several archaeological studies in the last years. The work of our group was to provide a 3D model to be used as a benchmark dataset for the Archaeological Information System currently under development. A combination of geodetic surveying, image matching and TLS techniques has been used (Koehl and Berger, 2011).
6.2 Instrumentation and results
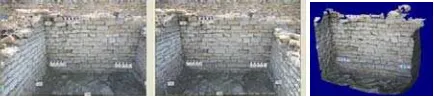
The point clouds were recorded with a Trimble GX (Figure 13) and the images with a Canon EOS 5D camera. As the Trimble GX TLS has a field of view limited to 60° and a minimum distance acquisition (2m), it makes it inadequate for special situations. In this project, some narrow parts of the site have been completed by dense matching of the images with Photosynth and related toolkit (Figure 14). A geodetic network has been set prior to the recording and used for the registration of the point clouds.
Figure 13. Overview of the Engelbourg project
Figure 14. Photos (left) and corresponding coloured point cloud from Photosynth
The following point cloud shows the result of the merging of the different point clouds. The main part of this project is TLS based. The input of Photosynth was limited to narrow parts of the ruin.
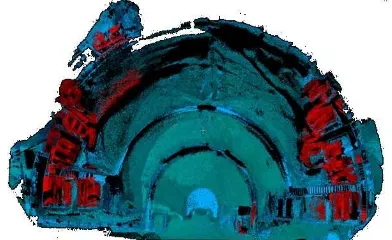
Figure 15. Point clouds merged in a panoramic view. The so-called “Eye of the Witch” is visible on the top of the hill. International Archives of the Photogrammetry, Remote Sensing and Spatial Information Sciences, Volume XXXIX-B5, 2012
7. CONCLUSION
The approach proposed in this paper has shown that accurate point clouds can be delivered from both TLS and dense image matching, and thus merged for documentation in cultural heritage. TLS technology is now mature and delivers point clouds easy to assess. More and more tools for dense matching of images are available (whether web-based as Photosynth, open source or commercial) with a high level of automation in the image matching and registration.
To ensure the accurate merging of the different datasets, an accurate network of geodetic control points well distributed on the study area is advised for direct or indirect geo-referencing. In the examples discussed in the paper, the TLS available was not suited for the recording of specific types of objects and areas in the projects. TLS aided by dense image matching finally showed that a high level of integration is possible for tightly laser scanning and photogrammetry data. More examples of projects from the Photogrammetry and Geomatics group are presented in Alby et al. (2011b) and Landes et al.
(2011).
References from Journals:
Alby, E., Smigiel, E., Assali, P., 2011a. Valorisation numérique du théâtre Gallo-romain de Mandeure. Revue Française de Photogrammétrie et Télédétection n°196, n°196, pp. 2-9.
Barazzetti, L., Scaioni, M., Remondino, F., 2010. Orientation and 3D modelling from markerless terrestrial images: combining accuracy with automation, The Photogrammetric Record, 25(132), pp. 356-381.
Ducke, B., Score, D., Reeves, J., 2011. Multiview 3D reconstruction of the archaeological site at Weymouth from image series, Computers & Graphics, 35(2), pp. 375-382.
El-Hakim, S.F.; Beraldin, J.-A.; Picard, M.; Godin, G., 2004. Detailed 3D reconstruction of large-scale heritage sites with integrated techniques, Computer Graphics and ApplicationsIEEE, 24(3), pp. 21–29.
Lerma, J., Navarro, S., Cabrelles, M., Villaverde, V., 2009. Terrestrial laser scanning and close range photogrammetry for 3D archaeological documentation: the Upper Palaeolithic Cave of Parpalló as a case study, Journal of Archaeological Science, Volume 37, Issue 3,pp. 499-507.
Remondino, F., Rizzi, A., 2010. Reality-based 3D documentation of natural and cultural heritage sites: techniques, problems, and examples, Applied Geomatics, 2(3), pp. 85-100.
References from Books:
Grussenmeyer, P. & Hanke, K., 2010. Cultural Heritage Applications. Chapter in Vosselman, G. & Maas, H.G. (Eds).
Airborne and Terrestrial Laser Scanning. Whittles Publishing, pp. 271-290.
Lerma, J. L., Van Genechten, B., Heine, E., Quintero, M. S., 2008. 3D RiskMapping – Theory and practice on Terrestrial Laser Scanning, Editor Universidad Politecnica De Valencia, 261 pages.
Patias, P., Grussenmeyer, P. & Hanke, K., 2008. Applications in Cultural Heritage Documentation. In: Li, Z., Chen, J., & Baltsavias, E., (eds.): Advances in Photogrammetry, Remote Sensing and Spatial Information Sciences: 2008. ISPRS Book Series, Volume 7 (527p.), pp. 363-383.
References from Other Literature:
Alby, E., Grussenmeyer, P., Poitevin, V., 2011b. From 3D Recording to virtual visit of Archaeological sites: methodology applied to the medieval fortress of Châtel-sur-Moselle (France).
CIPA Int. Archives for Documentation of Cultural Heritage, Vol. XXIII-2011, 8 pages.
Grussenmeyer, P., Landes, T., Voegtle, T., Ringle, K., 2008. Comparison methods of terrestrial laser scanning, photogrammetry and tacheometry data for recording of cultural heritage buildings. The Int. Archives of Photogrammetry Remote Sensing and Spatial Information Sciences, XXXVII (B5), 213-218 (2008).
Grussenmeyer, P., Cazalet, B., Carozza, L., Burens, A. (2010). Close Range Terrestrial Laser Scanning and Photogrammetry for the 3D-Documentation of the Bronze Age Cave Les Fraux in Périgord (France). Proceedings for the 1st Mining in European History-Conference of the SFB-HIMAT, Innsbruck university press, pp. 411-421.
Grussenmeyer, P., Alby, E., Assali, P., Poitevin, V., Hullo, J.-F., Smigiel, E., 2011. Accurate Documentation in Cultural Heritage by merging TLS and high resolution photogrammetric data. SPIE Optical Metrology 2011, Videometrics, Range Imaging and Applications, Vol. 8085, 13 pages, DOI: 10.1117/12.890087.
Hullo, J.-F., Grussenmeyer, P., Fares, S., 2009. Photogrammetry and Dense Stereo Matching Approach Applied to the Documentation of the Cultural Heritage Site of Kilwa (Saudi Arabia), CIPA International Archives for Documentation of Cultural Heritage, XXII, 6 pages.
Hullo, J.-F., Grussenmeyer, P., Assali, P., Smigiel, E., 2010. Dense point cloud acquisition via stereo matching applied to: the Kilwa archaeological site and the Gallo-Roman theatre of Mandeure, The 11th International Symposium on Virtual Reality Archaeology and Cultural Heritage VAST, 4 pages.
Koehl, M., Berger, S., 2011. 3D Model supports archaeological knowledge base. CIPA Int. Archives for Documentation of Cultural Heritage, Vol. XXIII-2011, 8 pages, (on CD-ROM).
Staiger, R., 2003. Terrestrial laser scanning: Technology, systems and applications. Second FIG Regional Conference, Marrakech, Morocco, December 2-5, 2003.
Landes, T., Schwien, J.-J., Berger, S., Peter, N., Alby, E., Grussenmeyer, P., 2011. Finding a suitable model for archeaologists. Application to a compound wall of Ribeauvillé (Alsace). CIPA Int. Archives for Documentation of Cultural Heritage, Vol. XXIII-2011, 7 pages.
Voltolini, F., El-Hakim, S., Remondino, F., Girardi, S., Rizzi, A., Pontin, M., Gonzo, L., 2007. Digital documentation of complex architectures by integration of multiple techniques: the case study of Valer Castle, Proc. SPIE, Volume 6491, pp. 64910U, DOI: 10.1117/12.702727.
References from websites:
English Heritage, 2007. 3D Laser Scanning for Heritage: advice and guidance to users on laser scanning in archaeology and architecture], Product code 51326, 44p.
http://www.helm.org.uk/upload/pdf/publishing-3d-laser-scanning-reprint.pdf, (16 April 2012).
Letellier, R., Schmid, W., LeBlanc, F., 2007. www.getty.edu/conservation/publications/pdf_publications/reco rdim.html (16 April 2012).