APPLICATION OF SOFTMAX REGRESSION AND ITS VALIDATION FOR
SPECTRAL-BASED LAND COVER MAPPING
J. Wolfe a, X. Jin a, T. Bahr b, N. Holzer b, * a
Harris Corporation, Broomfield, Colorado, U.S.A. – (jwolfe05, xjin)@harris.com b Harris Corporation, Gilching, Germany – (thomas.bahr, nicolai.holzer)@harris.com
KEY WORDS: Softmax Regression, Classification, Land Cover, Multispectral, Hyperspectral, Desktop, Enterprise
ABSTRACT:
The presented Softmax Regression classifier is a generalization of logistic regression. It is used for multi-class classification, where classes are mutually exclusive. Implemented in a classification framework, it provides a flexible approach to customize a classification process. Traditional classification is focused with classifiers that can only be applied on the same dataset. The Softmax Regression classifier can be created and trained on a reference dataset using spectral and spatial information and then applied to similar data multiple times. We present the general workflow of Softmax Regression classification as part of a case study that is based on attribute images derived from hyperspectral airborne and elevation imagery.
* Corresponding author
1. INTRODUCTION
Remotely sensed imagery, both multispectral and hyperspectral, forms an excellent source of information about the Earth's surface, especially when it is coupled with spatial data (height, texture, shape, etc.). A key task in processing is feature selection, particularly in the case of classification. A logistic regression model may be used to predict the probabilities of the classes on the basis of the input features, after weighting them according to their relative importance.
Traditionally, classifiers are tied to one data source. The workflow described in this contribution allows training and evaluating the performance of a classifier once and then applying it to similar data multiple times. It is based on Softmax Regression, a generalization of logistic regression that is used for multi-class classification where classes are mutually exclusive.
Currently, the classification workflow uses the ENVI application programming interface (API). This API in combination with the multiple image approach predisposes the workflow to be executed in both desktop and enterprise environments, e. g. to support time-series analysis of specific features.
A case study is used to demonstrate and evaluate this Softmax Regression approach, exemplified by the classification of an urban environment with five simple classes: Asphalt, Concrete, Grass, Tree, and Building.
The test site we selected is located in the urban area of Fruita, Colorado, USA. Data files were provided by the National Ecological Observatory Network (NEON), Boulder, CO, USA, 2014. Files were accessed in July 2016, available online at http://neonscience.org from the National Ecological Observatory Network. The image to be classified was acquired on 17 July 2013 with a NEON imaging spectrometer. Out of the
original 426 spectral bands, only four essential bands were LiDAR software application to process NEON point-cloud data. We created a digital surface model (DSM) and digital elevation model (DEM), then subtracted the DEM from the DSM to create a relative height image at 0.5 meter resolution.
For a reference image, we chose a digital orthorectified photograph from the NEON RGB camera at 0.25 meter resolution, captured at the same time as the NEON image.
2. INTRODUCTION TO SOFTMAX REGRESSION
Softmax Regression is a classification method that generalizes logistic regression to multi-class problems, i.e. with more than and a bias unit, and only one output layer, or class (Figure 1). It is essentially a binary classifier. For each attribute, a weight (θ) is computed using a stochastic gradient descent function. An activation function (φ) determines if the attribute belongs to the output class or not.
The Softmax Regression algorithm applies binary logistic regression to multiple classes at once. Figure 2 shows an example of the Softmax Regression model with five attributes and three classes. The weights (θ) were omitted from the diagram for clarity, but they are computed for each attribute-to-class mapping.
Figure 1. Example of a simple logistic regression model.
Figure 2. Example of a Softmax Regression model with five attributes and three classes.
Softmax Regression differs from multiple binary logistic regression classifiers in the following way: Those classifiers are used with multiple classes when some objects naturally belong to more than one class. Examples include Green, Trees, and Grass. With a multiple binary classifier, objects might fall into both the Green and Trees class, or Green and Grass. It evaluates membership in a given class independently from membership in other classes.
Softmax Regression was designed for use with multiple classes that are mutually exclusive from each other. It does not evaluate class membership independently from other classes. An example is Vegetation, Bare Soil, and Impervious.
For each data item, Softmax Regression computes activation values for each output class. It normalizes the values to obtain a set of probabilities that sum to 1. The class with the highest probability wins, and the data item is assigned to that class. An ideal scenario is if one class has a probability close to 1 and the others are close to 0.
3. SOFTMAX REGRESSION CLASSIFICATION
3.1 General Workflow
Figure 3 shows a typical workflow where the Softmax Regression classifier is used. For the operation of the single processing steps (as described in sections 3.1 to 3.5) in service-based production environments we embedded them in an IDL-based task system. IDL (Interactive Data Language), as the development language of ENVI, allows one to extend or customize ENVI features and functionality and to integrate them in existing geospatial workflows.
Based on IDL, ENVI introduced an ENVITask API for processing data. ENVITasks provide an object-oriented approach to run ENVI analytics programmatically. ENVITasks are objects with properties and methods. After instantiation, their properties can be manipulated before executing them. Each step in the workflow of Figure 3 represents the corresponding ENVITask.
Figure 3. Softmax Regression classification workflow using ENVITasks.
3.2 Data Preparation for Classification
Before running a Softmax Regression classification, we included a variety of attributes from the source image rather than spectral information alone, which often yields more accurate classification results. Attributes are unique characteristics that can help distinguish between different classes in an image. Examples of attributes include reflectance, elevation, texture, and shape. In a multi-band attribute image, each band represents a different attribute. Each layer (band) must have the same number of rows and columns, the same pixel size, and the same spatial reference. Figure 4 shows an example of the layer stack used with six attributes. A prerequisite was applying atmospheric correction to the spectral data before creating the multi-band attribute image.
Figure 4. Example of a multi-band attribute image, where each band represents a different attribute.
3.3 Collection of Training Data
With supervised classification, one collects samples of pixels that belong to each class. This training data is used to train the classifier and classify pixels of unknown identity into known The International Archives of the Photogrammetry, Remote Sensing and Spatial Information Sciences, Volume XLII-1/W1, 2017
classes. Training data for this case study was collected by drawing regions of interest (ROIs) for each of the five feature types (Buildings, Trees, Grass, Concrete, and Asphalt) on the high-resolution orthorectified NEON photograph that was co-registered with the NEON reflectance image to be classified (Figure 3, step 1).
Figure 5. Example of the pixel values for six attributes in one ROI polygon using the building class.
The one-dimensional array (or vector) of pixel values of the highlighted pixel indicated in Figure 5 is called an example in the following sections.
3.4 Definition and Training of the Classifier
The next step in the classification process is to define a classification method, or classifier (Figure 3, step 5). Then the examples and class values are passed to a trainer to iteratively minimize the classification error. The classifier will be trained on one set of examples and evaluated with another set.
For this purpose, the examples were shuffled to create a random distribution of data (Figure 3, step 3). Then a task was used to split the examples into two separate array elements (Figure 3, step 4): The first array element contained the examples that were used to train the classifier. The second array element contained the examples for the evaluation of the classifier. A specific keyword was set to determine the percentage of the original examples used for training; the other percent were used for evaluation.
A trainer is an algorithm that iteratively trains a classifier in order to minimize its error. It tries to adjust the classifier's internal parameters until the error (also called loss) converges on a minimum value. A loss function calculates the loss, which is a unitless number that indicates how closely the classifier fits the training data. A value of 0 represents a perfect fit. The further the value from 0, the less accurate the fit. A high-quality fit does not ensure that new data will be classified correctly. The classifier still must be evaluated with untrained data after training is complete.
The Softmax Regression classifier should use a gradient descent trainer (Figure 3, step 6). A gradient descent algorithm iteratively updates the classifier according to the classifier's gradient for that iteration (Figure 3, step 7). It iterates until the loss function converges on a minimum value. The gradient descent trainer takes three input parameters:
Figure 6. Loss profiles are used for the evaluation of the Softmax Regression classifier. A) The curve should flatten and
approach a minimum value. B) If the learning rate is set to a smaller value, the maximum number of iterations must be increased for the loss function to converge. This can increase processing time. C) If the learning rate is set to a smaller value without increasing the maximum number of iterations, the curve
starts to approach a minimum but never reaches it. D) If the learning rate is set too high, the loss profile reveals oscillations
and the solution never converges.
• Maximum iterations: The maximum number of iterations for which to compute the minimum, if the convergence criterion is not met.
• Convergence criterion: Iterations stop when the change in loss value from the previous iteration falls below a specified threshold. This threshold is the convergence criterion.
• Learning rate: The step size to take downhill during each
iteration.
The Softmax regression classifier is sensitive to data values that widely vary. Therefore normalization was used to apply a gain and offset to the examples (Figure 3, step 2) to get the data into a consistent range of values prior to classification.
It is advantageous that this type of classifier can be trained once and used many times to classify similar datasets. It can also be trained in stages (for example, as more data become available) where subsequent training will further refine the classifier.
The plots in Figure 6 represent the loss profiles to evaluate how well the input parameters worked together to converge on a minimum value.
3.5 Evaluation of the Classifier and Final Classification
The performance of the Softmax Regression classifier was evaluated (Figure 3, step 8) using the examples and corresponding truth class values that were not used to train the classifier (Figure 3, step 4, second array element). Predicted class values from these input examples were calculated. Finally accuracy metrics derived from a confusion matrix between the truth class values and the predicted class values were computed (Table 1).
Asphalt Concrete Grass Tree Building
Error of
commission 0.004 0.012 0.010 0.005 0.007
Error of
omission 0.006 0.015 0.001 0.008 0.007
F1 value 0.995 0.986 0.994 0.993 0.993
Precision 0.996 0.988 0.990 0.995 0.993
Producer
accuracy 0.994 0.985 0.999 0.992 0.993
Recall 0.994 0.985 0.999 0.992 0.993
User
accuracy 0.996 0.988 0.990 0.995 0.993
Overall accuracy 0.994 Kappa coefficient 0.991
Table 1. Accuracy metrics for the Softmax Regression classifier.
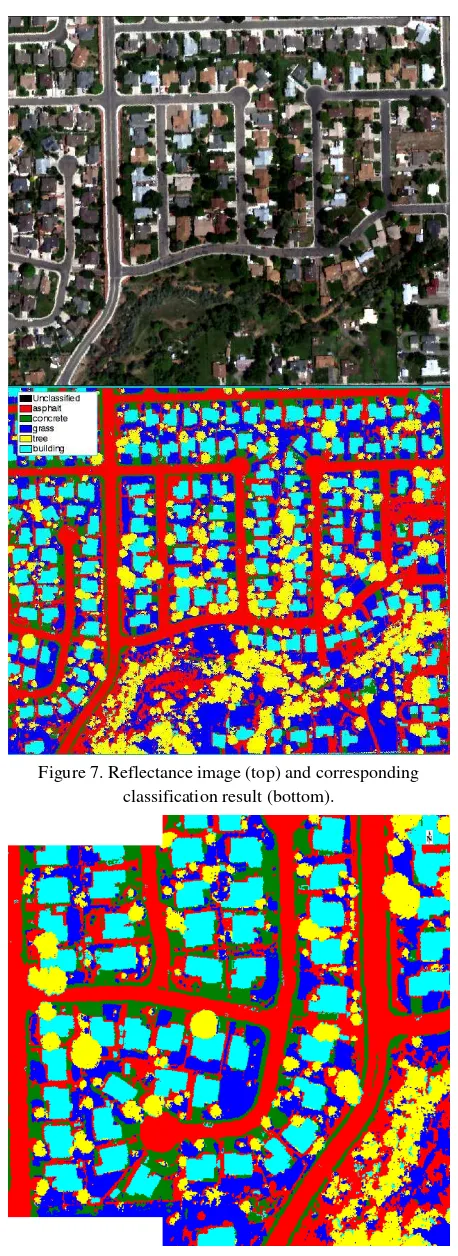
The final step in this classification framework is to classify the attribute image (Figure 3, step 10). Prior to this step the gains and offsets computed in step 3 were applied to the attribute image (Figure 3, step 9). This ensured that the pixel values were properly scaled among the different attributes. Figure 7 shows both the unclassified reflectance image and the Softmax Regression classification result.
After classifying the attribute image, we applied the trained classifier to a neighbouring dataset of the same sensor, which had the same attributes and data representation. The subset in figure 8 demonstrates how precisely the two classification images overlap and proves that the trained classifier is applicable to similar datasets.
Figure 7. Reflectance image (top) and corresponding classification result (bottom).
Figure 8. Merge of two classification images. The Softmax Regression classifier was trained on the attribute image corresponding to the right classification image and then applied
on the attribute image corresponding to the left classification image.
4. CONCLUSIONS
The workflow described in this contribution is based on Softmax Regression, a generalization of logistic regression that is used for multi-class classification where classes are mutually exclusive. It allows training and evaluating the performance of a classifier once and applying it to similar datasets.
We evaluated this Softmax Regression approach within a case study about the classification of an urban environment with five simple classes: Asphalt, Concrete, Grass, Tree, and Building. After classifying one attribute image, we applied the trained Softmax Regression classifier to a neighbouring dataset from the same sensor. The two classification images overlap precisely. This example demonstrated that a trained classifier can be applied to other similar datasets that have the same attributes and data representation.
Currently, the classification workflow is based on the ENVI application programming interface (API). Therefore, the presented automated Softmax Regression classification can be embedded in virtually any existing geospatial workflow for operational applications, including both desktop and enterprise environments. Three integration options were implemented as part of this case study:
• Integration within any ArcGIS® environment, which can be
deployed on the desktop, in the cloud, or online. Execution uses a customized ArcGIS® script tool. A Python script file retrieves the parameters from the user interface and runs the precompiled IDL code. That IDL code is used to interface between the Python script and the relevant ENVITasks.
• Publishing the processing tasks as services via the Geospatial Service Framework (GSF). GSF is a cloud-based image analysis solution to publish and deploy advanced ENVI image and data analytics to existing enterprise infrastructures. For this purpose the entire IDL code can be capsuled into one single ENVITask.
• Integration in an existing geospatial workflow using the IDL bi-directional Python bridge. This mechanism allows calling IDL code within Python on a user-defined platform.
REFERENCES
Greene, William H., 2012. Econometric Analysis (7th ed.). Boston: Pearson Education. pp. 803–806. ISBN 978-0-273-75356-8.
Harris Corporation, 2016. ENVI Documentation, ENVI v5.4.
Stanford University (Ed.), 2013. Unsupervised Feature Learning and Deep Learning. http://ufldl.stanford.edu/wiki/ index.php/Softmax_Regression (updated April 2013, accessed September 2016).