RELATIONSHIPS BETWEEN PRIMARY PRODUCTION AND CROP YIELDS IN SEMI-ARID
AND ARID IRRIGATED AGRO-ECOSYSTEMS
H. H. Jaafar a,*, F. A. Ahmad a,
a Faculty of Agriculture and Food Sciences, American University of Beirut - (hj01,fa76)@aub.edu.lb
KEY WORDS: Agriculture, Crop, GIS, Analysis, Correlation, Satellite, Spatial.
ABSTRACT:
In semi-arid areas within the MENA region, food security problems are the main problematic imposed. Remote sensing can be a promising too early diagnose food shortages and further prevent the population from famine risks. This study is aimed at examining the possibility of forecasting yield before harvest from remotely sensed MODIS-derived Enhanced Vegetation Index (EVI), Net photosynthesis (net PSN), and Gross Primary Production (GPP) in semi-arid and arid irrigated agro-ecosystems within the conflict affected country of Syria. Relationships between summer yield and remotely sensed indices were derived and analyzed. Simple regression spatially-based models were developed to predict summer crop production. The validation of these models was tested during conflict years. A significant correlation (p<0.05) was found between summer crop yield and EVI, GPP and net PSN. Results indicate the efficiency of remotely sensed-based models in predicting summer yield, mostly for cotton yields and vegetables. Cumulative summer EVI-based model can predict summer crop yield during crisis period, with deviation less than 20% where vegetables are the major yield. This approach prompts to an early assessment of food shortages and lead to a real time management and decision making, especially in periods of crisis such as wars and drought.
1. INTRODUCTION
In the last decade, remote sensing techniques were one of the main components that contributed to a shift toward increased precision in crop management (Jones & Vaughan, 2010). Such techniques provide spatially and temporally distributed information, leading to a real time management and decision making. Early diagnosis and estimation of yield is a must when early intervention is needed, mainly in the case when yield deficit threatens food security. The importance of these techniques lies in regions where yield data is either unreliable or non-existent, the case in war affected countries. Many image-based parameters and models that monitor agricultural performance exist in literature. However, verification and validation of such models remain a challenge. Primary production and vegetation indices were used to assess and predict crop yields (Running, et al., 2004; Reeves, Zhao, & Running, 2005). The Normalized Difference Vegetation Index (NDVI) was frequently used in crop forecasting and to detect crop areas (Domenikiotis, Spiliotopoulos, Tsiros, & Dalezios, 2004; Mkhabela, Mkhabela, & Mashinini, 2005). Quarmby et al. (1993) demonstrated that NDVI is an accurate early warning indicator for years with poor yield. NDVI was a good predictor of wheat, cotton and rice yields in northern Greece (Quarmby, Milnes, Hindle, & Silleos, 1993). NDVI was also used in crop discrimination in Northern China (Mingwei, et al., 2008). Maize and cotton fields were discriminated using MODIS derived NDVI and results were well correlated with statistical data at regional spatial scales. The Enhanced Vegetation Index (EVI), an improved index that accounts for soil reflectance, was rarely assessed in literature. EVI has similar potential as NDVI in estimating yield of many crops (corn, wheat, alfalfa, sorghum, soybeans) (Wardlow, Egbert, & Kastens, 2007). EVI was also used in the estimation of wheat area in China (Pan, et al., 2012). The Moderate Resolution Imaging Spectroradiometer (MODIS) produces both EVI and NDVI in addition to the primary production parameters such as the Gross Primary Production (GPP), Net Primary Production (NPP) and Net Photosynthesis (net PSN). Data acquired from MODIS
allow an accurate monitoring of crop due to its frequent acquisitions of remote sensing data and the rapid availability of data over large regions (Running, et al., 2004; Zhao, Heinsch, Nemani, & Running, 2004). MODIS GPP is the result of combining MODIS data with meteorological inputs in a plant growth algorithm. Few studies had used this parameter in yield estimation. Reeves et al. (2005) converted GPP to biomass through a conversion equation of carbon to yield. This conversion was sufficiently accurate at state level but not at county level nor at climate district.
In this paper a methodology is introduced for summer crop-yield prediction using MODIS vegetation and productivity indices. The remote sensing algorithm capitalizes on MODIS historical archive of these indices. The study is useful in conflict affected areas where reported data are unavailable or discrepant, or where access to agricultural areas is not possible due to security situations. Summer crop production in selected governorates of Syria was estimated from MODIS derived indices (GPP, net PSN and EVI). Regression models were built during pre-conflict years (2000-2011) and simulated during years of conflict (2012-2013).
2. METHODOLOGY 2.1 Study area
The conflict affected country of Syria is chosen as a case study. Syria produces 3.3 million tons of crops and vegetables in summer season. The vast majority of summer production relies on irrigation (from wells, rivers, and governmental irrigation projects). Most of irrigated land is located around Euphrates and Orontes River and their streams. Cotton is the most important summer crop. Syria is ranked by FAO as the 10th in the world in cotton production. The annual average production of cotton in the last decade amounts to 740,000 tons equivalent to 3.75 tons/ha. The north-eastern region of Syria (Al-Hassake, Deir-Ezzor, Al-Raqqa and Aleppo) is reputed in cotton and The International Archives of the Photogrammetry, Remote Sensing and Spatial Information Sciences, Volume XL-7/W3, 2015
36th International Symposium on Remote Sensing of Environment, 11–15 May 2015, Berlin, Germany
This contribution has been peer-reviewed.
maize culture in summer. The other governorates produce in summer mainly vegetables, in addition to cotton and tobacco. Winter and spring agricultural production is not within the scope of this study.
2.2 Data analysis
Three remotely sensed parameters were analyzed and compared to administrative statistics. The Gross Primary Production (GPP), Net Photosynthesis (net PSN) and Enhanced Vegetation Index (EVI) were extracted from MODIS datasets published by NASA and improved by the Numerical Terradynamic Simulation Group (NTSG) at the University of Montana. Those datasets are available from 2000 until present, on monthly and yearly basis, at 1-km spatial resolution (NASA LPDAAC, 2014; NTSG, 2014). The photo-synthetically active radiation (PAR), meteorological data, the estimated growth and maintenance respiration are the main parameters to obtain primary production. The EVI is an improved form of NDVI (Normalized Difference Vegetation Index) where vegetation conditions are compared in a spatio-temporal horizon. EVI is defined as per equation (1).
��� = � × ����−��
����+ � ×�� −� ×���� +� (1)
Where ρ are atmospherically corrected or partially atmosphere corrected surface reflectance, L is the canopy background adjustment that addresses nonlinear, differential NIR and red radiant transfer through a canopy, and C1, C2 are the coefficients of the aerosol resistance term, which uses the blue band to correct for aerosol influences in the red band (Huete, et al., 2002).
Delineation of summer irrigated lands was relatively easy using the EVI. The EVI gives a good first approach to these lands. The mean (2000-2011) summer EVI raster was used to delineate summer irrigated lands. The resulting shape file was then compared with high resolution Google Earth imagery available for the summer seasons between 2000 and 2011, and fine-tuned where necessary. The delineated irrigated lands were comparable with the average of total irrigated lands stated by the MOAAR over the period 2000-2011 in each political unit. The statistical department in the Syrian Ministry of Agriculture and Agrarian Reform (MOAAR) published, since 2000, annual reports about summer crops and vegetables production and areas in all Syrian governorates (Ministry of Agriculture & summer EVI were obtained in the irrigated lands of each Syrian governorate. Linear regression was applied to relate summer crop production and remotely sensed indices in all governorates during the pre-conflict period (2000-2011). An F-test statistic was used to assess the significance of the linear regression parameters. The significance of analysis was evaluated using F-statistics at p < 0.05. The derived relationships were simulated to estimate the summer crop production during conflict years (2012-2013).
To evaluate the spatial variation of production, the standardized summer EVI was calculated pixel-by-pixel as in equation (2).
����
�=
�����−����̅̅̅̅̅ (2)Where ����� is the standardized EVI in year i; EVIi is the sum
of summer EVI in year i; ���̅̅̅̅̅ is the mean of summer EVI in n years; Sn is the standard deviation of summer EVI in n years
Pixel-by-pixel statistics were derived from multiple rasters. The spatial mean and spatial standard deviation of EVI were calculated for the period of record 2001 and 2011. The spatial summer SEVI was derived by applying the Equation 1 on a cell-by-cell basis using a GIS-based raster calculator.
3. RESULTS AND DISCUSSIONS
The regression was significant where cotton and vegetables were highly produced. Cotton is produced in Al-Hassake (85%), Al-Raqqa (64%), Ghab (52%), Deir-Ezzor (49%), and Aleppo (42%). More than the half of production in Hama, Dar’a and Homs is of vegetables.
Summer EVI was regressed against summer crops (r2 > 0.5) in major irrigated lands (Hama, Ghab, Homs, Al-Hassake, Deir-Ezzor and Al-Raqqa) with high significance. The regression was noticed to be significantly negative in Deir-Ezzor and Al-Raqqa. The agricultural lands of the latter governorates surround Euphrates River within a narrow strip in a hyper-arid landscape. The second major crop in these governorates is maize. Summer GPP was a significant estimator of summer crops in Hama, Al-Hassake, Deir-Ezzor, Ghab and Dar’a. Summer crops can be predicted from net PSN in four governorates (Hama, Ghab area within Hama, Al-Hassake and Dar’a) but with less significance than the other parameters.
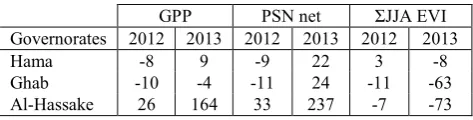
GPP PSN net ΣJJA EVI
Governorates 2012 2013 2012 2013 2012 2013
Hama -8 9 -9 22 3 -8
Ghab -10 -4 -11 24 -11 -63
Al-Hassake 26 164 33 237 -7 -73
Table 1- Deviation of predicted total summer yield from reported (%) for conflict years of 2012 and 2013
Following examination of significant relationships between summer crops and summer EVI, GPP and net PSN, regression models were derived for the period 2000-2011 and tested over the period 2012-2013. Table 1 show the deviation of predicted summer yield from reported during conflict years 2012-2013. The EVI based model performed well in 2012 in Hama, Ghab, Al-Hassake and Al-Raqqa. In 2013, the regression model did not conform well to the reported crop yields, with the exception of Hama governorate where the major crops are cotton and vegetables. Hama also is almost entirely under full government control. In governorates were maize was planted, no significant relationship between the tested indices and crop yield could be derived. It was noted that summer EVI was inversely correlated with netPSN is such areas (cotton and maize). It is well-worth noting that reported yield cannot be verified, as many of the areas are combat grounds, and hence the reliability of reported yields by the Syrian government in such areas is questionable. For example, heavy battles occurred in the Deir-Ezzor and Al-The International Archives of the Photogrammetry, Remote Sensing and Spatial Information Sciences, Volume XL-7/W3, 2015
36th International Symposium on Remote Sensing of Environment, 11–15 May 2015, Berlin, Germany
This contribution has been peer-reviewed.
Raqqa governorates during 2012 and 2013. This may have prevented the government employees to access farmers’ lands to conduct farm surveys and/or to collect crop yields.
Two main reasons could be arbitrated: 1) the unreliability of government reported data in conflict years (Endowment, 2014); 2) the sharp drop in production due to damages in irrigation systems and farmers displacement (Swiss Agency for Development and Cooperation SADC, 2014).
Figure 1- Time series of reported and simulated summer crop yields for Hama governorate (2000-2013).
Figure 2- Time series of reported and simulated summer crop yields for Al-Hassake governorate (2000-2013).
To compare different models, the work focuses on two governorates: Hama (vegetables main producer) and Al-Hassake (cotton main producer). Figure 1 and 2 illustrates the time series of reported and simulated summer crops and vegetables production in Hama and Al-Hassake. In both governorates, a rise in production is noticed between 2000 and 2004 where irrigation projects were enhanced (Hole & Smith, 2012). Since 2006, Syria had faced a severe drought that contributed to water shortages allowing for decreasing irrigated lands and a decrease in production (FAO, 2009). In 2011, the production slightly increased. The Syrian conflict started in 2011, and peaked during 2012 and 2013 where a decline in production is noticed both from reported yield and from cumulative summer EVI. The EVI predictor fits well the reported production in Hama most years, with less than 20% of error. In Al-Hassake, more fluctuations were observed. Models underestimated the high production in 2004 (-30%).The more suitable model during crisis years is the EVI model.
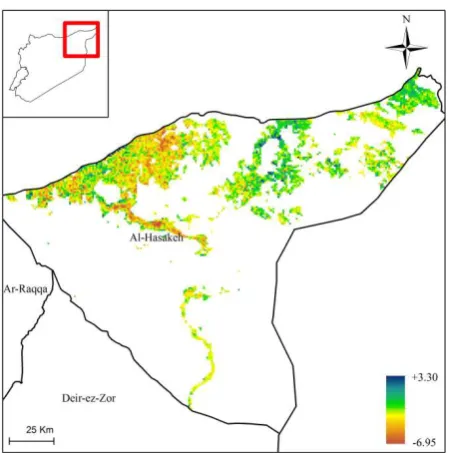
To evaluate the spatial variation of production, the SEVI was calculated pixel-by-pixel. Figure 3 and 4 shows the summer SEVI of 2012 against the mean and the standard deviation of pre-conflict years (2001-2011). Most regions in Hama and Al-Hassake faced a drop in EVI during 2012. Interior irrigated lands in Hama was not affected in 2012 nor the western regions. Ghab plain faced a significant drop of summer EVI in 2012. In the Kurdish area, northeastern Al-Hassake, summer EVI was similar to pre-conflict years. In other regions, summer SEVI was significantly less than before crisis.
Figure 3- Standardized cumulative summer EVI for 2012 Hama.
Figure 4- Standardized cumulative summer EVI for 2012 in Al-Hassake.
4. CONCLUSION
The analysis of MODIS-derived EVI and primary production indices indicate a high correlation with reported summer yield The International Archives of the Photogrammetry, Remote Sensing and Spatial Information Sciences, Volume XL-7/W3, 2015
36th International Symposium on Remote Sensing of Environment, 11–15 May 2015, Berlin, Germany
This contribution has been peer-reviewed.
in major irrigated agriculture in the pilot area within Syria. Simple regression spatially-based models were developed to predict summer crop production, found mostly effective for predicting cotton yields and vegetables. The regression models can be used as an indicator to predict summer crop yields during conflict years, and are able to show incidents were reported data could be questionable. Cumulative summer EVI-based model was the most effective among other parameters in predicting summer yields. The approach can contribute to an early diagnosis of food shortages and help decision makers’ to focus relief efforts, especially in wars and periods of drought.
5. REFERENCES
Domenikiotis, C., Spiliotopoulos, M., Tsiros, E., & Dalezios, N. (2004). Early cotton yield assessment by the use of the NOAA/AVHRR derived Vegetation Condition Index (VCI) in Greece. International Journal of Remote Sensing, 25, 2807-2819.
Endowment, C. (2014, April 18). Drought, Corruption, and
War: Syria’s Agricultural Crisis. Retrieved from Syrian
Economic Forum: http://www.syrianef.org/En/?p=3361
FAO. (2009). FAO’s role in the Syria drought response plan. Damascus, Syria: Food and Agriculture Organization of the United Nations (FAO).
Hole, F., & Smith, R. (2012). Arid land agriculture in northeastern Syria. Land Change Science, 213-226. doi:10.1007/978-1-4020-2562-4
Huete, A., Didan, K., Miura, T., Rodriguez, E. P., Gao, X., & Ferreira, L. G. (2002). Overview of the radiometric and biophysical performance of the MODIS vegetation indices. Remote Sensing of ENvironment, 83, 195-213.
Jones, H. G., & Vaughan, R. A. (2010). Remote sensing of vegetation. New York: Oxford University Press Inc.
Mingwei, Z., Qingbo, Z., Zhongxin, C., Jia, L., Yong, Z., & Chongfa, C. (2008). Crop discrimination in Northern China with double cropping systems using Fourier analysis of time-series MODIS data. International Journal of Applied Earth Observation and Geoinformation, 10, 476-485.
Ministry of Agriculture & Agrarian Reform in Syria. (2014). Statistical datasets. Retrieved from http://moaar.gov.sy
Mkhabela, M. S., Mkhabela, M. S., & Mashinini, N. N. (2005). Early maize yield forecasting in the four agro-ecological regions of Swaziland using NDVI data derived from NOAA’s -AVHRR. Agricultural and Forest Meteorology(129), 1-9.
NASA LPDAAC. (2014). NASA Land Processes Distributed Active Archive Center (LP DAAC), USGS/Earth Resources Observation and Science (EROS) Center. Retrieved from https://lpdaac.usgs.gov/products
NTSG. (2014). Modis Proucts. Retrieved from the Numerical
Terradynamic Simulation Group:
http://www.ntsg.umt.edu/project/mod17
Pan, Y., Li, L., Zhang, J., Liang, S., Zhu, X., & Sulla-Menashe, D. (2012). Winter wheat area estimation from MODIS-EVI time series data using the Crop Proportion Phenology Index. Remote Sensing of Environment, 119, 232-242.
Quarmby, N. A., Milnes, M., Hindle, T. L., & Silleos, N. (1993). The use of mutli-temporal NDVI measurements from AVHRR data for crop yield estimation and prediction. International Journal of Remote Sensing, 14, 199-210.
Reeves, M. C., Zhao, M., & Running, W. (2005). Usefulness and limits of MODIS GPP for estimating wheat yield. International journal of remote sensing, 26(7), 1403-1421.
Running, S. W., Nemani, R. R., Heinsch, F. A., Zhao, M., Reeves, M., & Hashimoto, H. (2004). A continuous satellite-derived measure of global terrestial primary production. BioScience, 547-560.
Swiss Agency for Development and Cooperation SADC. (2014). Syria: The imapct of the conflict on population diplacement, water and agriculture in the Orontes River basin. Geneva: Swiss Agency for Development and Cooperation SDC.
Wardlow, B. D., Egbert, S. L., & Kastens, J. H. (2007). Analysis of time-series MODIS 250 m vegetation index data for crop classification in the U.S. Central Great Plains. Remote Sensing of Environment, 290-310.
Zhao, M., Heinsch, F. A., Nemani, R. R., & Running, S. W. (2004). Improvements of the MODIS terrestrial gross and net primary production global dataset. Remote Sensing of Environment, 164-176.
The International Archives of the Photogrammetry, Remote Sensing and Spatial Information Sciences, Volume XL-7/W3, 2015 36th International Symposium on Remote Sensing of Environment, 11–15 May 2015, Berlin, Germany
This contribution has been peer-reviewed.