With Geospatial in the Path of Smart City
A.S. Homainejad
Independent Research Group on Geospatial, Tehran, I.R. Iran, [email protected]
Commission VI, WG VI/4
KEY WORDS: Smart City, Geospatial, Sustainable Transport, Intelligent Transport System
ABSTRACT:
With growth of urbanisation, there is a requirement for using the leverage of smart city in city management. The core of smart city is Information and Communication Technologies (ICT), and one of its elements is smart transport which includes sustainable transport and Intelligent Transport Systems (ITS). Cities and especially megacities are facing urgent transport challenge in traffic management. Geospatial can provide reliable tools for monitoring and coordinating traffic. In this paper a method for monitoring and managing the ongoing traffic in roads using aerial images and CCTV will be addressed. In this method, the road network was initially extracted and geo-referenced and captured in a 3D model. The aim is to detect and geo-referenced any vehicles on the road from images in order to assess the density and the volume of vehicles on the roads. If a traffic jam was recognised from the images, an alternative route would be suggested for easing the traffic jam. In a separate test, a road network was replicated in the computer and a simulated traffic was implemented in order to assess the traffic management during a pick time using this method.
1. INTRODUCTION
The world population has passed seven billion at the end of 2011 according to a report from the United Nation (UN 2012), which shows the proportion of the population living in cities and towns are more than 50%, in comparison with rural population. Urbanisation is growing very fast and every day more people from rural areas are choosing cities for inhabitant. For example, it is predicted that within next few years, only in China, more than 300 million people will migrate to cities (Larson 2012). This growth is the reaction of the expansion of industries; however, this growth is necessary for transferring from low-income rural areas to middle and high-income countries (Annez and Buckley 2009). Indeed, the productivity of urban areas is 4 to 5 times more than rural areas, and Gross Domestic Product (GDP) of megacities are more than 50% of their countries. According to a report given by European Association of National Metrology Institutes (EURAMET), a group of 40 megacities around the globe so called C40, with 300 million people inhabiting within them, generate 18% of global GDP and 10% of global emissions. On the other hand, cities and especially megacities are facing enormous challenges, such as increased population, polarised economic growth, green gas emission, and decreasing budgets (Falconer and Mitchell 2012). The issues such as land shortages, transportation, education, health, food, water, and power supply, also have to be added to the above issues as well. This accelerated change, signals us to adopt policies for sustainable urbanisation. There is actually, a dual relationship between economic growth and urbanisation. Cities and megacities are facing issues related to the above, which echo in both politicians and residents’ domain. Among other issues, transport was in the top of agenda of megacities’ lord mayors (Siemens AG 2007) because; transport is enabling us to engage in a wide range of daily activity. Also, transport is central to current necessary considerations around environmental sustainability, city planning and development. It is important to note that the transport sector around the globe generate 300 million tonnes of CO2 emission per year, therefore, megacities needs to find a
solution for reduction of this amount of emission and improving the transport efficiency. Falconer and Mitchell (2012) stated that the above issues can be resolved with adopting smart city fundamentals. Basically, urban performance is dependent on the
current traffic systems. Houghton et al. (2009) mentioned a number of solutions to the challenges which each country has placed in consideration to its transport requirements. For example, Western European countries are considering the utilisation of a new generation of GPS-based systems integrated into public transport for using in a national, metropolitan, and regional level. Asia-Pacific countries are focusing on innovation of an advanced public transport system, including integrating fare systems and traveller information systems. North America is also considering the incorporation of tax, to generate revenue from fuel and highway use, which improves both roads and highway infrastructure along with public transport infrastructure. A city with traffic sustainability is a city which has an efficient traffic system, with minimum environmental impact; therefore, the focus of this paper is on explaining a proposal that create a platform for using Geospatial technology, which helps to establish sustainable and Intelligent Transport Systems (ITS) applicable in smart cities. According to the above introduction, an approach has been proposed for monitoring the traffic flow on the roads which assist traffic management. This paper is organised in the following. The proposal will be addressed in the next section followed by an explanation and analysis on experiments with the implementation of the approaches that will be given in the section three. Finally the conclusion will be given in the section four.
2. PROPOSAL parts. The first part was designed to detect vehicles on the roads from the sequence images. The result from the first part will be helped to estimate the volume and the density of the vehicles on the roads that it will be used for recognising any traffic obstacle. The second part was designed to assist the vehicles to exit a traffic jam with defining a detour and to guide the other vehicles which are approaching the traffic jam, to use the alternative route. An initialisation is required to carry out prior to implementing the first part. Firstly, the road networks from aerial images and the laser scanner images will be acquired, and then the road network will be captured in a 3D space for creating a 3D model. With creating a 3D model from the roads, the road network will be geo-referenced. For achieving best be geo-referenced; therefore, the position of each individual
vehicle will be available. This information can be used for estimating the volume the vehicles on the road as well as the volume of the vehicles on any particular lane. For implementing the second part, the road network was replicated in the computer and a simulated traffic was carried out. In this stage, the simulator will increase the volume of the vehicles in the roads and will create a traffic jam. The scenario is to create a traffic jam in a part of the road for evaluating the system’s respond to the traffic obstacle and also its ability for defining a detour for motorists in order to exit the escalation. Indeed, the volume of the vehicles on the road will be estimated constantly and if the volume is more than a defined criterion within a timeframe, a detour will be defined for leading the vehicle out of the traffic jam, and also to guide the oncoming vehicle to an alternative route. In this project, the intersections of main roads were considered as the high traffic attentive, since the traffic flow in the main roads is merging in these points. Furthermore it was designed that the program to be able to calculate the volume of the vehicle on the roads and each lane separately; therefore, the traffic obstacle can be easily recognised.
3. EXPERIMENTS
This section is discussing the experiments with extracting vehicles from aerial images and simulated approach. Later the combination of two approaches could be employed for monitoring and managing the traffic controlling. The first group of tests have been carried out for detecting and extracting vehicles on the roads from aerial images, and the second group of the tests have been implanted based on the computer traffic simulation on replicated road network.
3.1 Experiment with Extracting Vehicles from Aerial Image
The aspect in this experiment, in general, is to extract vehicles from aerial images using comparison with a defined image, but in fact the specific aspect is to extract vehicles from any particular road’s lane. The process of vehicle extraction from aerial images follows following steps. In step one; an image was defined as source image. The source image was initialised and all vehicles on the roads were removed using image processing methods. In the step two, the target images will be oriented with the source image, and in the third step, the target images will be registered on the source image and the vehicles will be extracted using comparison method. The aim is the source image shows has to very close to the centre of image.
Recognising a vehicle from an aerial digital image was a big challenge in this project, since the diversity of colour of vehicles and background reflected in the result. In the image processing usually a colour image will be converted to greyscale prior to object detection, and then a segmentation approach will be carried out. However, there are a number of object segmentation approaches which have been carried out on colour images such as those approaches were implemented by Song el al. (2002), Durucan and Ebrahimi (2003), and Rotaru et al. (2005).
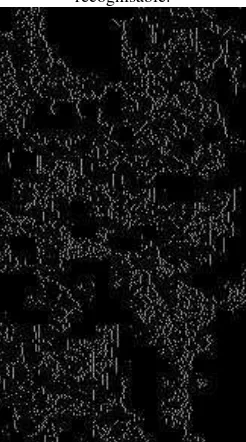
compared and analysed. The original image and the results from the both segmentations have been presented in Figures 1, 2, and 3. Figure 1 illustrates a part of aerial image from a residential area which includes buildings and road network. The study area (Figure 1) was carefully chosen because some parts of the roads were under shadow and will reflect on the output. Figures 2 and 3 illustrate the outline of segmentation from aerial images after the image was converted to greyscale. With investigation the output, it can be understood that the vehicles are hardly recognisable from background in Figure 2. Therefore, a threshold has been applied to the output for removing the background for improving the output, but still there is no any significant improvement in output and the vehicles cannot be recognised as Figure 3 shows. The result from segmentation on colour image is very similar to greyscale image. Figure 4 illustrates the output of image segmentation on a colour image using a modified Rober method. As it can be seen the vehicles are recognisable but still more image processing is required to extract vehicles.
The image on Figure 1 has been selected for source image. An initialisation has been done on the source image prior to vehicle detection. All vehicles on the roads that captured in the image have been erased using image processing techniques. Then an intensity-based matching process was implemented in order to find the correspondence points on the source and target images. The extracted points were used for orientating the target image with the source image. Then the target image was registered on the source image. The vehicles on the particular parts of the roads were detected and extracted using comparison approach. Figure 5 shows the result after registering the target image on the source image. Only three particular lanes of the roads from target image were registered on the source image and the vehicles in these parts were extracted. In the first part a vehicle is crossing an intersection. The second part shows a number of vehicles were parked on the side of the road, and the third part shows the vehicles on the south- north band of the road. Two important issues were distinguished after investigating the result. The first issue is that the algorithm cannot recognise the parked vehicles from mobile vehicles, because only a few images from the area were available. This issue can be resolved if a sequence images was available. The second issue was the shadows of the vehicles on the south-north band that reflected on the result. In this situation, the algorithm mistakenly recognised two vehicles next to each other. This issue is clearly shown in Figure 6. Figure 6a shows a few vehicles on the south-north band the road that their shadows lied on the west side of the vehicles. The algorithm cannot distinguish the shadow from the vehicle. As a result, this issue will reflect to estimation of volume of vehicles on the road. This issue cannot be resolved with filtering approach because the filter will remove some parts of the other vehicles as well. Figure 6b shows the result after applying a filter on the target image. The figure clearly shows that applying filter didn’t resolve the issue but also some parts of other vehicles were erased. This issue could be resolved only with using a smarter filtering approach. In this case it needs to increase the parameters of initialisation, for example the time and date of imagery, or atmospheric condition at the time of imagery can help to improve the output.
In this project the roads, buildings, trees, and landscape were individually extracted for creating a 3D model as Homainejad (2013 and 2012) explained. Then the extracted vehicles will be registered on the 3D model for geo-referencing.
Figure 1. This figure depicts the test area captured in aerial image.
Figure 2. This figure shows the outline of image segmentation on the original image after converting the original image to greyscale. The area in the yellow box is part of road that is in the shadow. As it can be seen the vehicle in the shadow is not
recognisable.
Figure 3. This figure depicts another outline from image segmentation on the original image after converting the original
Figure 4. This figure depicts the output of colour image segmentation. The output is much better, but still some vehicles in shadow are not properly recognisable.
Figure 6a. This is the result after applying filtering on the image. The algorithm couldn’t distinguish between the vehicle and its shadow.
Figure 6B. This Figure shows the result after filtering above Figure, and the algorithm still couldn’t distinguish between the vehicle and its shadow.
3.2 Experiment with Traffic Simulation
The tests were undertaken under a scenario, which was designed based on an assumption that a traffic jam has been acquired in an intersection. At the time all roads are under monitoring of CCTV and sequence of images is transferring to the control room. The images have been processed to detect and analyse the
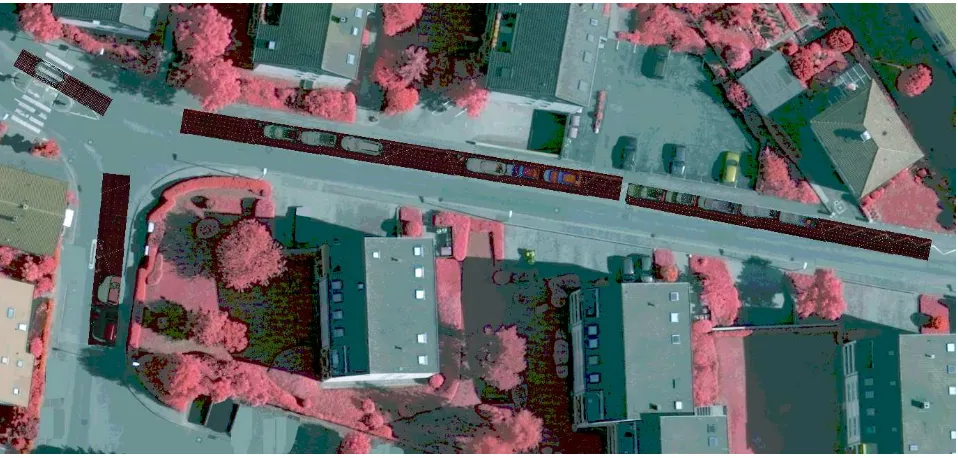
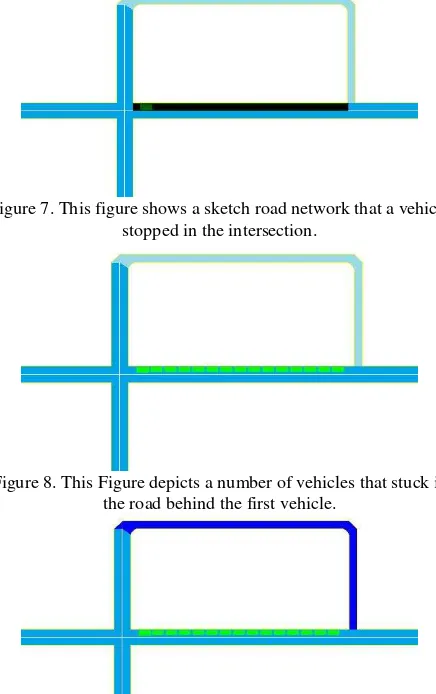
The entrance and the departure are two sequence intersections. The volume of traffic flow in each lane between the entrance and departure gates is constantly calculated. Therefore, the volume of the vehicle is constantly updated based on the number of vehicles move in and out the lane. It was assumed that the detour would be defined when the volume of the vehicle on the road was more than 45%. Since, in this project each lane of multilane roads was extracted and captured in a 3D model separately, therefore, the volume of traffic flow for each lane can be calculated separately. The advantage of this method is to have the volume of traffic flow in each lane as well as the total density of the roads. Each main intersection is considered as arrival and departure for vehicle; therefore, the ration of vehicle arrive from an intersection to vehicle depart from opposite intersection within a defined time has to be calculated. The process of this scenario has been illustrated in Figures 7, 8, and 9.Figure 7 illustrates a vehicle was stopped in an intersection and Figure 8 shows the traffic is escalated behind the stoped vehicle. Then a detour is defined to lead the ongoing vehicles to avoid of this escalation as it shows in Figure 9. The result from implementation of this scenario in computer was very successful. The algorithm was able to recognise the traffic flow and defined a detour; however, this algorithm has to be tested under real data in real time to assess the ability of the algorithm when any unexpected issues have been occurred.
Figure 7. This figure shows a sketch road network that a vehicle stopped in the intersection.
Figure 8. This Figure depicts a number of vehicles that stuck in the road behind the first vehicle.
Figure 9. This figure shows a detour that was defined after the traffic jam was recognised. The detour can be used for leading ongoing traffic to escape the traffic jam.
4. CONCLUSION
The concept of smart transportation systems is expected to become critical in addressing the challenges posed by an increasing number of megacities in both developed and developing regions in maintaining safety, smooth traffic flow, and an environmentally friendly and sustainable urban environment. This paper explained application of Geospatial in smart transport that mostly focused on the monitoring and analysing the ongoing traffic in road network for improving transport efficiency and providing an advanced system for preventing accidents and traffic jams. Two different tests were carried out.
The first test was carried out in order to detect the vehicles from aerial images and to register the vehicles on a 3D model. An aerial image from a residential region has been selected for implementing the proposal. The roads have had a mild traffic at the time of image acquisition. An orientation was initially fulfilled. The target image was registered on the image and the vehicles on defined parts of the road were detected and extracted using comparisons approach. Some issues reflected on the result. From aerial image the parked vehicles couldn’t be recognised from mobile vehicles. Also vehicles’ shadows couldn’t be distinguished. The first issue can be resolved if a sequence of images were available, and the second issue can be fixed if a smarter approach in image processing has been implemented.
Carney, N., 2013 b, Cell Phones, Bos Lines, and Privacy in Côte d’Ivoire, DATA-SMART CITY SOLUTION, http://datasmart.ash.harvard.edu/news/article/cell-phones-bus-lines-and-privacy-in-cote-divoire-243
Durucan, E., Ebrahimi, T., (2003), Moving Object Detection Between Multiple and Color Images, Proceeding of IEEE Conference on Advanced Video and Signal Based Surveillance, 243-251
Falconer, G., Mitchell, S., 2012, Smart City Framework, A Systematic Process for Enabling Smart+Connected
Communities, CISCO,
http://www.cisco.com/web/about/ac79/docs/ps/motm/Smart-City-Framework.pdf
Fritzsche, H.T., Daimler-Benz AG, 1994, A Model for Traffic Simulation, Traffic Engineering & Control, 317-321
Goldsmiths, S., 2013, Getting Data in Gear, DATA-SMART
CITY SOLUTION,
http://datasmart.ash.harvard.edu/news/article/getting-data-in-gear-165
Hao, L., Lei, X., Yan, Z., ChunLi, Y., 2012, The Application and Implementation of Research Smart of City in China, International Conference on System Science and Engineering, Dalian, China, 288-292
Homainejad, A.S., 2013, A Mobile Mapping Approach for Disaster Management, Asian Journal of Environment and Disaster Management, Vol. 5, Issue 2, 177-190, 201
Homainejad, A.S., 2012, An Innovation Approach for Developing a 3D Model by Registering a Mono Image on a DTM, ISPRS Archives, Volume XXXIX-B4, 189-194
Houghton, J., Reiners, J., Lim, C., 2009, Inteligent Transport: How Cities Can Improve Mobility, IBM Global Business Service http://www-935.ibm.com/services/us/gbs/bus/html/gbs-intelligent-transport-mobility.html
Lall, A., Yew, L.K., 2010, ICT for City Management, Using Information and Communications Technology to enable, engage, and empower city stakeholder, A research project conducted by Economist Intelligence Unit, http://www.economistinsights.com/sites/default/files/Siemens_ Reports_2010_FINAL%20TO%20PRINT.pdf
Larson, K., 2012, Brilliants Design to Fit More People in Every
City, TEDXBOSTON 2012, ted.com
http://tedxtalks.ted.com/video/TEDxBostonKentLarsonRespons i;search%3Akent%20larson
Liyanage, C.P., Marasinghe, A., 2013, Planning Smart Meal in a Smart City for a Smart living, International Conference on Biometrics and Kansei Engineering, 166-171
Lymberis, A., 2005, Wearable Health Systems and Applications: The Contribution of Information & Communication Technologies, Proceedings of 27th Annual Conference of Engineering in Medicine and Biology, Shanghai, China, 4149-4152
Rotaru, C., Schipritt, J., Graft, T., Zhang, J., Buchwald, W.P., (2005), Accuracy Object Detection and Following in Color Images for Automotive Applications, Proceeding of International Conference on Information Acquisition, 570-575 Siemens AG, 2007, Solving Transport Issues has Highest Priority for Megacities, CITYMYOR DEVELOPMENT 16, http://www.citymayors.com/development/megacities.html Song, J., Cai, M., Lyu, M. R., 2002, Edge Color Distribution Transform: An Efficient Tool for Object Detection in Images, Proceedings of 16th International Conference on Pattern Recognition, Vol 1, 608-6011
Thornton, S., 2013, Chicago Release a New Datasets for a More Sustainable City, DATA-SMART CITY SOLUTION, http://datasmart.ash.harvard.edu/news/article/chicago-releases-new-datasets-for-a-more-sustainable-city-249