DETERMINATION OF RESIDENCE TIME DISTRIBUTION IN THIN
FILM SCRAPED SURFACE HEAT EXCHANGER USING
IMAGE ANALYSIS
1*
Ravi Prajapati, 2P.S. Minz, 3I.K. Sawhney and 4Piyush Lanjewar
1,4
Research Scholar, 2Scientist, 3Emeritus Scientist, Dairy Engineering Division,
ICAR - National Dairy Research Institute, Karnal Email: [email protected]
Abstract: Scraped surface heat exchangers are well established heating and cooling system for viscous and sticky products. Generally thin film has Scraped surface heat exchanger has short residence time compared to other heat exchangers which may be sometimes difficult to compute. In this study, a simple method for residence time distribution measurement was carried out using image analysis. Pulse input injection method was used to inoculate the tracer dye and colourimetric analysis of milk at SSHE outlet done by program developed in Scilab software. Mean residence time distribution for scraped surface heat exchanger was 41.46 s at 120 rpm scraper speed, 294 kPa steam pressure and 450 l/h milk feed rate. Determined RTD is helpful in context with thermal processing of milk in SSHE.
Keywords: Scraped surface heat exchanger, residence time distribution, milk, image analysis.
Introduction
Scraped surface heat exchangers are widely used for processing of highly viscous or sticky
fluids. In these heat exchangers, the product to be heated/cooled flows axially in an annular
section between a stationary outer cylinder and a powered coaxial rotor. The inner wall of the
outer cylinder is periodically scraped by blades attached to the rotor, while the heating or
cooling fluid circulates into the external jacket, which is generally equipped with flow baffles
[1]. SSHE have been used for number of applications like heating [2], cooling [3],
concentration [4], crystallization [5], low grade heat recovery [6] etc.
Residence time distribution is an important parameter to understand extent of thermal
treatment and flow behavior in a SSHE. An analysis of the experimental RTD data provides
valuable information about the fluid flow behavior, the degree of radial and axial dispersion,
and possible flow problems in the exchanger, such as stagnation or short-circuiting. It is
therefore important to perform a RTD study, complemented with temperature profile
measurements, in order to assess the influence of the operating conditions on the fluid flow
behavior and on the efficiency of the thermal treatment applied to the product [7]. Study of
residence time distribution (RTD) is required for design and the control of chemical
processes [8]. RTD measurements constitute an efficient tool that can help better understand
and determine different hydrodynamic parameters. The parameters identified allow for the
modeling of many processes [9].
The residence time distribution (RTD) can be easily obtained for all unit operations in a
continuous line with a tracer response experiment performed for each unit operation
separately and for the mechanically integrated line as well. In this testing, a pulse or step
change of tracer is added to the inlet of the continuous equipment being characterized, and
the response of the tracer concentration profile at the outlet is measured. The concentration
measurements can be recorded using online spectroscopy, or samples can be collected for
off-line measurement. In either case, it is important that the tracer concentration be readily
measureable by an analytical technique. Additionally, the presence of the tracer should not
impact the flow properties of the bulk material for which the RTD measurements are being
taken, because the RTD is highly dependent on the flow behavior of the material within the
apparatus. Any significant changes to the flow behavior will cause the measured RTD not to
be representative of the material [10].
There are number of methods used to determine residence time distribution. Dye tracer
method is mostly commonly used method for residence time studies [11, 12, 13, 14]. RTD in
a one-stage impinging streams reactor was investigated using coloured solution as the tracer
and samples were analyzed by an UV–vis spectrophotometer to determine the concentration
of the dye [15]. Method based on visible-near infrared spectroscopy using a fiber optic probe
inserted in the extruder die to measure the concentration of red dye was studied [16]. Another
popular method is use of salt or ionic compound as tracer and RTD is determined using
electrical conductivity [17, 18]. RTD was indirectly computed by measuring magnetic
susceptibility using iron powder as tracer [19]. Among all available method, colourimetric
method is the most easy method to implement in heat exchangers for RTD measurement. In
the present study effort was made to determine RTD of SSHE using image analysis.
Material and methods
Scraped surface heat exchanger
Experiments were carried out using a Scraped surface heat exchanger jacketed with mild steel
having four SS blades (two for scraping and two for conveying) and cylinder diameter 340
milk. Scraper was coupled with geared motor. To regulate the speed of scraper the motor was
controlled using a variable frequency drive (Model: VLT Microdrive, Danfoss Drives Pvt.
Ltd.). SSHE was provided with vapour vent, vapour vent cock, steam trap, pressure gauge, air
vent and safety valve. The parameters were kept constant includes rotational speed of scraper
and feed rate.
Standardization of dye solution
Tracer dye solution was prepared by adding 10 g of mixed dye sunset yellow FCF (Disodium
6-hydroxy-5-[(4-sulfophenyl) azo]-2-naphthalenesulfonate) and carmoisine (Di-sodium salt
of 2-(4 sulpho -1-naphthylazo_1-naphthol-4-sulphonic acid) in 1000 ml of distilled water.
Preliminary trials were conducted to determine the dye concentration required for visible
colour change. As shown in Figure 1. The different percentage of dye solution (1-10%) was added to milk and images were analyzed using computer vision system. Average CIE Lab
values were computed and colour difference (Δ E) was calculated using following equation:
∆ = − + − + − (1)
Where,
∆ = Colour difference
= L value for reference sample i.e. milk = L value for milk + dye sample = a value for reference sample i.e. milk = a value for milk + dye sample = b value for reference sample i.e. milk = b value for milk + dye sample
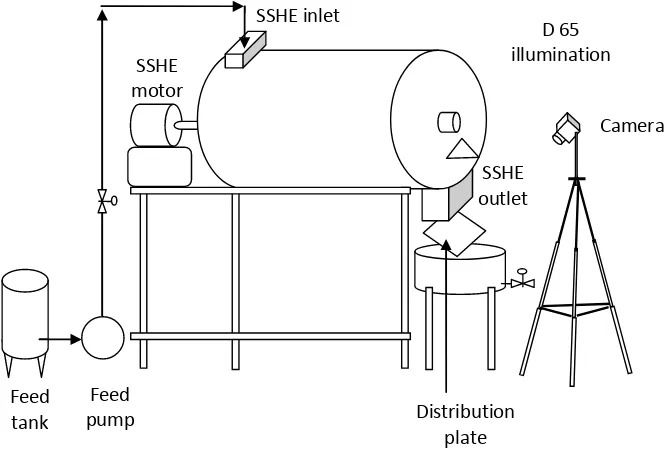
Image acquisition and analysis system
To take images of milk at SSHE, an inclined distribution plate was attached at the SSHE
outlet (Figure 2). The purpose of the distributor plate was to spread milk over the plate so that image of milk sample could be acquired. An LED (D65) light source was used to
illuminate the distributor plate. Camera was fixed at an angle normal to the distributor plate.
The video (mp4 format) was taken during the RTD experiment. The video was converted to
digital images (1 frame per second) using DVD Video software (Version: 5.0.59.525). The
digital images were processed using Scilab program to compute CIE Lab values.
Determination of RTD
Buffalo milk (6% fat and 9% SNF) was used as feed. Acidity of raw milk was 0.12% (lactic
acid). Thin film scraped surface heat exchanger was used for heating milk and was operated
in recirculation mode. The constant parameters during trials were scraper speed (120 rpm)
and milk flow rate (450 l/h). Tracer was injected after system achieved steady scraper speed
the inlet port. CIE a value was used to measure the concentration of tracer in SSHE [11, 20].
Plotting of graph and RTD calculation was done using program developed in MATLAB
R2016 trial version (MathWorks, Inc., MA, USA). The residence time distributions of
material in the SSHE is described by the E(t) curve that shows the variation of tracer
concentration at the exit and is given by:
= ∞ (2)
Mean residence time was computed as:
= ∞
(3)
Results and discussion
Standardization of dye solution
The standard curve was plotted to determine the exact quantity of tracer to be injected in the
pulse input method. The visible colour change is an indication of the concentration change of
tracer. Initially, the samples were placed on white background and colour (L*, a*, b*) was
measured to plot a standard curve. It was done to predict the exact quantity of tracer to be
injected during each step of operation. It was observed that 1% increase in the concentration
of tracer dye resulted in visible colour change. Upto 5% dye concentration colour change ΔE
value was more as compared to incremental increase in 6-10% dye concentration range.
Residence time distribution
The graphical representation of colour difference (∆E) versus time indicates visible change in
colour values at fixed interval of time 1 s (Figure 3). The graph shows chaotic trend which specifies that the colour difference changes initially from low to high and again low as
response to pulse injection of dye solution. Taking ∆E as parameter for computing RTD was
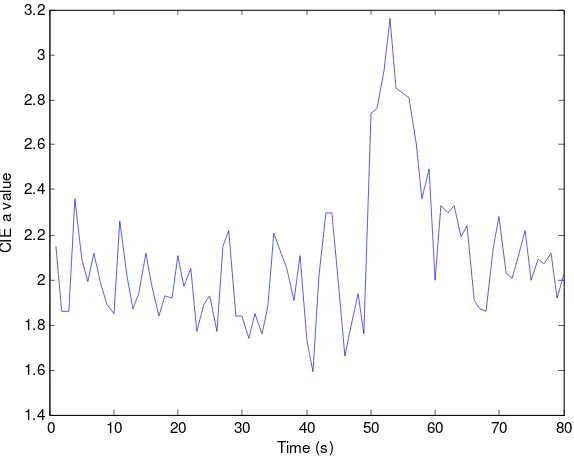
not feasible as definite RTD trend was not observed in ∆E - time plot. When inverted CIE a
value was plotted against time, a definite RTD trend was observed (Figure 4). Inverted CIE a colour value was observed near 53 seconds.
E(t) plot was different from conventional plots having a bell curve with tail end. There may
be number of reason for obtaining a non conventional E(t) plot for SSHE (Figure 5). One of the prime reasons could be high flow rate which resulted in short-circuiting and channelling
at the bottom of horizontal SSHE. Another reason could be use of two conveying blades
which immediately carries the milk from the inlet region towards the outlet of SSHE. Such
phenomena results in very short residence time of milk in the SSHE as compared to other
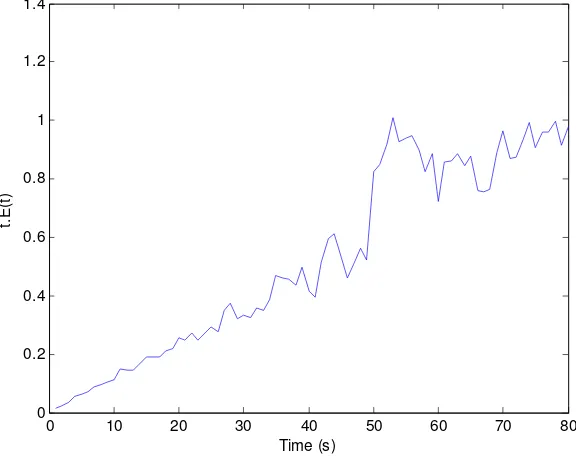
heat exchangers. The E(t) plot also indicates turbulent flow regime inside the SSHE. It Has
logarithmic trend for the extradites using laboratory extruder [20]. The mean residence time
of milk in SSHE was calculated as 41.46 s from the area under the tE(t)-time curve (Figure 6).
Conclusions
Rapid and simple imaging method for RTD measurement was established. RTD measurement
of SSHE gives information on the time spent by fluid particles in the apparatus and has been
obtained using a new method to detect the pulse response. The images were successfully
analyzed by the program developed in Scilab software and CIE Lab values were extracted.
The method was found less time consuming as compared to RTD determination by
concentration measurement using complex chemical analysis. Also this method does not alter
the flow properties of milk.
References
[1] Rainieri, S., Bozzoli, F., Cattani, L., & Vocale, P. (2014). Parameter estimation applied
to the heat transfer characterisation of Scraped Surface Heat Exchangers for food
applications. Journal of Food Engineering, 125, 147-156.
[2] Yataghene, M., & Legrand, J. (2013). A 3D-CFD model thermal analysis within a
scraped surface heat exchanger. Computers & Fluids, 71, 380-399.
[3] Dehkordi, K.S., Fazilati, M.A., & Hajatzadeh, A. (2015). Surface Scraped Heat
Exchanger for cooling Newtonian fluids and enhancing its heat transfer characteristics, a
review and a numerical approach. Applied Thermal Engineering, 87, 56-65.
[4] Kumawat, M., Kumar, B., & Minz, P.S. (2012). Optimization of process parameters for
manufacture of khoa using response surface methodology. Indian Journal of Dairy Science,
65(2), 106.
[5] Fayolle, F., Belhamri, R., & Flick, D. (2013). Residence time distribution measurements
and simulation of the flow pattern in a scraped surface heat exchanger during crystallisation
of ice cream. Journal of Food Engineering, 116(2), 390-397.
[6] Law, R., Harvey, A., & Reay, D. (2013). Opportunities for low-grade heat recovery in
the UK food processing industry. Applied Thermal Engineering, 53(2), 188-196.
[7] Arellano, M., Benkhelifa, H., Alvarez, G., & Flick, D. (2013). Experimental study and
modelling of the residence time distribution in a scraped surface heat exchanger during sorbet
freezing. Journal of Food Engineering, 117(1), 14-25.
[8] Le, P.P., (1998). Proce´de´ s de Transformation. Editions Technip, Institut Francais du
[9] Essadki, A.H., Gourich, B., Vial, C., & Delmas, H. (2011). Residence time distribution
measurements in an external-loop airlift reactor: Study of the hydrodynamics of the liquid
circulation induced by the hydrogen bubbles. Chemical engineering science, 66(14),
3125-3132.
[10] Engisch, W., & Muzzio, F. (2016). Using Residence Time Distributions (RTDs) to
Address the Traceability of Raw Materials in Continuous Pharmaceutical Manufacturing.
Journal of pharmaceutical innovation, 11(1), 64-81.
[11] Gogoi, B.K., & Yam, L.K. (1994). Relationship between residence time and process
variables in a corotating twin-screw extruder. Journal of Food Engineering, 21, 177–196.
[12] Nwabueze, T.U., & Iwe, M.O. (2010). Residence time distribution (RTD) in a single
screw extrusion of African breadfruit mixtures. Food and Bioprocess Technology, 3(1),
135-145.
[13] Hirth, M., Leiter, A., Beck, S.M., & Schuchmann, H.P. (2014). Effect of extrusion
cooking process parameters on the retention of bilberry anthocyanins in starch based food.
Journal of Food Engineering, 125, 139-146.
[14] Shinde, Y. H., Gudekar, A.S., Chavan, P.V., Pandit, A.B., & Joshi, J. B. (2016). Design
and development of energy efficient continuous cooking system. Journal of Food
Engineering, 168, 231-239.
[15] Fatourehchi, N., Sohrabi, M., Dabir, B., Royaee, S.J., & Malayeri, A.H. (2014).
Application of a novel type impinging streams reactor in solid–liquid enzyme reactions and
modeling of residence time distribution using GDB model. Enzyme and microbial
technology, 55, 14-20.
[16] Apruzzese, F., Pato, J., Balke, S.T., & Diosady, L.L. (2003). In-line measurement of
residence time distribution in a co-rotating twinscrew extruder. Food Research International,
36, 461–467.
[17] Hweij, K.A., & Azizi, F. (2015). Hydrodynamics and residence time distribution of
liquid flow in tubular reactors equipped with screen-type static mixers. Chemical Engineering
Journal, 279, 948-963.
[18] Sievers, D.A., Kuhn, E.M., Stickel, J.J., Tucker, M.P., & Wolfrum, E.J. (2016). Online
residence time distribution measurement of thermochemical biomass pretreatment reactors.
Chemical Engineering Science, 140, 330-336.
[19] Puaux, J.P., G. Bozga and A. Ainser, 2000, Residence time distribution in a corotating
[20] Kumar, A., Ganjyal, G.M., Jones, D.D., & Hanna, M.A. (2006). Digital image
processing for measurement of residence time distribution in a laboratory extruder. Journal of
Food Engineering, 75(2), 237-244.
Figure 1: Threshold value (ΔE) for colour change at different dye concentration
Figure 3: Change in colour difference (ΔE) with respect to time
Figure 4: Change in inverted CIE a* value with time
0 10 20 30 40 50 60 70 80
0 1 2 3 4 5 6
D
e
lt
a
E
Time (s)
0 10 20 30 40 50 60 70 80
1.4 1.6 1.8 2 2.2 2.4 2.6 2.8 3 3.2
Time (s)
C
IE
a
v
a
lu
Figure 5: E(t) curve representing variation of tracer concentration at exit
Figure 6: t.E(t) curve to calculate mean residence time
0 10 20 30 40 50 60 70 80
0.008 0.01 0.012 0.014 0.016 0.018 0.02
E
(t
)
Time (s)
0 10 20 30 40 50 60 70 80
0 0.2 0.4 0.6 0.8 1 1.2 1.4
Time (s)
t.
E
(t