Multi-Modal, Multi-Touch Interaction with Maps in Disaster
Management Applications
V. Paelke a, *, K. Nebe b, C. Geiger c, , F. Klompmaker d,, H. Fischer d,
a
Institut de Geomàtica, Castelldefels, Spain – Volker.paelke@ideg.es b
Rhine-Waal University of Applied Sciences, Kamp-Lintfort, Germany - Karsten.Nebe@hochschule-rhein-waal.de c
- geiger@fh-duesseldorf.de d
C-LAB, University of Paderborn, Paderborn, Germany - {florian.klompmaker; holger.fischer}@c-lab.de
KEY WORDS: Tabletop, Multitouch, Tangible Interaction, Disaster Control Management, Natural User Interfaces
ABSTRACT:
Multi-touch interaction has become popular in recent years and impressive advances in technology have been demonstrated, with the presentation of digital maps as a common presentation scenario. However, most existing systems are really technology demonstrators and have not been designed with real applications in mind. A critical factor in the management of disaster situations is the access to current and reliable data. New sensors and data acquisition platforms (e.g. satellites, UAVs, mobile sensor networks) have improved the supply of spatial data tremendously. However, in many cases this data is not well integrated into current crisis management systems and the capabilities to analyze and use it lag behind sensor capabilities. Therefore, it is essential to develop techniques that allow the effective organization, use and management of heterogeneous data from a wide variety of data sources.
Standard user interfaces are not well suited to provide this information to crisis managers. Especially in dynamic situations conventional cartographic displays and mouse based interaction techniques fail to address the need to review a situation rapidly and act on it as a team. The development of novel interaction techniques like multi-touch and tangible interaction in combination with large displays provides a promising base technology to provide crisis managers with an adequate overview of the situation and to share relevant information with other stakeholders in a collaborative setting. However, design expertise on the use of such techniques in interfaces for real-world applications is still very sparse. In this paper we report on interdisciplinary research with a user and application centric focus to establish real-world requirements, to design new multi-modal mapping interfaces, and to validate them in disaster management applications. Initial results show that tangible and pen-based interaction are well suited to provide an intuitive and visible way to control who is changing data in a multi-user command and control interface.
* Corresponding author. This is useful to know for communication with the appropriate person in cases with more than one author.
1. INTRODUCTION
To develop the essential design expertise with new multi-modal interaction and presentation techniques we have chosen a real application in which spatial data is shared and interacted upon by a group of people.
1.1 Application
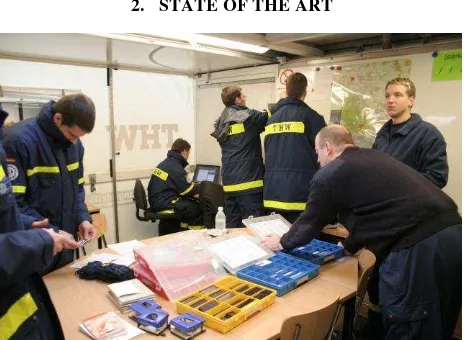
The selected application is a disaster management application that is studied in close collaboration with the German Federal Agency for Technical Relief (Technisches Hilfswerk/THW) (Fig.1).
Starting from user requirements we have applied a user centred design approach to develop new user interfaces that maximise the benefits of technologies like large-scale multi-touch displays. Because current base technologies for such interfaces are still in an early stage of development, and the limitations of currently available techniques can negatively impact the usability of the final application, the development of the required base technologies for multimodal interaction and visualization was considered as an integral part of the design and development process.
1.2 User centred approach
A user centred approach is essential to develop new user interfaces that realize the benefits of technologies like large-scale multi-touch displays in real-world applications.
Large-scale multi-touch tables have high potential to improve situation awareness and collaboration in time-critical multi-user applications. In our user centred design process, we use close collaboration with end users to establish requirements, to examine new concepts in data analysis and presentation and to validate the newly developed user interfaces.
With regards to user interface techniques, we are working both on the technology level and on the interface level. At the technology level we develop new multimodal interfaces, incorporating advanced techniques for interaction and information. At the interface level we provide interface solutions to real-world problems, specifically command and control interfaces with advanced multi-user capabilities.
To establish end-user requirements recurring interviews and workshops were conducted with disaster managers and technicians from THW and training exercises observed. These revealed a number of areas for potential improvements that could be addressed through multi-touch table interfaces. In an iterative process these were refined into application scenarios from which concrete requirements were then identified.
1.3 Goal
The overall goal is to improve the management of large-scale disaster situations and complex emergencies by providing crisis managers with an interactive mapping system that aims to improve their effectiveness. With digital map repositories and the proliferation of new sensors the problem of disaster managers increasingly changes from one where information is missing to one where the required information is too difficult to access and analyse.
2. STATE OF THE ART
Fig. 1: THW rescue workers using conventional management tools
2.1 Geo-Information in disaster management
A critical factor in the management of disaster situations is the access to current and reliable data (van Osterom et. al., 2005). Potential data sources that can be used in disaster management can be distinguished according to their platform and sensor – ranging from existing maps and aerial images over the use of mobile sensors with the rescue personal (e.g. for status monitoring) to dedicated sensor platforms – e.g. airborne or space borne sensors.
New sensors have many promising properties to capture the required data when and where required, e.g. in the case of SAR (synthetic aperture radar) geo-spatial data can be acquired irrespective of weather-conditions and visibility. Key challenge in data gathering and analysis are the control of such sensors, the real-time integration of the data and the automation of the data analysis where possible. The supply of spatial data for disaster management has been improved tremendously by new sensors (Video, SAR, LIDAR) and data acquisition platforms (satellites, UAVs). Satellite communications technology provides near-real-time access to pictures, videos, sensor data and other information worldwide. However, in many cases this is not well integrated into crisis management systems and often the capabilities to analyse and use the data lag behind the sensor capabilities.
In the management of disaster situations much of the relevant data is of spatial nature (environment, location of resources) and one key challenge is to effectively integrate and unify spatial
data from different sources. Geographic Information Systems (GIS) are well established to deal with the acquisition, storage, analysis and presentation of spatial data and commercial GIS are established tools in the management of crisis situations in many agencies. Central challenges arise in the user interface, the integration of data and the integration with other systems. While the integration of static data from different providers is addressed by initiatives like INSPIRE (Inspire, 2012), a special challenge remains due to the fact that the data required during disasters, and other dynamic environments, requires high bandwidth sensors at the time of use (or close to it) that is difficult to handle, analyse and represent. Especially in dynamic crisis situations conventional cartographic displays and standard mouse based interaction techniques fail to address the needs of crisis managers that need to review a situation and act on it as a team. Similarly, current GIS interfaces are not well adapted to u “ h ” – the extension of GIS with novel techniques for real-time data handling and advanced interaction techniques is required to make the available information accessible and useful to the different user groups.
2.2 Advanced interaction and visualization techniques
Planning for and managing large scale emergencies is a complex activity and a system for disasters control management processes presents a number of spatially related problems and an overwhelming quantity of information. One of the problems in disaster management is to get an overview of the situation and to share relevant information with others. Access to the relevant information is critical due to effective, collaborative decision-making during emergency management situations. However, standard user interfaces are not well suited for multiuser access. In the recent years multimodal interfaces have acquired an important role in human computer interaction applications, e.g. under the heading of natural user interfaces (NUI), sometimes referred to as reality-based interaction (Jakob et. al., 2008] and tangible interaction (Ishii, 2008).
While many benefits of NUI techniques have been demonstrated in research projects there are currently no established toolkits and design expertise on the use of such techniques in large scale interfaces for real-world applications.
2.3 The useTable
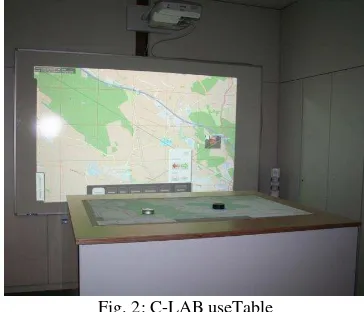
A representative example of emerging large-scale multi-touch interaction devices is the useTable developed at C-LAB (UseTable, 2012). The useTable is a flexible visualization table that supports multi-touch, tangible and pen-based interaction (Fig. 2). Compared to off-the-shelve solutions this approach enables us to adapt the technologies and techniques to the application and does not require the design towards the constraints of a given hardware environment. As part of the feedback throughout the design process the useTable has evolved into an interaction environment adapted to disaster management requirements.
Th u T b 55” h u H g projection. The projector is mounted beneath the surface and the image is projected to the top using two mirrors. For finger-tracking FTIR (Frustrated Total Internal Reflection) is applied and objects on the surface are tracked using a combined DI (Diffused Illumination). The camera on the bottom of the table is equipped with a corresponding IR filter and is connected to a tracking PC that applies the filter and tracking algorithms. The projection surface is equipped with an anti-reflex diffusor sheet
that enables pen-based interaction by using Anoto digital pens (Anoto, 2012; Haller et. al., 2007).
The useTable software is able to handle multi-touch interaction, tangible interaction with physical objects on the table surface and pen based interaction. In addition to these features that are also available on other platforms a new detection and tracking framework for advanced interaction using a depth-sensing camera (Kobayashi, 2008), called dSensingNI, was developed that extends the possibility of tangible and gestural interaction beyond the table surface (Jung et. al., 2011). The dSensingNI framework is capable of tracking user fingers and palm of hands, which enables precise and advanced multi-touch interactions as well as tangible interactions. For tangible interaction arbitrary physical objects can be used to control interaction. Using the depth- sensing camera, physical objects can be used in common (2D) actions, such as placing and moving, and also in 3D actions, such as grouping or stacking. The depth-sensing also allows extending the multi-touch interaction to object surfaces without the need for integrated logic and sensors.
Combing RFID chips and depth-sensing cameras the platform enables to identify and track the persons that are interacting with the useTable. This allows applying different functionality to different users based on their roles during an interaction, a central requirement not addressed by off-the-shelve multi- touch tables.
Fig. 2: C-LAB useTable
Using the useTable and dSensingNI as base technologies, a number of different interaction and visualization techniques have been implemented. These techniques enable experiments with users, e.g., to study the usability differences between touch input, pen-input and the use of interaction-objects. A key advantage of the interactive display in the disaster management application is the ability to rapidly switch between different maps and map representations. Using a layer concept different maps and additional information (e.g., airborne imagery) can be mixed while maintaining the established workflow. The extension of the visualization beyond map-display allows experimenting with integration of derived information (e.g., danger zones, uncertainty) as well as task dependent map generalization and highlighting strategies.
Insights from these studies are used to guide the development at the base technology level. For example, experience showed that in some scenarios a strict separation between visualization of the current situation and the planning of future actions is essential. Our design approach allows to adapt to these requirements by modifying and extending the set of available base technologies. To provide an intuitive separation we
extended the useTable into an L- Shape display. The L-Shape employs the useTable for planning as described. An additional wall display was added to visualize the current situation.
2.4 Alternative large-scale multi-touch displays
Large-scale multi-touch displays are becoming increasingly available as commercial products, e.g. Samsung SUR40 (Fig. 3, foreground) 40” u -touch table display that is widely available (Surface2, 2012) and GestureTek offers the GestDisplay, a vertical 60” u -touch display that also supports gesture based interaction (Fig. 4) (GestDislay, 2012). Another example is the PrimeTouch display (Fig. 3, background) that detects up to 32 points simultaneously on LC u 103” u z u 200” u . I b IR LE gh projected slightly over the display and photo diodes for tracking.
F g. 3: 65” P T u h and Samsung SUR40
Fig. 4: GestureTek GestDisplay (Image: GestureTek)
3. REQUIREMENTS AND DESIGN
In our user centred design process we collaborate directly with the German Federal Agency for Technical Relief (Technisches Hilfswerk/THW). Our iterative design approach is based on ISO standard 13407 (now replaced by 9241-210:2010) from which we derived an operational process specifically adapted to the development of user interfaces that employ emerging technologies for which no proven off-the-shelve components are available. Within the design process the different activities correspond to common practice, covering context of use (in our case study of user roles for stakeholders and real world disaster situations); user requirement (definition of scenarios, identification of requirements, definition of appropriate measures); production of design solution (from scenarios over prototypes to implementation) and evaluation (analysis of requirements, review of designs, tests of prototypes, and evaluation of the complete system). Our adaptation essentially
extends the design phase to enable the development and adaptation of the required base technologies in their own iterative design processes that are spun off and the results later integrated into the complete application.
3.1 General Requirements for Disaster Control Management
In previous work the existing situation of disaster control management has been analysed (Nebe et. al., 2011) in cooperation with our partner the German Federal Agency for Technical Relief (Ger bb . ‘THW‘). Th w k u g operation requires planning, coordination, collaboration and coactivity. Today they predominantly make use of classical tools like pen and paper, paper maps, boards and magnetic labels (see Fig. 1). Most of the dedicated workflows and roles are also highly standardized.
As a result, IT tools have to be integrated with care since they are not allowed to violate existing specifications.
The overall goal is to keep in control of the situation on-site or in the field. In order to guarantee this, there are specific roles dedicated to specific persons and an information distribution policy, which ensures that all incoming information and outgoing commands are served adequately. For legal reasons there is also a need of traceability, that is a documentation of which user initiated which command is required.
Building on existing studies on disaster management we conducted the requirements elicitation as an iterative, on-going process. The most important insights were derived from interviews, workshops and on-site training exercises conducted with disaster managers and technicians from THW. During practice we were able to observe the experts in their real work environment (Figure 2).
The insights from these observations were captured in scenarios that cover the diverse types of crisis situations and their information and command requirements, different user roles and operating environments.
These scenarios were then analysed to derive key requirements at the application, task and interaction level.
General application level requirements include:
provide access and control to information the way users are used to
manage and visualize the current situation in the field maintain the benefits of the established robust
workflow that is clearly visible to all stakeholders easily integrate non-expert personal (e.g. local support
staff)
clear allocation of control for critical tasks support for information sharing
data interface with OGC standard and commonly used non-standard data formats
enable integration of software tools that allow a more efficient processing of recurring tasks
Expected additional benefits for a new system include:
seamless and scalable map display
support for rich media presentations of information selective use of information layers
support for geo-referencing of units and incidents and automated transmission of coordinates
integration with existing GIS systems access to real-time sensor and location data information filtering and spatial analysis functions support for private workspaces
ability to distinguish between different users; traceable interaction
In the following paragraphs we discuss the requirements of two use scenarios in detail, where the benefits of a computer supported tool with simulation capabilities was identified as central:
3.2 Network Coverage
The most important thing for disaster control management is the (re-) creation of infrastructure. Therefore it is necessary that all involved control centres and units are able to communicate. Disaster control organizations are often able to create their own mobile network infrastructure via several antennas in the field. However, calculating antenna positions, network coverage and signal strength is a complicated task. Therefore it is essential to develop IT tools that support workers in this task.
3.3 Water Transportation
Water transportation is required in almost every emergency situation in order to extinguish fire, manage floodings or to organize drinking water supply. The planning of water transportation routes always depends on the area, the altitude profile, available tubes and pumps as well as obstacles in the field. A tool that calculates and evaluates routes and needed material is therefore another requirement for an interactive disaster control management system.
4. REALIZATION
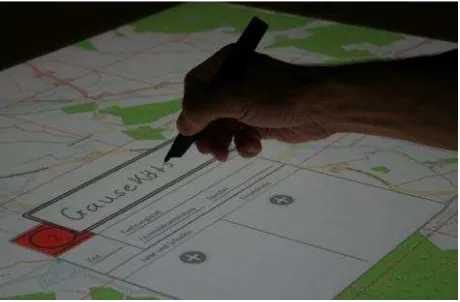
As previously described, the useTable offers multimodal interaction through multi-touch, tangible interaction and pen-based interaction. In cooperation with the German Federal Agency For Technical Relief (THW) we already developed a system that supports workers in disaster control management (Nebe et. al., 2012). The system allows the creation and manipulation of damage accounts that describe every detail of a situation on a digital map (see Fig. 5).
Fig. 5: Damage Accounts on the useTable
Fig. 6: Georeferenced images, damage accounts and assigned units
Further on arbitrary units (fire-fighters, THW, police, Red Cross, etc.) can be assigned to the damage accounts. Using GPS data and mobile devices allows a live visualization of unit positions as well as the damage account they are assigned to (see Fig. 6) which is usually also their final destination. Using mobile devices enables workers in the field further on to send multimedia data (images, videos or text messages) to the useTable. This is used to visualize and describe the situation with geo-referenced data in more detail (see Fig. 6).
4.1 Network Coverage
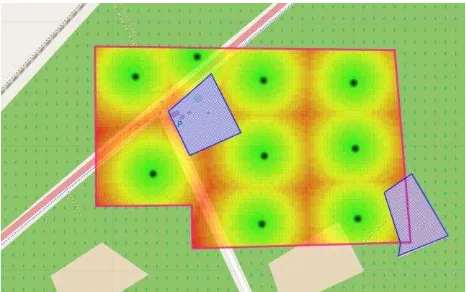
To fulfil the requirement of assisting the workers in planning mobile network creation the useTable offers the network coverage tool (see Fig. 7). Workers on the useTable can define the area that has to be covered as well as known obstacles like buildings, hills or trees. Based on this input data a Bresenham / A* / Connected Set Cover algorithm calculated the most suitable positions for antennas as well as the network coverage and signal strengths in the defined area (see Fig. 7).
Fig. 7: Antenna positions and network coverage in a predefined area with obstacles
4.2 Water Transportation
Another tool specifically designed to plan water transportation is the so called pump tool (see Fig. 8). Using digital pen input for precise planning it allows comparing different routes for water transportation. After drawing an arbitrary route on the map the altitude profile of the route is calculated as well as the number of tubes, the number of pumps and the position of pumps. All results are then visualized on the map as well as in the pump tool window (see Fig. 8). After drawing and visualizing different routes the workers on the useTable can
decide which one is most suitable and delete the others. Then assigned units begin to place tubes and pumps on the calculated positions in the field.
Fig. 8: Pump Tool
5. DISCUSSION
As explained previously the development takes place in close collaboration with the intended end-users from THW. In addition to formative evaluation that guides the development we have also conducted summative tests with experts from the THW and discussed the system with members of the THW authority. In general the feedback has been very positive. Regarding the base technologies the increasing availability of commercial systems makes the creation of similar systems increasingly viable for many applications.
5.1 Experiences
While the feedback has been very positive it became soon obvious that the central improvements that triggered these responses were process improvements and not interface improvements per-se. That is, for the end-users it was not essential if the system features a multi-touch, tangible or pen based interaction method, but the advanced functionality that a computerized system enables. As discussed previously the multi-modal interaction techniques are key enablers of these process improvements, because conventional user interface techniques fail to address many of the basic conditions of group interaction and situation awareness, thus the computerized processes described above can only be realized because the new interaction techniques enable to design a system that fits the central requirements (and that were not addressable with conventional user interfaces). These observations confirm that for the development of usable systems based on advanced interaction techniques the user centred process of developing a real-world application is essential, because individual interaction techniques (if they themselves are well designed and usable) can only enable better systems.
5.2 Process improvements
Even small functional additions enabled by a computerized system (e.g. switching maps while keeping the data and annotations geo-referenced) caused enthusiastic responses and process improvements enabled by having all data in digital form (e.g. the calculation of the number of required pumps) lead to significant improvements in efficiency (in the example of
calculating water pipelines a simply drawing of the intended connection with immediate feedback replaces a manual process that required 30min with paper maps and required significant experience to avoid calculation errors).
5.3 Interface improvement
The user feedback also led to a number of interesting insights into multi-touch gestures for rotation and translation. While these are well established on single user devices like tablets and smartphones they are not applicable in a mission critical multi-user application. This is due to the potential for un-intended and non-comprehensible transformations and the need for traceable actions. For other interactions multi-touch gestures were found suitable. The experience with digital pens and tangible indicates that they enable very natural interactions in our application context with correspondingly high acceptance by users.
6. CONCLUSION
Research is required to exploit the potential of advanced visualization techniques and user interaction techniques in disaster management and similar applications. The step from technology demonstrators to usable real-world systems requires adequate tools and stable base-technologies and the evaluation and validation of different design options in a real-world application context.
A promising extension of the system would be to extend the support of not just the planning staff in the comand center, but also to individual rescue workers in the field. In a separate project (FireNet) we have conducted early experiments with a mobile personal sensor network. Integrating such functionality within the disaster management application could further improve situation awareness in the command center by allowing real-time tracking of rescue personal as well as equipment position and state. Another area for future work concerns the extension from the current focus on observation (situation awareness) to analysis and prediction. The digital data enables the use of analysis functions (as exemplified by the pump planning) and a future extension towards simulation/prediction could be useful, especially in dynamic natural disaster situations like flooding or fires.
6.1 Implications
Novel interaction and visualization platforms like multi-touch tables are rapidly becoming commodity items. The design of user interfaces for these devices requires the consideration of the application context and user requirements. Neither, the experiences from desktop based interfaces based on the WIMP (windows, icons, menus, pointers) nor from small multi-touch possible with conventional techniques, in turn enabling significant process improvements that provide a real benefit to the end-users.
In future work it will be essential to study the cognitive workload of users and examine the potential physiological
dangers that may be incurred by prolonged use of large-scale post-WIMP displays. While the ergonomic requirements of desktop workplaces are well understood the same is not true for new interaction environments. Established ergonomic standards were often ignored in early demonstrators because of technology constraints (e.g. lighting levels to reduce IR contamination). And while interaction techniques like free-hand gestures are intuitive they can also cause a high-level of fatigue.
Thus, many central research questions pertaining to the use of post-WIMP interfaces in geo-information exist, that will have to be addressed to effectively exploit the possibilities of this new interaction styles.
7. ACKNOWLEDGMENTS
The authors wish to thank the German Federal Agency for Technical Relief (Technisches Hilfswerk/THW) in Detmold for the productive collaboration, specifically Thorsten Meier and Oliver Charles as well as the students in our students project groups at the University of Paderborn.
8. REFERENCES
ANOTO webpage: http://www.anoto.com. Last accessed 15.4.2012.
GestDisplay, 2012: Webpage: http://www.gesturetek.com/ illuminate/productsolutions_70-multi-touch.php. Last accessed 15.4.2012.
Haller, M., Brandl, P., Leitner, J., Seifried, T.: Large interactive surfaces based on digital pens. In: 10th Interantional Conference on Humans and Computers, pp. 172-177 (2007)
Inspire Directive (Directive 2007/2/EC of the European Parliament and of the Council of 14 March 2007): http://inspire.jrc.ec.europa.eu/ Last accessed 15.4.2012.
Ishii, H. 2008: The tangible user interface and its evolution , Communications of the ACM , June 2008, Volume 51, Issue 6.
Jacob, R et al. 2008. Reality-based interaction: a framework for post-WIMP interfaces. In Proceedings of the twenty-sixth annual SIGCHI conference on Human factors in computing systems (CHI '08).
Jung, H; Nebe, K.; Klompmaker, F.; Fischer, H.: Authentifizierte Eingaben auf Multitouchtischen, Proc. Mensch und Computer, Chemnitz, Germany, 2011.
Kobayashi, K., Kakizaki, T., Narita, A., Hirano, M., Kase, I.: Tangible user interface for supporting disaster education. In: Proceedings of SIGGRAPH '07, ACM, New York (2007)
Nebe, K., Klompmaker, F., Jung, H. and Fischer, H. 2011. Exploiting New Interaction Techniques for Disaster Control Management Using Multitouch-, Tangible-and Pen-Based-Interaction. HCII 2011. (2011), 100-109.
PrimeToch, 2012: webpage: http://www.prime-touch.com/; Last accessed 15.4.2012.
Surface2, 2012: Webpage: http://www.microsoft.com/surface/ en/us/default.aspx. Last accessed 15.4.2012.
UseTable webpage: http://www.usetable.de; Last accessed 15.4.2012.
van Oosterom, P.; Zlatanova, S.; Fendel, E. (Eds.): Geo-information for Disaster Management, Springer, 2005.