Relationships between Biomass and Phenolic Production in Grain Sorghum
Grown under Different Conditions
Manie´vel Se`ne, Thierry Dore´,* and Christiane Gallet
ABSTRACT as sorgoleone (Einhellig and Souza, 1992; Einhellig et
al., 1993; Weston et al., 1997) and phenolic acids (Ben-The total phenol pool (kg ha21) of the aerial parts and roots of
Hammouda et al., 1995; De Raissac et al., 1998) to the sorghum (Sorghum bicolorL. cv. CE145266) crops and their
relation-ships to dry matter and total phenol concentrations (g kg21) were soil by decomposing crop residues (Patrick et al., 1963; studied in four different data sets (2 sites32 yr for a total of 52 Chou et al., 1981; Paul et al., 1994; Siqueira et al., 1991; smallholder fields) in Senegal. The total phenol pool size varied from Hoffman et al., 1996) and root exudates. Some of these 4 to 156 kg ha21in the aerial parts and from 1 to 16 kg ha21in the
compounds are shown to have negative impact on soil roots. The phenol pool size was closely correlated with the amount fertility and crops. An assessment of their potential toxic of dry matter in both the aerial parts (r50.95,P,0.001) and the
effects requires an estimation of the amount of polyphe-roots (r5 0.91,P,0.001). In contrast, the phenol concentrations
nolic compounds in the soil. This is related not only to varied less between fields than the dry matter content, and therefore
the phenolic concentration in living tissue, but also to the had less impact on the phenol pool size. Using a N nutrition index
absolute biomass production of the plant. Consequently, (NNI) to assess the N nutrition of the sorghum crops, both phenol
the pool and concentration were higher when N nutrition was better. the total amounts of phenolic compounds accumulated Grain yield and the phenol pool of aerial parts were also positively in plants may be as important as their concentrations correlated. The data indicate that the environmental factors that pro- when determining the ability of plants to release allelo-mote growth and grain yield also enhance the total phenol synthesis chemicals.
in sorghum vegetative parts. In order to improve our understanding of the
allelo-pathic potential of sorghum, we studied the variability of the phenolic production in its shoots and roots over a wide range of agricultural conditions in the Sahel zone
T
he production of plant phenolic compounds,of Senegal. An estimation of the total phenol concentra-which are thought to be part of the chemical defense
tion (g kg21) and pool size (kg ha21) was made based
of the plant, is under the control of both genetic and
on dry matter data. The relationships between phenolic environmental factors. For instance, herbivore attacks
production, grain production, and N content (for the (Tempel, 1981), insect damage (Woodhead and
Ber-aerial parts) were established. In the areas investigated, nays, 1978; Woodhead and Cooper-Driver, 1979; Guinn
the differences among fields in soil fertility, rainfall, and and Eindenbock, 1982), or reduced soil fertility
(Coo-cropping systems are assumed to be large enough to per-Driver et al., 1977; Coley et al., 1985; Dustin and
result in differences in the available N and water for Cooper-Driver, 1992; Einhellig, 1996) will generally
in-sorghum. This could lead to differences in both sorghum crease the synthesis of these compounds by the plants.
growth (Heron et al., 1963; Langlet, 1973; Ramu et al., This has been partly explained by the balance between
1991; Donatelli et al., 1992; Rego et al., 1998; Singh et C and nutrient availability (Bryant et al., 1983). In
par-al., 1998) and phenol accumulation. ticular, N deficiency has been shown to strongly affect
the synthesis of polyphenols (Koricheva et al., 1998)
because it will affect growth more than photosynthesis, MATERIALS AND METHODS
and thus allows more carbohydrates to be available for
Measurements of the Plants phenolic synthesis. These results have usually been
ob-Four sets of smallholder fields cropped with sorghum
tained by determining the concentrations of total
phe-CE145266in the central peanut basin region of the Sahel area
nols or of different classes of compounds (e.g., tannins
of Senegal were studied—two in 1996 and the other two in
and phenolic acids) in plant tissues.
1997. In both years, one set was in Sagnane`me village (148009 However, phenolic compounds are also known to
N, 168159W) and the other in Me´dina village (148209N, 158309 have important effects once they are released from the W). The soils are ferralitic or ferruginous tropical soils with living plant by directly or indirectly influencing soil qual- 61–78% sand in the 0- to 10-cm layer. The soil bulk density ity and living organisms, including microorganisms and was not significantly different among fields and ranged from other plants. For instance, some agricultural plants like 0.147 to 0.160 kg m23. The pH ranged from 5.2 to 7.2 in the
sorghum are known to release phenolic compounds such 0- to 40-cm layer. In 1996, 12 fields were studied in Sagnane`me and 15 were studied in Me´dina. In 1997, eight other fields were studied in Sagnane`me and 17 other fields were studied
M. Se`ne, Inst. Se´ne´galais de Recherches Agric. (ISRA) CNRA, BP
in Me´dina. No fertilizer, plant protection products, tilling,
53 Bambey, Se´ne´gal; T. Dore´, Inst. Natl. Agron. Paris-Grignon (INA
or irrigation were used, following the usual practice of local
P-G), Lab. d’Agron. Inst. Natl. de la Recherche Agron. and INA
farmers. Weeds were removed by hand.
P-G, 16 rue C. Bernard, 75231 Paris Cedex 05, France; and C. Gallet,
Univ. of Savoie, Lab. sur la Dynamique des Ecosyste`mes d’Altitude, The sorghum was sown by the farmers at the beginning of
73376 Le Bourget-du-Lac Cedex, France. Received 29 Nov. 1999. the rainy season, which lasts from July to October. A 25- by *Corresponding author ([email protected]).
Abbreviations:DW, dry weight; NNI, N nutrition index. Published in Agron. J. 93:49–54 (2001).
50 AGRONOMY JOURNAL, VOL. 93, JANUARY–FEBRUARY 2001
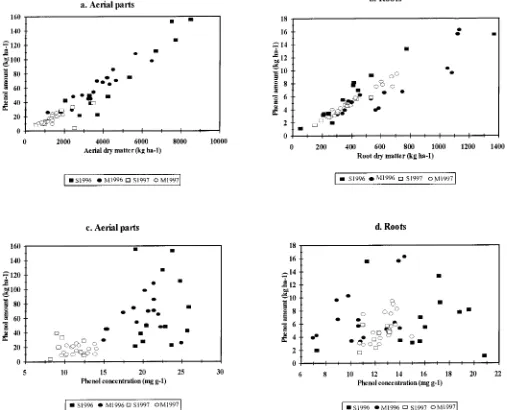
Fig. 1. Relationship between (a) the total phenol amount and dry matter of the aerial parts and (b) the total phenol amount and dry matter of the roots and between (c) the total phenol amount and conc. in the aerial parts and (d) the total phenol amount and conc. in the roots. S1996 and S1997: Fields at the Sagnane`me site in 1996 and 1997; M1996 and M1997: Fields at the Me´dina site in 1996 and 1997.
25-m plot was marked in each field 15 d after crop emergence. tion values are not available for 8 of the 15 fields in Me´dina in 1996. Root samples were treated in a similar way, but no Each plot was divided into 25 subplots that were 5 by 5 m.
Five of these subplots were randomly chosen for growth and N analysis was performed.
The aerial dry matter [kg ha21dry wt. (DW)] for each field
N controls, and another five were randomly selected for yield
sampling. In each of the 25 subplots, the plants were counted was calculated as the mean dry matter of the five N control subplots. At the flowering stage, the root dry matter content and the between-row and within-row spacings were measured
to determine the plant density so that the dry matter produc- was assessed in two subplots per field. In each subplot, 24 cylindrical cores of soil (total vol. of each core was 0.029 m3
tion and grain yields could be calculated.
In each field, 10 sorghum plants were randomly collected with a soil sampling vol. of 0.02 m3) were taken horizontally
just under a sorghum plant from the center of 24 squares (0.1 from each N control subplot at the flowering stage. This is
the stage with the highest level of aerial and subterranean by 0.1 m) that corresponded to a hole measuring 0.6 m wide by 0.4 m deep. The samples were sifted and washed with water vegetative dry matter (Blondel, 1971; Vanderlip and Reeves,
1972) and the highest concentration of phenols (Woodhead, to separate the roots from the soil. The roots were dried at 708C for 96 h and weighed. The root concentration (kg m23)
1981). The aerial parts and roots of the plants were separated.
The aerial parts from the 10 plants of each subplot were pooled in the soil was calculated for each subplot, and the mean value for the 48 squares was used to calculate the mean root dry to one sample per subplot, dried at 708C for 96 h, weighed,
and ground up. The five ground-up aerial tissue samples of matter per plant. The root dry matter (kg ha21) was calculated
by multiplying the root mean dry matter per plant by the plant each field were pooled, and a 50-g sample was taken for phenol
analysis. The rest was used for N analysis, following the density (number of plants per hectare).
concentra-SE` NE ET AL.: BIOMASS AND PHENOLIC PRODUCTION IN GRAIN SORGHUM 51
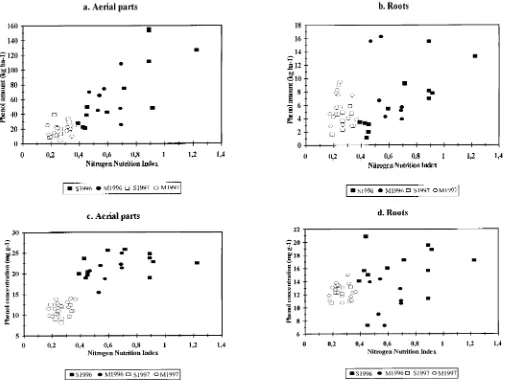
Fig. 2. Relationship between (a) the total phenol amount in the aerial parts and the NNI and (b) the total phenol amount in the roots and the NNI and between (c) the total phenol conc. in the aerial parts and the NNI and (d) the total phenol conc. in the roots and the NNI. S1996 and S1997: Fields at the Sagnane`me site in 1996 and 1997; M1996 and M1997: Fields at the Me´dina site in 1996 and 1997.
of the five yield subplots in each field, and the panicles were Phenolic Analysis of the Plants removed and air-dried for 30 d. The grain was removed and
Dried, ground-up roots or aerial parts (500 mg) were ex-weighed, and the yield was calculated for each subplot. The
tracted twice (100 and 75 ml) by refluxing with 70% (v/v) grain yield of each field (kg ha21) was estimated as the mean
boiling ethanol (C2H5OH) for 20 min. The extracts were
of the five subplot yields.
pooled and evaporated under vacuum. The residues were dis-The work of Ple´net (1995) and Lemaire et al. (1996) was
solved in a standard volume of hot distilled water, and aliquots used to assess the N nutrition. These authors established a
were taken for the determination of total phenol, using the reference curve (after Greenwood et al., 1990; Lemaire et al.,
Folin–Ciocalteu reagent and gallic acid as a standard. The 1990) for maize (Zea maysL.) and sorghum, establishing the
results are expressed as milligrams of gallic acid equivalents. relationship between aerial dry matter (Mg ha21DW) and the
normal N concentration in aerial dry matter (Nc), expressed
as %DW using the equation Statistical Analysis
Nc5 3.4DW20.37 Pearson correlation coefficients were calculated between
phenol concentrations and the NNI, the phenolic amount and The reference value (Nc) derived from the reference dilution plant dry matter, the phenolic concentration and plant dry curve and the percentage of N in the sorghum crop aerial dry matter, and the phenolic amount and grain yield.
matter (Nt) was then used to give the NNI
NNI5Nt/Nc
RESULTS
According to Lemaire and Gastal (1997) and Ple´net and Cruz
The total phenol amount in the aerial parts varied
(1997), the lower the NNI, the poorer the N nutrition. We
among fields from each data set and among sets. In
could therefore compare the N nutritional status of crops that
52 AGRONOMY JOURNAL, VOL. 93, JANUARY–FEBRUARY 2001
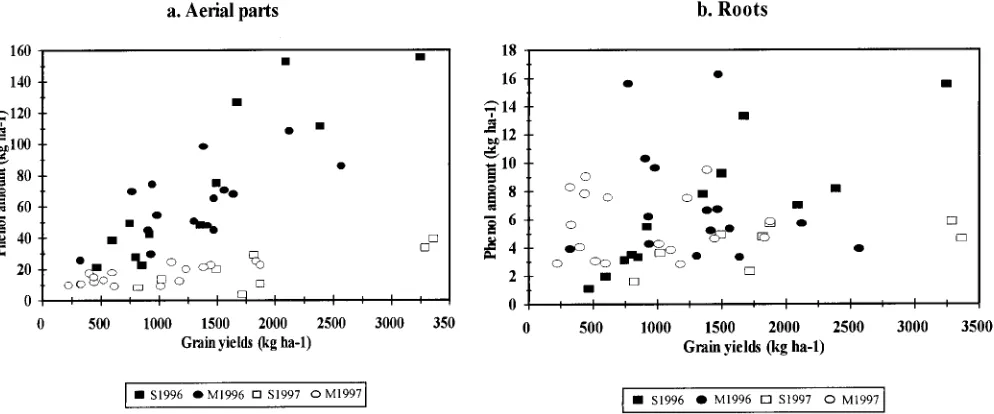
Fig. 3. Relationship between the grain yield and total phenol amount in (a) the aerial parts and (b) roots. S1996 and S1997: Fields at the Sagnane`me site in 1996 and 1997; M1996 and M1997: Fields at the Me´dina site in 1996 and 1997.
and from 26 to 98 kg ha21in Me´dina. In 1997, it ranged (r
50.86 and 0.81,P,0.001 and 0.002 in 1996 and 1997, respectively) but not in Me´dina (P . 0.07) (Fig. 3b). from 4 to 39 kg ha21in Sagnane`me and from 9 to 25 kg
ha21in Me´dina. There were also wide differences in the
phenol amount in the roots. In 1996, it ranged from 1
DISCUSSION
to 15 kg ha21in Sagnane`me and from 3 to 16 kg ha21in Me´dina. In 1997, it ranged from 2 to 6 kg ha21 in Studies of allelopathy in sorghum have focussed on
Sagnane`me and from 3 to 9 kg ha21in Me´dina. For both the phenol concentrations (Guenzi and McCalla, 1966;
the aerial parts and roots, the total phenol amount was Woodhead and Bernays, 1978; Woodhead and Cooper-closely correlated with the dry matter (Fig. 1a, 1b). The Driver, 1979; Burgos-Leon et al., 1980; Cherney et al., coefficients of correlation for the dry matter and total 1991; Einhellig et al., 1993; Ben-Hammouda et al., 1995), phenols werer 5 0.95 (P , 0.001) in the aerial parts rather than the total phenol amount.
andr5 0.91 (P,0.001) in the roots. When the years In the four data sets that we studied, an increase in and sites were considered separately, the coefficient of the dry matter amount of the roots and aerial parts was associated with an increase in the total phenolic amount. correlation was always higher than 0.9 (P, 0.001) for
the roots and 0.8 (P,0.001) for the aerial parts, except The range of dry matter was greater (by a factor of up to 20 in the aerial parts and up to 25 in the roots) than for Sagnane`me in 1997 (r50.65,P50.08). In contrast,
the total phenol amount was linked less with the phenol the range of phenol concentrations (a factor of about 3 for both the aerial parts and roots). Thus, the total concentration (r50.40,P50.004 for phenol conc. and
total phenols in the aerial parts andr50.21P50.142 phenolic amount of sorghum tissues was linked more with the dry matter production than with the phenol in the roots) (Fig. 1c, 1d).
The accumulation of phenols in the aerial parts and concentration. This finding is crucial in assessing the potential release of phenolic allelochemicals by a sor-roots of sorghum plants in the fields seemed to be
posi-tively correlated with the NNI (r 5 0.85, P , 0.001 ghum crop. This was not expected because biotic or abiotic constraints were assumed to enhance the phenol andr50.46,P50.002 for the aerial parts and roots,
respectively) (Fig. 2a, 2b). A similar but less marked concentration and decrease dry matter; thus the result on the total phenol amount was unclear. Using the con-trend was found for the phenol concentrations (r50.81,
P,0.001 for the aerial parts andr50.38,P50.011 for centration of phenols to assess the potential release in a cropping system is of limited value unless the plant the roots) (Fig. 2c, 2d). These correlations disappeared
when the years and sites were considered separately, dry matter is determinated, as was recently emphasized by Koricheva (1999).
except for the correlation between the total phenol
amount and NNI at Sagnane`me in 1996 (r50.80,P5 The growth conditions varied considerably among years, sites, and the individual fields in each data set, 0.0018 for aerial parts and r 5 0.85, P , 0.001 for
the roots). as shown by the wide range of grain yield. Nitrogen
nutrition also varied among fields within each data set For each set of data, a close correlation was found
between the total phenol amount in the aerial parts and for 1996, as shown by the values of the NNI for this year. However, this index only reflects the N nutrition grain yield: r ranged from 0.66 to 0.90 (P , 0.02 for
each data set) (Fig. 3a). A positive correlation between status of the crop and does not provide information on other limiting factors, such as water supply. We never-the phenols in never-the roots and grain yield was also
SE` NE ET AL.: BIOMASS AND PHENOLIC PRODUCTION IN GRAIN SORGHUM 53
thank Xavier Puthod for his work, Franc˛ois Pellissier for help
phenol amount and the NNI across sites and years. This
and advice, and Monika Ghosh for revising the English text.
correlation was basically due to the existence of a wide difference between the 2 yr for each of the measured
parameters. When the sites and years were considered REFERENCES
separately, differences between data sets emerged and Ben-Hammouda, M., R.J. Kremer, H.C. Monor, and M. Sarwar. 1995. the correlation remained only for Sagnane`me in 1996. A chemical basis for differential allelopathic potential of sorghum
hybrids on wheat. J. Chem. Ecol. 21:775–786. The differences between data sets may be attributed to
Blondel, D. 1971. Contribution a` l’e´tude de la croissance en matie`re differences in growth conditions between the sites and
se`che et de l’alimentation azote´e des ce´re´ales de cultures se`ches years. This is especially true of the total rainfall during au Se´ne´gal. Agric. Trop. 26:707–720.
the growing season, which varied from 396 mm in Me´- Bremner, J.M., and C.S. Mulvaney. 1982. Nitrogen total. p. 595–562. InA.L. Page et al. (ed.) Methods of soil analysis. Part 2. Microbio-dina in 1996 to 932 mm in Sagnane`me in 1997. The
logical and biochemical properties. SSSA, Madison, WI. water stress that occurred in 1996 might explain the
Bryant, J.P., F.S. Chapin, and D.R. Klein. 1983. Carbon/nutrient bal-increased phenolic production because a moderate wa- ance of boreal plants in relation to vertebrate herbivory. Oı¨kos ter deficit is believed to stimulate secondary metabolites 40:357–368.
Burgos-Leon, W., F. Ganry, R. Nicou, J.L. Chopart, and Y. Dom-synthesis (Horner, 1990). If the magnitude of the water
mergues. 1980. Etude et travaux: Un cas de fatigue des sols induite deficit on the phenolic production is larger than that of N
par la culture du sorgho. Agric. Trop. 35:319–334.
nutrition, it could partly explain the positive correlation Cherney, D.J.R., J.A. Patterson, and J.S. Cherney. 1991. Fibre and across sites and years between the concentration of total soluble monomer composition of morphological components of phenols (especially in the aerial parts) and the NNI sorghum stover. J. Sci. Food Agric. 54:645–649.
Chou, C.H., Y.C. Chiang, and H.H. Cheng. 1981. Autotoxicity mecha-when the C/N balance hypothesis postulates a decrease
nism of Oryza sativa. III. Effects of temperature on phytotoxin in the C-based secondary metabolites as N fertilization
production during rice straw decomposition in soil. J. Chem. increases. For instance, Dustin and Cooper-Driver Ecol. 7:741–752.
(1992) found a decrease in the total phenol concentra- Coley, P.D., J.P. Bryant, and F.S. Chapin. 1985. Resource availability and plant antiherbivore defense. Science 230:895–899.
tion in the leaves of hay-scented fern (Dennstaedtia
pun-Cooper-Driver, G.A., S. Finch, T. Swain, and E. Bernays. 1977. Sea-ctilobula) when the foliage N concentrations increased.
sonal variation in secondary plant compounds in relation to the The discrepancy between our data and those of others palatability ofPteridium aquilinum. Biochem. Syst. Ecol. 5:211–218. may be due to: (i) the difference in the species used De Raissac, M., P. Marnotte, and S. Alphonse. 1998. Interactions between cover crops, weeds and crops: How important is allelopa-because most of the earlier studies were obtained on
thy? Agric. De´v. 17:40–49. tree species (see the review of Koricheva et al., 1998)
Donatelli, M., G.L. Hammer, and R.L. Vanderlip. 1992. Genotype and (ii) the difference between the NNI and N concen- and water limitation effects on phenology, growth and transpiration tration, the latter being less effective as an indicator of efficiency in grain sorghum. Crop Sci. 32:393–396.
N deficiency. However, the correlation for the fields as Dustin, C.D., and G.A. Cooper-Driver. 1992. Changes in phenolic production in the hay-scented fern (Dennstaedtia punctilobula) in a whole was no longer observed within the four separate
relation to resource availability. Biochem. Syst. Ecol. 20:99–106. data sets. Therefore, our results that are related to the
Einhellig, F.A. 1996. Interactions involving allelopathy in cropping relationship between N nutrition and phenol accumula- systems. Agron. J. 88:886–893.
tion might have a limited value. Such a correlation must Einhellig, F.A., J.A. Rasmmussen, A.M. Hejl, and I.F. Souza. 1993. Effects of root exudate sorgoleone on photosynthesis. J. Chem. be checked under controlled conditions, in which N
Ecol. 19:369–375. nutrition is the only variable.
Einhellig, F.A., and I.F. Souza. 1992. Phytotoxicity of sorgoleone Finally, we observed a correlation between the total found in grain sorghum root exudates. J. Chem. Ecol. 18:1–11. phenol amount and grain yield of the sorghum crops. Greenwood, D.T., G. Lemaire, G. Gosse, P. Cruz, A. Draycott, and
J.J. Netteson. 1990. Decline in percentage N of C3 and C4 crops This was true of all of the data sets for the aerial parts,
with increasing plant mass. Ann. Bot. 66:425–436. and it is probably due to the influence of dry matter
Guenzi, W.D., and T.M. McCalla. 1966. Phenolic acids in oats, wheat, accumulation on both the grain yield and total phenol sorghum, and corn residues and their phytotoxicity. Agron. J. amount. This correlation was found for the roots only 58:303–304.
Guinn, G., and M.P. Eidenbock. 1982. Catechin and condensed tannin in two data sets (Sagnane`me, 1996, 1997). The
between-contents of leaves and bolls of cotton in relation to irrigation and set differences could be attributed to differences in the
boll load. Crop Sci. 22:614–616.
shoot/root ratio (DW basis). The fields with high yields Heron, G.M., D.W. Grimes, and J.M. Musick. 1963. Effects of soil apparently took advantage of better growth conditions moisture and nitrogen fertilization of irrigated grain sorghum on and had crops with high total phenol amounts. It could dry matter production and nitrogen uptake at selected stages of
plant development. Agron. J. 55:393–396. be useful to design agronomic strategies that allow
sub-Hoffman, M.L., L.A. Weston, J.C. Snyder, and E.E. Re´gnier. 1996. sequent crops to escape the impact of the phenols that
Separating the effects of sorghum (Sorghum bicolor) and rye (
Sec-are released, rather than trying to decrease the phenol ale cereale) root and shoot residues on weed development. Weed production because grain yield and phenol production Sci. 44:402–407.
Horner, J.D. 1990. Nonlinear effects of water deficits on foliar tannin by sorghum (CE145266) are linked.
concentration. Biochem. Syst. Ecol. 18:211–213.
Koricheva, J. 1999. Interpreting phenotypic variation in plant
allelo-ACKNOWLEDGMENTS chemistry: Problems with the use of concentrations. Oecologia 119:467–473.
The experiments were supported by the Natural Resource Koricheva, J., S. Larrson, E. Haukioja, and M. Keina¨nen. 1998. Regu-Based on Agricultural Research (NRBAR) project of the lation of woody plant secondary metabolism by ressource availabil-ISRA and U.S. Agency for Int. Dev. Analyses of phenolics ity: Hypothesis testing by means of meta-analysis. Oı¨kos 83:
212–226.
54 AGRONOMY JOURNAL, VOL. 93, JANUARY–FEBRUARY 2001
Langlet, A. 1973. Effets de la se´cheresse sur la croissance et la produc- and Y.V. Srirama. 1998. Response to fertilizer nitrogen and water of post-rainy season sorghum on vertisol. 1. Biomass and light tion du sorgho grain. Ann. Agron. 24:307–338.
Lemaire, G., X. Charrier, and Y. He´bert. 1996. Nitrogen uptake capac- interception. J. Agric. Sci. (Cambridge) 131:417–428.
Singh, P., J.L. Monteith, K.K. Lee, J. Rego, and S.P. Wani. 1998. ities of maize and sorghum crops in different nitrogen and water
supply conditions. Agronomie 16:231–246. Response to fertilizer nitrogen and water of post-rainy season sor-ghum on vertisol. 2. Biomass and water extraction. J. Agric. Sci. Lemaire, G., and F. Gastal. 1997. N uptake and distribution in plant
canopies. p. 3–43.InG. Lemaire (ed.) Diagnosis of the nitrogen (Cambridge) 131:429–438.
Siqueira, J.O., M.G. Nair, R. Hammerschmidt, and G.R. Safir. 1991. status in crops. Springer–Verlag, New York.
Lemaire, G., F. Gastal, P. Cruz, and D.J. Greenwood. 1990. Relation- Significance of phenolic compounds in plant-soil-microbial systems. Crit. Rev. Plant Sci. 10:63–121.
ships between plant-N, plant mass and relative growth rate for C3
and C4 crops.InA. Scaiffe (ed.) Proc. Congr. Eur. Soc. Agron., Tempel, A.S. 1981. Field studies of the relationship between herbivore damage and tannin content in bracken (Pteridium aquilinum 1st, Paris, France. 5–7 Dec. 1990. ESA, Colmar, France.
Patrick, Z.A., T.A. Toussoum, and J.C. Snyder. 1963. Phytotoxic sub- Kuhn.). Oecologia 51:97–106.
Vanderlip, R.L., and H.E. Reeves. 1972. Growth stages of sorghum. stances in arable soils associated with decomposition of plant
resi-dues. Phytopathology 53:152–161. Agron. J. 64:13–16.
Weston, L.A., C.I. Nimbal, and M.A. Czarnota. 1997. Activity and Paul, J.W., J.A. Covert, and E.G. Beauchamp. 1994. Influence of soil
temperature and moisture on water-soluble phenolic compounds persistance of sorgoleone, a long-chain hydroquinone produced by Sorghum bicolor. p. 509–516.In Brighton Crop Conf.—Weeds, in manured soil. Can. J. Soil Sci. 74:111–114.
Ple´net, D. 1995. Fonctionnement des cultures de maı¨s sous contrainte United Kingdom. 17–20 Nov. 1997. Br. Crop Protection Counc., Farnham, United Kingdom.
azote´e; de´termination et application d’un indice de nutrition. The`se
de doctorat. Instit. Natl. Polytechnique de Lorraine, Univ. de Woodhead, S. 1981. Environmental and biotic factors affecting the phenolic content of different cultivars ofSorghum bicolor. J. Chem. Nancy, France.
Ple´net, D., and P. Cruz. 1997. Maize and sorghum. p. 93–106.InG. Ecol. 7:1035–1047.
Woodhead, S., and E.A. Bernays. 1978. The chemical basis of resis-Lemaire (ed.) Diagnosis of the nitrogen status in crops. Springer–
Verlag, New York. tance ofSorghum bicolorto attack byLocusta migratoria. Entomol. Exp. Appl. 24:123–144.
Ramu, S.V., S.P. Palaniappan, R.M. Panchanathan. 1991. Growth and
dry matter partitioning of sorghum under moisture stress condition. Woodhead, S., and G. Cooper-Driver. 1979. Phenolic acids and resis-tance to insect attack inSorghum bicolor. Biochem. Syst. Ecol. J. Agron. Crop Sci. 166:273–277.
Rego, T.J., J.L. Monteith, P. Singh, K.K. Lee, V. Nageswara Rao, 7:309–310.
Rust-Enhanced Allelopathy of Perennial Ryegrass against White Clover
Scott W. Mattner* and Douglas G. Parbery
ABSTRACT Connolly, 1990). Crown rust is the most serious ryegrass
fungal pathogen in these areas (Eagling and Clark, 1993), Perennial ryegrass (Lolium perenneL.) and white clover (
Trifo-with epidemics regularly occurring between spring and
lium repensL.) are important pasture components in the higher
rain-fall areas of southeastern Australia. Crown rust (Puccinia coronata autumn. A preliminary study demonstrated that rust ac-Corda f.sp.loliiBrown) is the most serious ryegrass pathogen in these celerates senescence and reduces ryegrass yield by 56% areas. In a preliminary investigation, rust reduced ryegrass biomass (Mattner, 1998). Despite this, in ryegrass and clover mix-by 56%. Yet, interference from rusted ryegrass suppressed the yield tures, interference from rusted ryegrass suppressed clover of neighboring clover plants more than interference from healthy biomass by up to 47% compared with interference from ryegrass. The role of allelopathy in this relationship was investigated
healthy ryegrass. This suppression did not result from in a greenhouse study using two bioassays. Soil previously growing
a direct effect of crown rust on clover, because rust-rusted ryegrass suppressed clover biomass by 36% compared with
inoculated and non-inoculated clover monocultures soil previously growing healthy ryegrass. Similarly, leachate from soil
yielded the same, which was expected since clover is a surrounding rusted ryegrass suppressed clover biomass by 27%
com-pared with that from healthy ryegrass. This is the first demonstration nonhost of crown rust. Similarly, clover suppression is that a pathogen may influence allelopathy between plants and that not explained by rust increasing ryegrass competitive-rust may enhance ryegrass allelopathy against clover. Possible implica- ness because, if this were so, the reduction in clover tions of this in pasture ecology and the evolution of mutualism are dis- yield would be greatest at high densities where resources
cussed. are most limited. Instead, clover suppression was
great-est at low densities, where competition for resources was minimal. Ryegrass allelopathy is well documented, particularly against clovers and medics (Gussin and
P
erennial ryegrass and white clover predominateLynch, 1981; Takahashi et al., 1988, 1991, 1993; Quigley improved pastures in the higher rainfall areas of
et al., 1990; Chung and Miller, 1995). For these reasons, southeastern Australia. Their growth in mixtures
with-we investigated the hypothesis that rusting increases out added nitrogen results in greater herbage yields than
ryegrass allelopathic ability. otherwise can be achieved economically (Menchaca and
Both Rice (1984) and Einhellig (1995) hypothesized that pathogens enhance their host’s allelopathic ability. S.W. Mattner, Agriculture Victoria, Institute for Horticultural
Devel-Evidence supporting this hypothesis occurs in at least opment, Private Bag 15, Scoresby Business Centre, Victoria 3176,
Australia; D.G. Parbery, Institute of Land & Food Resources, The two forms. Firstly, pathogens stimulate phytoalexin (an-Univ. of Melbourne, Parkville, Victoria 3052, Australia. Received 29 timicrobial compounds) production by their hosts Nov. 1999. *Corresponding author ([email protected]).