AN ANALYSIS OF THE RATES OF
INJURY AND FATAL ACCIDENTS IN MICHIGAN
STATE POLICE PURSUITS:
A MICHIGAN EMERGENCY RESPONSE STUDY
Dennis M. Payne
Michigan State University andJohn Charles Fenske
Sam Houston State UniversityThis analysis examines the accident injuries and fatalities which occurred during a one year study of pursuits in Michigan, and it compares those outcome rates to Michigan’s three and five-year general population accident mean injury and fatality rates. It also provides comparisons to a three-year mean rate of the same outcomes resulting from accident experience of the same agency in non-pursuit related accidents.
Though this work is limited to one state and thus is not generalizable, it does examine negative outcomes associated with police pursuits in the context of other accident outcomes experienced by the police on general patrol as well as the experiences of the motoring public. Such work conducted elsewhere may be useful in helping to define the comparative risks of police pursuits to the risks encountered by the police when not engaged in pursuits and the general population driving experience.
and other interested parties may question whether pursuit related accidents, injuries and fatalities occur more frequently or less frequently than such outcomes resulting from general population motor vehicle operation. In a Metro-Dade study, Alpert and Dunham (1989) reported that pursuits accounted for less than 5 percent of all police accidents. Moreover, they concluded that serious injury as a result of a pursuit is rare, especially to the police or bystanders.
Determining the comparative risks of other pursuit accident variables may aid police administrators in reaching sound policy decisions and enhance police training by focusing on predictor outcomes. The speeds involved, the road and weather conditions and the light conditions are but a few of the variables of interest. Not all pursuit characteristics are comparable to non-pursuit police accidents and those of the general population. In their examination of police pursuits, Alpert and Dunham (1989), found location to be a predictor of pursuit accidents and injuries, road conditions a predictor of accidents and the time of day a predictor of accidents and apprehension.
Dunham and Alpert (1991) provided useful findings for police administrators. They concluded that the outcomes of pursuits involving female and older male officers are more efficient than pursuits involving other officers when evaluated with a cost/benefit ratio. They also noted that officers’ age did contribute to a prediction of a negative outcome, as younger officers had the greatest likelihood of a negative outcome.
REPORTING PROBLEMS
pursuits, particularly those with positive outcomes, they act against their own best interests and may be their own worse enemy in the pursuit debate. Preliminary findings in one state indicate the police underreport pursuits by a factor of two and it may be as high as ten (Payne, 1996a). Falcone (1994), referencing Falcone et al. (1992), reports an alarming disparity between the official record of pursuits and those reported unofficially. Falcone et al. (1992) state the under estimations may be by a factor of five to 15 times.
Some previous studies, important in their own right, are generally limited to observations of activities within a particular geographical area. Further research comparing geographical variances may assist in the overall evaluation and external validity of previous results. The number and variability of factors surrounding these police practices present a continual problem for researchers as well as practitioners.
PURSUIT RESTRICTIONS
The topic of pursuit is often viewed as controversial among police officials, researchers, litigators, the public and the media. A number of different positions are offered on the general utility of pursuits. Positions range from those who would refrain from pursuits entirely to those who view pursuits as central to policing and would recommend their use with limited restrictions. Beckman (1986) concluded no pursuit is particularly safe, regardless of speed, distance or duration. Conversely, the California Highway Patrol (CHP) (1983) suggests the pursuit and apprehension of minor traffic violators is necessary to maintain order. Those officials submit that the number of people who flee would increase if the public knew the police would not pursue them. Others follow a moderate path and suggest pursuits must be restricted in varying degrees (Abbott, 1988; Alpert and Dunham, 1990; Kennedy et al., 1992; Payne and Corley, 1994; Shuman and Kennedy, 1989).
VIEWPOINTS ON PURSUIT POLICY
(1) the officer judgment model;
(2) a restrictive model; and
(3) a model of discouragement or prohibition.
Whetsel and Bennett (1992) call for attitudinal changes in pursuit policies, where compliance should be anchored in the cognitive, emotional, physical and spiritual dynamic of every individual. Territo (1982) found considerable variations among the policies he studied and recommended strong controls on the operation of police vehicles in pursuits and other emergency responses. Morris (1993) notes that many agencies do not have a pursuit policy and of those that do, the policies are frequently ambiguous or misleading. He concluded that pursuit policies must be specific to ensure a common understanding. Charles and Falcone (1992) discovered there was considerable confusion among officers regarding pursuit policy. Kennedy et al. (1992) report 79 percent of the policies they studied fell into the officer judgmental category, and more restrictive policies were more likely to be seen in cities with higher population densities. A special commission in Canada concluded that despite potential hazards to human well-being, failing to uphold the law by means of vehicle pursuit may pose a much greater threat to the well-being of society in general (Solicitor General Report, 1985). Alpert and Smith (1991) proposed that determining the appropriate policy, which balances deterrence and citizen safety, is the key element in obtaining the desired police reaction to motorists who flee the police. Auten (1990) reported that 2 l percent of all the police agencies studied did not have any written guidelines governing the activities of police pursuit operations. Falcone et al. (1992) recommended police agencies should have well-developed, highly restrictive police pursuit policies and stringent procedures for their departments.
PURSUIT TRAINING
McCoy, 1988). Later, trainers espoused concerns for the officer, the suspect and the public. Training emphasis changed from a purely physical skill orientation (Basham, 1978; Clark, 1976; Dougherty, 1961; International Association of Chiefs of Police (IACP), 1965, 1968; Schultz, 1979; Traffic Institute, 1981) to an emphasis that added policy issues and restrictions in addition to skill development (Auten, 1985, 1991; Fyfe, 1989; Halloran, 1985; James, 1980; Wisconsin DOJ, 1984). This change of operational focus may be attributed to the stimuli of empirical research and the growth of lawsuits arising from the use of 42 USC 1983. Falcone et al. (1992) discovered police agencies generally equate emergency driving training with pursuit training, when in fact the two do not possess the same content.
LITERATURE
Of particular relevance to this research, Alpert and Dunham (1990) compared pursuit related traffic accidents to all traffic accidents in Dade county. In 1987, Metro-Dade Police investigated 10,045 accidents which included 61 percent (n = 6118) injury accidents and 1 percent (n = 113) fatal accidents. Less than 1 percent of the accidents were attributable to police pursuits. They also compared the pursuit accidents to all police accidents experienced by Metro-Dade officers. This was an important comparison, as the police officers would likely have been exposed to similar driving hazards and similar levels of vehicle operation training, thus constituting a fairly homogeneous group for comparison. In 1986, Metro-Dade’s estimated 2,000 officers were involved in 614 accidents including 14 percent (n = 78) injury accidents. In 1987, the officers were involved in 602 accidents including 12 percent (n = 67) injury accidents. The 1987 figures represented 6 percent of all Dade County accidents and slightly over 1 percent of all Dade county injury accidents.
Five Prominent Studies
ranged from six months to three years. The number of pursuits examined ranged from 286 to 952. The number of police agencies involved ranged from a low of two to a high of 86. The majority of pursuits were initiated for traffic violations. The lone exception was Charles et al. (1992), in which non-felonies were found to be the most common initiating event. It was not clear though whether non-felonies included traffic violations by definition.
Among the five studies, 68 to 77 percent of the pursuits ended in the arrest of a suspect. Among those that examined termination factors, 18 to 36 percent of the suspects voluntarily terminated by stopping and surrendering. Most of the pursuits were of short duration and distance. The pursuit accident rates ranged from 26 to 41 percent, injuries occurred in 9 to 17 percent of the accidents and fatalities occurred in zero to 3 percent of the cases.
Accident Outcomes
The California Highway Patrol study (1983) conducted from April through September 1982 involved ten police agencies from Southern California and the highway patrol. The 683 reported pursuits reflected an accident rate of 29 percent (n = 198), an 11 percent injury rate (n = 75) and a 1 percent fatality rate (n = 7). All officers who participated in that study were asked to complete a survey instrument for each pursuit conducted.
Beckman (1986) conducted a study utilizing a modified version of the CHP questionnaire from April 1984, through September 1984. Nine states and two US territories were sampled. Each officer who had participated in a pursuit was asked to complete a survey instrument. That study of 424 pursuits revealed an accident rate of 42 percent (n = 178), an injury rate of 14 percent (n = 59) and a fatality rate of 3 percent (n = 12). It was not clear whether the reports were completed after the fact or at the time of the pursuit involvement. It is not known whether all officers from each department were to report all pursuits or the researcher relied on an officer sample from each agency. Regardless of the criticisms that can be made of this and other studies, Beckman (1986) did provide accident data useful for this analysis. Interestingly, pursuit profiles provided were quite similar to profiles reported elsewhere.
was developed and adopted by all Dade county police agencies. Phase II, 1985 through 1987, involved an empirical analysis of pursuits involving members of the Dade and Miami police departments. Metro-Dade’s three-year participation resulted in 819 pursuits and Miami (1986) resulted in an additional 133 pursuits for a total of 952 pursuits. The accident rate was 33 percent (n = 310), the injury rate was 17 percent (n = 160) and a 1.7 percent (n = 7) fatality rate was reported.
Auten (1991) conducted a study from January through December of 1990 of 86 participating police agencies in Illinois in which all officers were to complete a survey instrument after each police pursuit. A total of 286 pursuits were reported. The accident rate was approximately 41 percent (n = 118), including a 12 percent injury rate (n = 34) and a 1.4 percent (n = 4) fatality rate. The two largest agencies in Illinois, the State Police and the Chicago Police Department, were not included. Auten (1991) warned that any attempt to generalize the data to the entire state must be done with caution.
In their study of 51 Illinois police departments, Charles et al. (1992), conducted four separate surveys: an officer survey, an administrative survey, a police field interview form and an administrative telephone survey. In the officer survey segment officers reported 875 pursuits (Falcone et al., 1992). The accident rate of the 875 pursuits was 34 percent (n = 298), the injury rate was 17 percent (n = 149) and the fatality rate was 2 percent (n = 15). Differences in reporting existed between the administrative and officer surveys. The administrative section reported a pursuit accident rate of 26 percent, a 9 percent injury rate and no fatalities. Researchers conjectured that some “telescoping” of data may have occurred.
Accident Outcomes from Other Studies
Alpert and Dunham (1990) cited data from the Ontario, Canada, Solicitor General’s committee report on 6,757 pursuits between 1981 and 1984. Data represent pursuit information from all police agencies in the Province of Ontario. The agencies involved ranged in size from five to 5,000 officers. The results of that report revealed an accident rate of 33 percent (n = 2246), an injury rate of 10 percent (n = 642) and a fatality rate of 0.4 percent (n = 26).
percent (n = 178), an injury rate of 5 percent (n = 37) and a 1 percent (n = 7) fatality rate (Patinkin and Bingham, 1986).
Focusing on their rural police agency experiences, the Kentucky State Police collected data from May 1989, through April 1990, using intra-agency teletypes. That study resulted in 235 pursuits with an accident rate of 23 percent (n = 53), a 6 percent (n = 13) injury rate and a 0.4 percent rate of fatality (n = 1). The lack of specificity on the method of data collection hinders a determination on validity and reliability (Oechsli, 1990).
The North Carolina Department of Motor Vehicles conducted a very limited study of pursuits by their officers from November 4,1968, through November 10, 1968, in response to the claims made by the Physicians for Automotive Safety (PAS). Fennessy et al. (1970) reported major flaws including the number of cases (n = 44), questionable questionnaire training and the short duration of the study. Of the 44 pursuits reported, 11 percent (n = 5) resulted in accidents with a 5 percent rate of injury (n = 2) and no fatalities.
The Michigan Emergency Response Study (MERS) Phase II of 197 pursuits revealed an accident rate of 33 percent (n = 65), a 17 percent (n = 33) injury rate and one fatality resulting in a 0.5 percent fatality rate. These ten studies reveal a mean accident rate of 31.5 percent, an 11.3 percent injury rate and a fatality rate of one percent (Payne, 1996b).
Accident Outcome Rates Often Questionable
An accurate number of pursuits in a particular jurisdiction may never be revealed due to underreporting of pursuits by the police. However, the reports of accidents, injuries and fatalities are less likely to be concealed owing to their outcomes, reporting requirements and public nature.
Mandatory reporting of pursuits within jurisdictions could vastly improve data collection and analysis. In the meantime, close examination of pursuit outcomes, regardless of rates, provides a useful area for research. Determining the number and nature of injuries incurred by those involved in pursuit accidents would enhance an objective analysis of pursuits. For example, in the 65 MERS accidents there were 33 injuries. The police were injured in 8 percent of the accidents (n = 5), but all of them were serious injuries. Among the 20 fleeing suspects injured, 26 percent (n = 17) suffered minor injuries and 5 percent (n = 3) were serious. Third party injuries occurred in 12 percent (n = 8) of the accidents; 11 percent (n = 7) were minor injuries and one (1.5 percent) was a fatality. The police were the least likely to be injured. Third parties were somewhat more likely to be injured than the police, and fleeing suspects were most likely to be injured. These figures are limited to the 197 MERS pursuits and the 65 resultant accidents, thus no inferences are possible.
This particular analysis examines the relative seriousness of MSP pursuits by comparing the rates of pursuit accident outcomes identified in MERS to the outcomes of the general population accidents. Comparisons are also made with outcomes of non-pursuit state police accidents. Two research questions were examined. The first examined injury and fatality rates of pursuits and general population accidents. The second addressed the relationships between pursuit accidents and all other non-pursuit MSP accidents by examining injuries and fatalities. A pursuit for purposes of this study was defined as a situation in which the
offender was obviously attempting to elude the police by increasing speed or taking other evasive action. Those circumstances that require emergency lights and sirens whether you used them or not ( Payne, 1991).
METHOD
and motor carrier officers (N = 115), who enforce motor carrier and equipment laws.
The Design of MERS
MERS consisted of three phases. Phase I involved the administration of a 64 question survey instrument to sworn officers (n = 2,220) of the Michigan State Police (MSP) in January, 1991, and focused on pursuit policy issues (Britz and Payne, 1994; Payne and Corley, 1994). Phase II, conducted from June 23, 1991, through May 31, 1992, involved three sections administered to all road patrol and motor carrier officers of MSP. Section one, a 15 question instrument, was completed each time an officer was involved in high speed driving during each of four selected weeks throughout the year (n = 5,004), but did not include pursuits as defined. Section two involved the first 27 questions of the 58 question survey instrument. A survey was completed each time an officer was involved in a response to an alarm (n = 36), a medical emergency (n = 57) or a crime in progress (n = 59) during each of the four sample weeks. Section three involved a self-administered 58 question survey instrument to be completed each time an officer on patrol (n = 1,293) was engaged in a pursuit throughout the year.
Phase III, conducted in 1994, consisted of a ten-question follow-up direct mail survey designed to verify the pursuit portion of phase II and to explore the level of participation and reasons why officers failed to participate.
Phase II of MERS was designed with three basic purposes in mind. One purpose was to obtain pursuit data specific to Michigan that included environmental and officer behavior information. A second purpose was to utilize the data to aid in formulating a state-wide police pursuit policy, and to develop a reporting system for recording environmental and behavioral factors of future pursuits. Finally, the study was to serve as a model for future police pursuit research involving Michigan’s county and municipal police agencies. Data derived from the survey instrument distributed to other police agencies could be used to determine the level of generalizability of MERS and provide a broader database on which to base future policy decisions.
Rationale
from inaccuracy due to an increasing lack of interest over time. Moreover, it would have been difficult to secure cooperation from supervisors due to real or imagined competition such a project presented to daily police duties. However, data on driving incidents occurring under a variety of road, weather and traffic conditions was viewed as desirable to obtain. It was decided the sampling method described earlier would present an adequate picture while buffering the negative effects of a department-wide year round survey.
Survey Design Phase II
The survey instrument consisted of 58 questions. Questions 1-27 were designed to collect environmental information and police-respondent demographics regarding all emergency driving. Questions 28-52 were restricted to data pertaining only to pursuits. Questions 53-58 recorded pursuit accident data. After pilot testing the instrument, several measures were taken to insure anonymity and compliance. Completed surveys were deposited by participating officers into central receptacles at each location and mailed directly to the primary researcher after each quarter by MSP post commanders. The mailings included all pursuits for each quarter as well.
Supplemental Data
General population and non-pursuit MSP accident data were obtained from OHSP. The latest general population accident statistics available were for 1991. Pursuit survey accident data were compared to the means of the OHSP civilian accident statistics covering the five-year period from 1987 through 1991. It was felt this method would provide reasonable figures for comparison with survey data, as well as limiting the effect of unusual aberrations.
FINDINGS
Because the general population traffic accident data were not available for the entire period covered by the MERS, the three and five-year means of the general population data were calculated for comparison with the MERS data. Table 1 provides accident frequencies and the percentages of property damage accidents, injuries and fatalities.
Data for non-pursuit state police accidents were available for the three-year period of 1988 through 1990 and are presented in Table 2 with rates of property damage, injury and fatal accidents.
A comparison of the mean rate of injury accidents experienced by the MSP to those of the general population three-year mean for the 1988 to 1990 period reveals that the MSP 24 percent rate is not significantly
Table 1
GENERALPOPULATIONACCIDENTS BYYEARPERCENT BYPROPERTY
DAMAGE, PERSONALINJURY ANDFATALITY
All Property damage Personal injury Fatality
Year accidents N % N % N %
1987 397,224 291,427 73 105,797 27 1,452 0.36 1988 410,437 305,371 74 105,066 26 1,522 0.37 1989 417,252 313,069 75 104,183 25 1,463 0.35 1990 387,180 289,701 75 97,479 25 1,396 0.36 1991 364,847 273,368 75 91,479 25 1,290 0.35 Five-year mean
(1987-91) 395,388 294,587 75 100,800 25 1,425 0.36 Three-year mean
(1988-90) 404,956 302,713 75 102,243 25 1,460 0.36
Table 2
MSP ACCIDENTS1988-1990
PERCENT BYPROPERTYDAMAGE, PERSONALINJURY ANDFATALITY
All Property damage Personal injury Fatality
Year accidents N % N % N
1988 326 253 77 74 23 0
1989 335 253 75 83 25 0
1990 346 258 75 88 25 0
different (Z = 0.39) from the 25 percent general population rate as revealed in Table 3. Likewise, as noted in Table 3, the three-year MSP rate is not significantly different (Z = 0.49) than the five-year general population mean injury accident rate. These police accidents in general do not appear to be markedly different than the general population accident experience. Media attention may be hyped on this subject and such attention may create a spillover affect on all police accidents, including those involving pursuits.
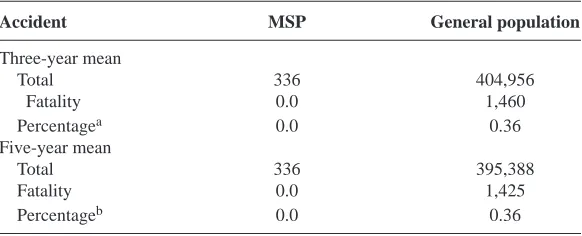
The examination of the three-year MSP fatal accident rate with the three and five-year general population mean fatal accident rates is presented in Table 4. Again, no significant differences (Z = 1.10) were found when comparing three-year MSP fatal accident experience with the three-year general population mean. As might be expected with the scant fatal accident experience of these two groups, comparing the three-year MSP rate with the five-year general population mean did not reveal any significant difference either (Z = 1.10). Table 3 and Table 4 reveal that there is no significant difference in frequencies of injury or fatal accidents when comparing the three-year mean MSP accidents to the general population three and five-year means.
The MERS recorded 65 accidents from a total of 197 reported pursuits for an accident rate of 33 percent. Of those, 30 accidents (46 percent) involved personal injury and one (1.5 percent) involved a fatality to an innocent third party. Table 5 reflects compansons of the MERS
Table 3
MSP THREE-YEARINJURYRATE WITHTHREE ANDFIVE-YEAR
GENERALPOPULATIONMEANINJURYRATES
Accident MSP General population
Three-year mean
Total 336 404,956
Injury 82 102,243
Percentagea 24.33 25
Five-year mean
Total 336 395,388
Injury 82 100,800
Percentageb 24.33 26
aZ = 0.39; p > 0.05
injury rate with the three and five-year mean general population injury rates.
As shown in Table 5, the MERS 46 percent injury rate is significantly higher (Z = 4.16) than the 25 percent three-year general population injury rate. Moreover, the injury rate in the MERS accidents is significantly higher (Z = 4.11) than the 26 percent injury rate found in the five-year general population mean. The likelihood of injury is greater in
Table 4
MSP THREE-YEARFATALITYRATES WITHTHREE ANDFIVE-YEAR
GENERALPOPULATIONMEANFATALACCIDENTRATES
Accident MSP General population
Three-year mean
Total 336 404,956
Fatality 0.0 1,460
Percentagea 0.0 0.36
Five-year mean
Total 336 395,388
Fatality 0.0 1,425
Percentageb 0.0 0.36
aZ = 1.10; p > 0.05
bZ = 1.10; p > 0.05
Table 5
MERS ANDGENERALPOPULATIONTHREE ANDFIVE-YEARMEAN
INJURYRATES
Accidents MSP General population
Three-year mean
Total 65 404,956
Injury 30 102,242
Percentagea 46.15 25.25
Five-year mean
Total 65 395,388
Injury 30 100,800
Percentageb 46.15 26
aZ = 4.16; p > 0.05
pursuit accidents than among those experienced by the general population. The likelihood of injuries resulting from pursuits is also greater than the non-pursuit police accidents.
In Table 6, the MERS fatality rate is compared to the three and five-year general population fatality means. The companson of the MERS rate did not reveal any significant differences (Z = 1.58) with the three-year general population mean. Likewise, significant differences (Z = 1.59) were not found with the five-year general population mean. MERS pursuit fatalities do not occur with any greater frequency than the general population mean rate of fatalities for the period covered.
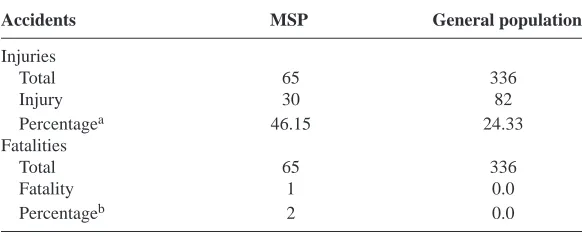
The MSP injury and fatal mean accident rates (see Table 2) for the years 1988 through 1990 were compared to the MERS injury and fatal accident rates and are reflected in Table 7. The MERS rate of 46 percent is significantly higher (Z = 3.59) than the 24 percent MSP injury accident mean rate. The reported MERS pursuit accidents involved injuries more often than the mean of all accidents involving the Michigan State Police from 1988 through 1990. As might be expected, considering there were no fatalities among the MSP three-year accidents, there is a significant difference (Z = 2.28) between the MERS 2 percent fatal rate and the zero percent fatal accident rate of the MSP three-year mean. Thus, given the available data, the MERS pursuit accidents have a greater rate of injury and fatality than the overall MSP accidents for the three-year period of 1989 through 1990.
Table 6
MERS ANDGENERALPOPULATIONTHREE ANDFIVE-YEARMEAN
FATALITYRATES
Accidents MSP General population
Three-year mean
Total 65 404,956
Fatality 1 1,460
Percentagea 1.54 0.36
Five-year mean
Total 65 395,388
Fatality 1 1,425
Percentageb 1.54 0.36
aZ = 1.58; p > 0.05
DISCUSSION
Regardless of the number of pursuits reported in different locales, interesting similarities occurred in the examination of the literature. The Ontario study (Alpert and Dunham, 1990) reflected a 33 percent accident rate on 6,757 pursuits and was identical to the Miami-Dade study rate (Alpert and Dunham, 1990) on 952 pursuits and MERS (Payne, 1993) on 197 pursuits. The Illinois study (Falcone et al., 1992) is quite close with a 34 percent accident rate on 875 pursuits. The MSU accident rate (Beckman, 1986) was 42 percent on 424 pursuits whereas the Illinois study (Auten, 1991) was 41 percent on 286 pursuits. The CHP study (1983) reflects a 29 percent accident rate on 683 pursuits. Similarly, the Chicago rate (Patinkin and Bingham, 1986) was 24 percent on 741 pursuits, while the Kentucky State Police study (Oechsli, 1990) was 23 percent on 235 pursuits.
Among these nine studies the mean rate of fatalities was 1 percent, with a low of 0.4 percent in the Kentucky State Police study (Oechsli, 1990) and a high of 3 percent in the MSU study (Beckman, 1986). The overall injury rate was 12 percent. The Miami-Dade, Illinois (1992) and MERS all report a 17 percent pursuit injury rate. Ontario, Illinois (1991), MSU and CHP had a mean injury rate of 12 percent, whereas Chicago and Kentucky state police report a 6 percent rate.
The MERS pursuit accident injury rate, though higher than that of Michigan’s general population and higher than the MSP overall, was
Table 7
COMPARISON OFMERS ANDMSP INJURY ANDFATALITYACCIDENTRATES
Accidents MSP General population
Injuries
Total 65 336
Injury 30 82
Percentagea 46.15 24.33
Fatalities
Total 65 336
Fatality 1 0.0
Percentageb 2 0.0
aZ = 3.59; p > 0.05
similar to that reported by Alpert and Dunham (1990). The MERS fatal accident rate was higher than that reported for the MSP overall, but not significantly higher than the general Michigan population rate. The fatal accident rate, as reported here, was similar to that reported in the Miami-Dade study of Alpert and Dunham (1990) and lower than that reported in the CHP (1983) study.
It is not surprising to find pursuit accident injuries occur at significantly higher rates than the general population’s experience, or for that matter, than police non-pursuit accident experience. Police administrators interested in reducing injuries resulting from pursuits should seriously consider restrictive policies, closer supervision of pursuits and enhanced pursuit driving training with an emphasis on accident avoidance. Some police administrators might mistakenly conclude accidents and their negative outcomes are the inevitable result of doing police work.
Injury reduction interventions should be focussed on critical factors involved in the accidents under study. An examination of pursuit accident reports and the institution of after-action debriefings may be useful to police administrators who contemplate changing the level of policy restrictiveness. Moreover, making pursuit records available to researchers or other interested parties could provide police administrators with objective reviews and analyses. Such innovations would reduce the chances of organizational bias and might provide administrators with defensible foundations for policy change.
The fact that the MERS fatal accident rate was not significantly higher than the Michigan general population mean rates raises some interesting questions and implications. Considering the significantly higher rate of injuries of MERS pursuits to those of the compared groups, conventional wisdom might suggest a higher fatality rate. Whether this outcome is a fluke or has some reasonable explanation is unknown and has not been examined empirically.
explanations could of course be challenged by the fact that the non-fatal injury rates were significantly higher than the comparable groups.
Furthermore, the National Highway Traffic Safety Annals from 1984 to 1991 would indicate Michigan’s pursuit fatality rates for all departments were indeed higher than the general population rates. During the eight-year period of 1984 to 1991, Michigan had 12,596 general population fatalities with an annual average of 1,575 deaths. Prior to 1990, Michigan averaged 400,000 accidents annually, thus the general population fatal accident rate was 0.4 percent. During the same period, 98 pursuit fatalities occurred averaging 12 such deaths per year. Pursuit accident data were not uniformly reported, but the three-year period of 1987 to 1989 revealed an annual average of 954 pursuit accidents and ten pursuit fatalities per year. For this period the pursuit fatality rate was more than twice (1 percent) as high as the general population. Extreme caution should be used in interpreting these figures as they are estimates based on a limited number of years.
Data are not available to conclude that state police driving practices are safer or uniquely different than other police departments. The state police pursuit driving program is more rigorous than other departments in the state. In the past several years the MSP has implemented an intense driving program at a state of the art driving facility. The emphasis includes practical driving exercises, classroom instruction, an increased emphasis on supervisory responsibility and a revised pursuit policy. Video tapes of actual pursuits are viewed by officers in the field. Overall, the state police pursuit policy can be described as an officer judgment model.
Several problems surface when attempting to determine the scope and seriousness of police pursuits and their outcomes. Different methodologies, means of reporting, the number and size of police agencies and the methods used to determine rates are but a few of the problems. A mandatory police pursuit reporting system, supported with centralized data collection and analyses, would not only enhance research in this critical area of police operations, but could establish a solid database useful for the construction of reasonable and realistic public policy.
a new Governor and subsequent budget reductions resulted in demotions and transfers within the MSP. Such personnel actions may have influenced morale and reporting by respondents. The MERS study, as well as this analysis, should not be generalized to other police agencies. To the degree that another state police agency may be similar to the MSP in size, jurisdiction, geography and scope of work this analysis may be useful. Caution should be used in applying these results to other jurisdictions, and because only one state agency was studied generalizing is not possible. Several similarities do exist among different studies and the results point in the same direction. Future research of officers’ pursuit behaviors, pursuit outcomes as contrasted with established policies, and external analysis of pursuit accident reports could be useful in answering questions posed in this study.
REFERENCES
Abbott, L. (1988), “Police pursuit driving”, FBI Law Enforcement Bulletin, Vol. 57 No. 11, pp. 7-11.
Alpert, G.P. and Dunham, R.G. (1989), “Police hot pursuits: the discovery of aleatory elements”, The Journal of Criminal Law and Criminology, Vol. 13 No. 2, pp. 521-39.
Alpert, G.P. and Dunham, R.G. (1990), Police Pursuit Driving: Controlling
Responses to Emergency Situations, Greenwood, New York, NY.
Alpert, G.P. and Smith, W.C. (1991), “Beyond city limits and into the woods: a brief look at the policy impact of City of Canton v. Harris and Wood v. Ostander”,
American Journal of Police, Vol. 10 No. 1, pp. 19-40.
Auten, J.H. (1985), Law Enforcement Driving, Charles C. Thomas, Springfield, IL.
Auten, J.H. (1990), “An analysis of police pursuit policy”, Law and Order, November, pp. 53-4.
Auten, J.H. (1991), Police Pursuit Driving Operations in Illinois: 1990, University of Illinois, Champaign, IL.
Beckman, E. (1986), “Pursuit driving: a report to law enforcement on factors in police pursuits”, Michigan Police Chiefs Newsletter, May, pp. 26-34.
Britz, M. and Payne, D.M. (1994), “Policy implications for law enforcement pursuit driving”, American Journal of Police, Vol. 13 No. 2, pp. 113-42.
California Highway Patrol (1983), California Highway Pursuit Study, CHP, Sacramento, CA.
Charles, M.T. and Falcone, D.N. (1992), “Illinois police officers’ opinions on police pursuit issues”, American Journal of Police, Vol. 11 No. 3, pp. 69-88.
Charles, M.T., Falcone, D.N. and Wells, L.E. (1992), Police in Pursuit of Policy:
The Pursuit Issue, Legal and Literature Review, and Empirical Study, AAA
Foundation for Traffic Safety, Washington, DC.
Clark, J.M. Jr (1976), Emergency and High Speed Driving Techniques, Gulf, Houston, TX.
Dougherty, E.E. (1961), Safety in Police Pursuit Driving, Charles C. Thomas, Springfield, IL.
Dunham, R.G. and Alpert, G.P. (1991), “Understanding the dynamics of officer age and gender in police pursuits”, American Journal of Police, Vol. 10 No. 3, pp. 51-61.
Falcone, D.N. (1994), Police pursuits and officer attitudes: myths and realities”,
American Journal of Police, Vol. 13 No. 4, pp. 143-55.
Falcone, D.N., Wells, L.E. and Charles, M.T. (1992), Police Pursuit: In Pursuit of
Policy: The Empirical Study, AAA Foundation for Traffic Safety, Washington,
DC.
Fennessy, E.F., Hamilton, T., Joscelyn, K. and Merritt, J.S. (1970), A Study of the
Problem of Hot Pursuit by the Police, The Center for the Environment and Man,
Hartford, CT.
Fyfe, J.J. (1989), “Controlling police vehicle pursuits”, in Fyfe, J.J. (Ed.), Police
Practice in the 90s: Key Management Issues, International City Management
Association, Washington, DC.
Ghannam, J.S. and Andrews, S. (1993), “Police examine the risk of pursuit”,
Detroit Free Press, January 19, pp. 1a-8a,
Halloran, J. (1985), “Driving programs teach safer, yet quicker pursuit”, Law and
International Association of Chiefs of Police (1965), Safe Driving Techniques (Training Key 20), IACP, Washington, DC.
International Association of Chiefs of Police (1968), Safe Driving Techniques (Training Key 92), IACP, Washington, DC.
James, C. (1980), “The National Academy for Police Driving”, Police Product
News, May, pp. 47-8, 86-8.
Kennedy, D.B., Homant, R.J. and Kennedy, J.F. (1992), “A comparative analysis of police vehicle pursuit policies”, Justice Quarterly, Vol. 9, pp. 227-46.
Kroeker, M. and McCoy, C. (1988), “Establishing and implementing department policies”, The Police Chief, Vol. 55 No. 12, pp. 34-40.
Morris, E.R. (1993), “Modifying pursuit behavior: the 9 Ts approach”, FBI Law
Enforcement Bulletin, January, pp. 1-6.
National Highway Traffic Safety Administration (1992), Annals, USGPO, Washington, DC.
Oechsli, S. (1990), Kentucky State Police Pursuit Study 1989-90, National Institute of Justice, Rockville, MD.
Patinkin, H.P. and Bingham, H. (1986), “Police motor vehicle pursuits: the Chicago experience”, The Police Chief, Vol. 53 No. 7, pp. 61-2.
Payne, D.M. (1991), Michigan Emergency Response Study, Payne, East Lansing, MI.
Payne, D.M. (1993), Preliminary Report of Findings: MERS, Report to the
Director of the Michigan Department of State Police, January, East Lansing, MI.
Payne, D.M. (1996a), “The difficulty in obtaining accurate pursuit data: are the police their own worse enemies?”, unpublished manuscript.
Payne, D.M. (1996b), “Michigan Emergency Response Study: Phase II: a research note”, unpublished manuscript.
Payne, D.M. and Corley, C. (1994), “Police pursuits: correlates of the failure to report”, American Journal of Police, Vol. 13 No. 4, pp. 47-72.
Schultz, D.O. (1979), Police Pursuit Driving Handbook, Gulf, Houston, TX.
Solicitor General Report, (1985), A Special Report on Police Pursuits, Ontario, Canada.
Territo, L. (1982), “Citizen safety: key elements in pursuit policy”, Trial, August, pp. 31-4.
Traffic Institute (1981), Pursuit in Traffic Law Enforcement, Northwestern University, Evanston, IL.
Whetsel, J. and Bennett, J.W. (1992), “Pursuits: a deadly force issue”, The Police
Chief, February, pp. 30-1.
Wisconsin Department of Justice (1984), “Use pursuit guidelines”, Training
Guide for Law Enforcement Officers, (Section 8.2), Wisconsin, DOJ, Madison,