Lampiran 1 Listing Program
1. Listing Program Tabel Perhitungan Hasil Pengujian Marshall
unit UnitMar;
interface
uses
Windows, Messages, SysUtils, Variants, Classes, Graphics, Controls, Forms, Dialogs, StdCtrls, ExtCtrls, Buttons, Grids, DBGrids, DB, DBTables, jpeg, ComCtrls;
type
TFTabel = class(TForm) Bevel1: TBevel;
Label2: TLabel; Label3: TLabel; Label1: TLabel;
GroupBox1: TGroupBox; Label4: TLabel;
Label5: TLabel; Label6: TLabel; Label7: TLabel; Label8: TLabel; Label9: TLabel; Label10: TLabel; Label12: TLabel; edkor: TEdit; edU: TEdit; gram: TLabel; Label13: TLabel; Label14: TLabel; Label15: TLabel; Label16: TLabel; BitBtn1: TBitBtn; BitBtn2: TBitBtn; BitBtn3: TBitBtn; edA: TEdit; edC: TEdit; edE: TEdit; edF: TEdit; edG: TEdit; edQ: TEdit;
2. Listing Program Plotting point antara % Kadar Aspal terhadap % VIM
unit Unit1;
interface
uses
Windows, Messages, SysUtils, Variants, Classes, Graphics, Controls, Forms, Dialogs, StdCtrls, Grids, DBGrids, DB, DBTables, Buttons, TeEngine, Series, ExtCtrls, TeeProcs, Chart, DbChart, ComCtrls;
type
TFGrafik1 = class(TForm) tbmar1: TTable;
tbkdvim: TTable; Session1: TSession; Database1: TDatabase; dskdvim: TDataSource; dsmar1: TDataSource; DBGrid1: TDBGrid; GroupBox1: TGroupBox; Label1: TLabel;
Label2: TLabel; Label3: TLabel; Label4: TLabel; eda: TEdit; edb: TEdit; edc: TEdit;
DBGrid2: TDBGrid; BitBtn1: TBitBtn; BitBtn2: TBitBtn; DBChart1: TDBChart; Series1: TFastLineSeries; GroupBox2: TGroupBox; Label5: TLabel;
edsy: TEdit;
DBGrid3: TDBGrid; BitBtn3: TBitBtn; BitBtn4: TBitBtn; BitBtn5: TBitBtn; dssy: TDataSource; tbsy: TTable;
StatusBar1: TStatusBar;
private
{ Private declarations } public
{ Public declarations } end;
var
FGrafik1: TFGrafik1;
implementation
{$R *.dfm}
procedure TFGrafik1.BitBtn1Click(Sender: TObject); begin
if (eda.Text<>'')and(edb.Text<>'')and(edc.Text<>'')then begin
tbkdvim.Insert;
tbkdvim['%berat thdp total camp.']:=tbmar1['%berat thdp total camp.'];
tbkdvim['VIM']:=eda.Text*tbkdvim['%berat thdp total camp.']*tbkdvim['%berat thdp total camp.']+edb.Text*tbkdvim['%berat thdp total camp.']+edc.Text;
end else
Application.MessageBox('Ada data yang belum diisi','Kesalahan',mb_OK+mb_DefButton1);
end;
procedure TFGrafik1.BitBtn2Click(Sender: TObject); begin
if application.MessageBox('Anda yakin data dihapus?','Peringatan',mb_YESNO or mb_ICONQUESTION)=IDYES then
tbkdvim.Delete; end;
procedure TFGrafik1.BitBtn4Click(Sender: TObject); begin
if application.MessageBox('Anda yakin data dihapus?','Peringatan',mb_YESNO or mb_ICONQUESTION)=IDYES then
tbsy.Delete; end;
procedure TFGrafik1.BitBtn3Click(Sender: TObject); begin
tbsy.Insert;
tbsy['X1']:=((tbsy['B']*-1)+sqrt(tbsy['B']*tbsy['B']-4*tbsy['A']*tbsy['C']))/(2*tbsy['A']);
tbsy['X2']:=((tbsy['B']*-1)-sqrt(tbsy['B']*tbsy['B']-4*tbsy['A']*tbsy['C']))/(2*tbsy['A']);
end; end.
3. Listing Program Plotting point antara % Kadar Aspal terhadap % VMA.
unit Unit1b;
interface
uses
Windows, Messages, SysUtils, Variants, Classes, Graphics, Controls, Forms, Dialogs, Grids, DBGrids, DB, DBTables, StdCtrls, Buttons, TeEngine, Series, ExtCtrls, TeeProcs, Chart, DbChart, ComCtrls;
type
TFGrafik2 = class(TForm) tbmar2: TTable;
tbsy: TTable; tbkdvma: TTable; Session1: TSession; Database1: TDatabase; dsmar: TDataSource; dssy: TDataSource; dskdvma: TDataSource; DBGrid1: TDBGrid; GroupBox1: TGroupBox; Label1: TLabel;
Label2: TLabel; Label3: TLabel; Label4: TLabel; eda: TEdit; edb: TEdit; edc: TEdit;
DBGrid2: TDBGrid; BitBtn1: TBitBtn; BitBtn2: TBitBtn; DBChart1: TDBChart; Series1: TFastLineSeries; BitBtn3: TBitBtn;
GroupBox2: TGroupBox; Label5: TLabel;
edsy: TEdit;
BitBtn4: TBitBtn; BitBtn5: TBitBtn; StatusBar1: TStatusBar;
procedure BitBtn1Click(Sender: TObject); procedure BitBtn2Click(Sender: TObject); procedure BitBtn4Click(Sender: TObject); private
{ Private declarations } public
{ Public declarations } end;
var
FGrafik2: TFGrafik2;
implementation
{$R *.dfm}
procedure TFGrafik2.BitBtn1Click(Sender: TObject); begin
if(eda.Text<>'')and(edb.Text<>'')and(edc.Text<>'')then begin
tbkdvma.Insert;
tbkdvma['%berat thdp total camp.']:=tbmar2['%berat thdp total camp.'];
tbkdvma['VMA']:=(eda.Text*(tbkdvma['%berat thdp total camp.']*tbkdvma['%berat thdp total camp.']))+(edb.Text*tbkdvma['%berat thdp total camp.'])+edc.Text; end
else
Application.MessageBox('Ada data yang belum diisi','Kesalahan',mb_OK+mb_DefButton1);
end;
procedure TFGrafik2.BitBtn2Click(Sender: TObject); begin
if application.MessageBox('Anda yakin data dihapus?','Peringatan',mb_YESNO or mb_ICONQUESTION)=IDYES then
tbkdvma.Delete; end;
procedure TFGrafik2.BitBtn4Click(Sender: TObject); begin
tbsy.Insert;
tbsy['X1']:=((tbsy['B']*-1)+sqrt(tbsy['B']*tbsy['B']-4*tbsy['A']*tbsy['C']))/(2*tbsy['A']);
tbsy['X2']:=((tbsy['B']*-1)-sqrt(tbsy['B']*tbsy['B']-4*tbsy['A']*tbsy['C']))/(2*tbsy['A']);
end;
end.
4. Listing Program Plotting point antara % Kadar Aspal terhadap stabilitas
unit Unit1d;
interface
uses
Windows, Messages, SysUtils, Variants, Classes, Graphics, Controls, Forms, Dialogs, Grids, DBGrids, DB, DBTables, StdCtrls, Buttons, TeEngine, Series, ExtCtrls, TeeProcs, Chart, DbChart, ComCtrls;
type
TFGrafik4 = class(TForm) dsmar4: TDataSource; dskdst: TDataSource; tbmar4: TTable; tbkdst: TTable; Session1: TSession; Database1: TDatabase; DBGrid1: TDBGrid; DBGrid2: TDBGrid; BitBtn1: TBitBtn; BitBtn2: TBitBtn; BitBtn3: TBitBtn; DBChart1: TDBChart; StatusBar1: TStatusBar; Series1: TPointSeries;
procedure BitBtn1Click(Sender: TObject); procedure BitBtn2Click(Sender: TObject); private
{ Private declarations } public
{ Public declarations } end;
var
FGrafik4: TFGrafik4;
{$R *.dfm}
procedure TFGrafik4.BitBtn1Click(Sender: TObject); begin
tbkdst.Insert;
tbkdst['%berat thdp total camp.']:=tbmar4['%berat thdp total camp.']; tbkdst['Stabilitas']:=tbmar4['Koreksi volume'];
end;
procedure TFGrafik4.BitBtn2Click(Sender: TObject); begin
if application.MessageBox('Anda yakin data dihapus?','Peringatan',mb_YESNO or mb_ICONQUESTION)=IDYES then
tbkdst.Delete; end;
end.
5. Listing Program Plotting point antara % Kadar Aspal dengan Flow.
unit Unit1; interface uses
Windows, Messages, SysUtils, Variants, Classes, Graphics, Controls, Forms, Dialogs, StdCtrls, Grids, DBGrids, DB, DBTables, Buttons, TeEngine, Series, ExtCtrls, TeeProcs, Chart, DbChart, ComCtrls;
type
TFGrafik5 = class(TForm) tbmar5: TTable;
tbsy: TTable; tbkdf: TTable;
Database1: TDatabase; Session1: TSession; dssy: TDataSource; dskdf: TDataSource; dsmar5: TDataSource; DBGrid1: TDBGrid; GroupBox1: TGroupBox; Label1: TLabel;
edb: TEdit; edc: TEdit;
DBGrid2: TDBGrid; BitBtn1: TBitBtn; BitBtn2: TBitBtn; BitBtn3: TBitBtn; DBChart1: TDBChart; Series1: TFastLineSeries; GroupBox2: TGroupBox; Label5: TLabel;
edsy: TEdit; BitBtn4: TBitBtn; BitBtn5: TBitBtn; DBGrid3: TDBGrid; StatusBar1: TStatusBar;
procedure BitBtn1Click(Sender: TObject); procedure BitBtn2Click(Sender: TObject); procedure BitBtn4Click(Sender: TObject); private
{ Private declarations } public
{ Public declarations } end;
var
FGrafik5: TFGrafik5;
implementation
{$R *.dfm}
procedure TFGrafik5.BitBtn1Click(Sender: TObject); begin
if(eda.Text<>'')and(edb.Text<>'')and(edc.Text<>'')then begin
tbkdf.Insert;
tbkdf['%berat thdp total camp.']:=tbmar5['%berat thdp total camp.'];
tbkdf['Flow']:=(eda.Text*(tbkdf['%berat thdp total camp.']*tbkdf['%berat thdp total camp.']))+(edb.Text*tbkdf['%berat thdp total camp.'])+edc.Text;
end else
Application.MessageBox('Ada data yang belum diisi','Kesalahan',mb_OK+mb_DefButton1);
end;
if application.MessageBox('Anda yakin data dihapus?','Peringatan',mb_YESNO or mb_ICONQUESTION)=IDYES then
tbkdf.Delete; end;
procedure TFGrafik5.BitBtn4Click(Sender: TObject); begin
tbsy.Insert;
tbsy['Y']:=floattostr(strtofloat(edsy.Text)); tbsy['A']:=floattostr(strtofloat(eda.Text)); tbsy['B']:=floattostr(strtofloat(edb.Text)); tbsy['C']:=edc.Text-tbsy['Y'];
tbsy['X1']:=((tbsy['B']*-1)+sqrt(tbsy['B']*tbsy['B']-4*tbsy['A']*tbsy['C']))/(2*tbsy['A']);
tbsy['X2']:=((tbsy['B']*-1)-sqrt(tbsy['B']*tbsy['B']-4*tbsy['A']*tbsy['C']))/(2*tbsy['A']);
end;
end.
6. Listing Program Plotting point % Kadar Aspal dengan Marshall Quotient
unit Unit1c;
interface
uses
Windows, Messages, SysUtils, Variants, Classes, Graphics, Controls, Forms, Dialogs, TeEngine, Series, ExtCtrls, TeeProcs, Chart, DbChart, StdCtrls, Buttons, Grids, DBGrids, DB, DBTables, ComCtrls;
type
procedure BitBtn1Click(Sender: TObject); procedure BitBtn2Click(Sender: TObject); private
{ Private declarations } public
{ Public declarations } end;
var
FGrafik3: TFGrafik3;
implementation
{$R *.dfm}
procedure TFGrafik3.BitBtn1Click(Sender: TObject); begin
tbkdbervol.Insert;
tbkdbervol['%berat thdp total camp.']:=tbmar3['%berat thdp total camp.']; tbkdbervol['Marshall Quotient']:=tbmar3['Marshall Quotient'];
end;
procedure TFGrafik3.BitBtn2Click(Sender: TObject); begin
if application.MessageBox('Anda yakin data dihapus?','Peringatan',mb_YESNO or mb_ICONQUESTION)=IDYES then
tbkdbervol.Delete; end;
end.
7. Listing Program Kadar Aspal Optimum.
unit Unit1;
interface
uses
Windows, Messages, SysUtils, Variants, Classes, Graphics, Controls, Forms, Dialogs, DB, DBTables, Grids, DBGrids, StdCtrls, ComCtrls, ExtCtrls, TeeProcs, TeEngine, Chart, Buttons, Series;
type
tbsy2: TTable; tbsy3: TTable; dssy1: TDataSource; dssy2: TDataSource; dssy3: TDataSource; GroupBox2: TGroupBox; GroupBox3: TGroupBox; DBGrid2: TDBGrid; DBGrid3: TDBGrid; GroupBox4: TGroupBox; Label1: TLabel;
Label2: TLabel; Label3: TLabel; Label4: TLabel; Label5: TLabel; Label6: TLabel; Label7: TLabel; Label8: TLabel; Label9: TLabel; Label10: TLabel; Label11: TLabel; Label12: TLabel; Edit1: TEdit; Edit2: TEdit; Edit3: TEdit; Edit4: TEdit; Edit5: TEdit; Edit6: TEdit; Edit7: TEdit; Edit8: TEdit; BitBtn1: TBitBtn; BitBtn2: TBitBtn; Chart1: TChart;
Series1: THorizBarSeries; Series2: THorizBarSeries; Series3: THorizBarSeries; Series4: THorizBarSeries; Series5: THorizBarSeries; Series6: THorizBarSeries; Series7: THorizBarSeries; Series8: THorizBarSeries;
procedure BitBtn1Click(Sender: TObject); private
{ Private declarations } public
var
Fkadar: TFkadar;
implementation
{$R *.dfm}
procedure TFkadar.BitBtn1Click(Sender: TObject); begin
series1.AddBar(strtofloat(Edit1.Text),'Stabilitas',clred); series2.AddBar(strtofloat(Edit2.Text),'',clltgray); series3.AddBar(strtofloat(Edit3.Text),'Flow',clblue); series4.AddBar(strtofloat(Edit4.Text),'',clltgray); series5.AddBar(strtofloat(Edit5.Text),'VIM',clyellow); series6.AddBar(strtofloat(Edit6.Text),'',clltgray); series7.AddBar(strtofloat(Edit7.Text),'VMA',clnavy); series8.AddBar(strtofloat(Edit8.Text),'',clltgray); end;
end.
8. Listing Program Regresi
program Project1;
{$APPTYPE CONSOLE}
uses SysUtils;
var
x,y : array [0..10] of real; xp,yp : real;
n,M : integer;
sum_x : array [0..20] of real; sum,c : array [0..10,0..10] of real; a,b : array [0..10] of real;
i,j,k : integer;
g : array [0..10,0..11] of real; dummy, factor : real;
procedure simultan;//(n :integer; A :array [0..10,0..10] of real;var b : array [0..10] of real) ;
begin
{ TODO -oUser -cConsole Main : Insert code here } for i:=0 to n-1 do
for j:=0 to n-1 do g[j][n] := b[j];
for i:=0 to n-1 do begin
dummy := abs(g[i][i]); k := i;
for j:=i+1 to n-1 do
if abs (g[j][i])>dummy then begin
dummy := abs(g[j][i]); k := j;
end;
if k <> i then for j:=i to n do begin
dummy := g[k][j]; g[k][j] := g[i][j]; g[i][j] := dummy; end;
for j:=i to n-1 do begin
if i <> j then begin
factor := g[j][i]/g[i][i]; for k:=i to n do
g[j][k] := g[j][k] - factor * g[i][k]; end;
end; end;
for i:=0 to n-1 do b[i] := g[i][n]/g[i][i]; end;
function pow(x : real; n : integer) : real; var
i : integer; p : real; begin p := 1;
if n > 0 then for i:=1 to n do p := p * x; pow := p;
end;
begin
write('jumlah data :'); readln(n);
begin
write('x[',i+1:2,'], y[',i+1:2,'] ='); read(x[i], y[i]);
end;
write('ordo polinomial :'); read(M);
for i:=0 to 2*M do sum_x[i] := 0; sum_x[0] := n;
for i:=0 to n-1 do for j:=1 to 2*M do
sum_x[j] := sum_x[j] + pow(x[i],j);
for i:=0 to M do for j:=0 to M do
sum[i][j] := sum_x[i+j];
a[0] := 0;
for j:=0 to n-1 do a[0] := a[0] + y[j];
for i:=1 to M do begin
a[i] := 0;
for j:=0 to n-1 do
a[i] := a[i] + pow(x[j],i) * y[j]; end;
//simultan(M+1,sum,a);
writeln('koefisien fungsi regresi polinomial :'); for i:=0 to M do
writeln('a[',i:2,'] =',a[i]:10:5);
write('input harga x :'); read(xp);
yp := a[0]; for i:=1 to M do
yp := yp + a[i] * pow(xp,i);
writeln('Nilai y :', yp:10:5);
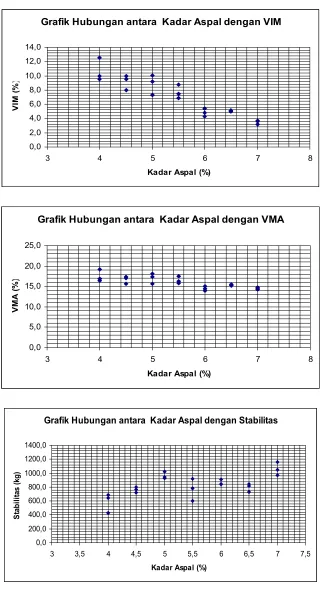
Lampiran 2 Grafik Hubungan Kadar Aspal dengan Parameter Marshall
Grafik Hubungan antara Kadar Aspal dengan VIM
0,0 2,0 4,0 6,0 8,0 10,0 12,0 14,0
3 4 5 6 7
Kadar Aspal (%)
VIM
(
%
8
)
Grafik Hubungan antara Kadar Aspal dengan VMA
0,0 5,0 10,0 15,0 20,0 25,0
3 4 5 6 7
Kadar Aspal (%)
VM
A
(
%
8
)
Grafik Hubungan antara Kadar Aspal dengan Stabilitas
0,0 200,0 400,0 600,0 800,0 1000,0 1200,0 1400,0
3 3,5 4 4,5 5 5,5 6 6,5 7 7,5
Kadar Aspal (%)
S
tab
il
itas (kg
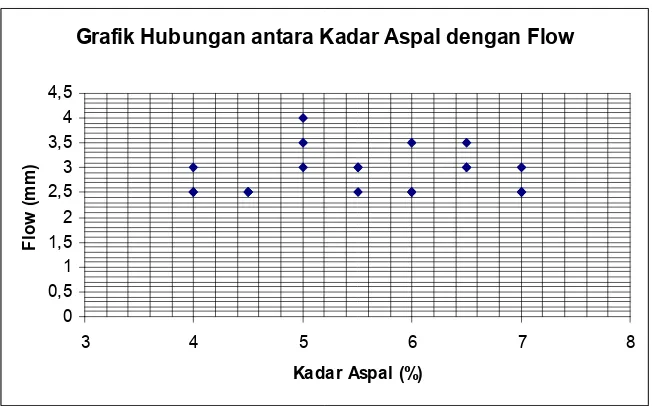
Grafik Hubungan antara Kadar Aspal dengan Flow
0 0,5 1 1,5 2 2,5 3 3,5 4 4,5
3 4 5 6 7 8
Kadar Aspal (%)
Fl
ow
(
m
m
)
Grafik Hubungan antara Kadar Aspal dengan Marshall Quotient
0,0 100,0 200,0 300,0 400,0 500,0
3 3,5 4 4,5 5 5,5 6 6,5 7 7,5
Kadar Aspal (%)
Ma
rs
ha
ll
Q
u
o
ti
e
nt
(k
g
Kadar Aspal Optimum
4 4,2 4,4 4,6 4,8 5 5,2 5,4 5,6 5,8 6 6,2 6,4 6,6 6,8 7 VMA
VIM Stabilitas Flow Marshall Quotient
Kadar Aspal (%)
Kadar Aspal Optimum = 6,2
2 7 , 6 7 , 5
= +
%
Lampiran 3 Tabel Persyaratan Campuran Beton Aspal
L.L Berat (2 x 75) Tumbukan
L.L Sedang (2 x 50) Tumbukan
L.L Ringan (3 x 35) Tumbukan Sifat Campuran
Min Maks Min Maks Min Maks
Stabilitas(kg) 550 - 450 - 350 -
Flow (mm) 2 4 2 4,5 2 5
Stabilitas/Flow(kg/mm) 200 350 200 350 200 350
VIM (%) 3 5 3 5 3 5
VMA(%) Lihat lampiran 4
Catatan:
1. VIM dihitung berdasarkan Gmm atau berdasarkan Gmm menurut AASHTO T209-82
2. VMA ditetapkan berdasarkan Gsb dari agregat.
3. Kepadatan Lalu Lintas
Berat = lebih besar 500 UE 18 KSAL/hari/jalur. Sedang = 50 sampai 500 UE 18 KSAL/hari/jalur. Ringan = lebih kecil 50 UE 18 KSAL/hari/jalur.
Lampiran 4 Tabel Persyaratan VMA
Ukuran Maksimum Nominal Agregat
No.8 2,36 mm 21
No.4 4,75 mm 18
3/8 inch 9,50 mm 16
½ inch 12,50 mm 15
¾ inch 19,00 mm 14
1 inch 25,00 mm 13
1,5 inch 37,50 mm 12
2 inch 50,00 mm 11,5
2,5 inch 63,00 mm 11
Lampiran 5 Tabel Angka Koreksi Stabilitas
Isi Benda Uji Tinggi Benda Uji
cm3 Inchi mm Angka Koreksi
200-213 1 25,4 5,56
214-225 1 1/16 27,0 5,00
226-237 1 1/8 28,6 4,55
238-250 1 3/16 30,2 4,17
252-264 1 1/4 31,8 3,86
265-276 1 5/16 33,3 3,57
277-289 1 3/8 34,9 3,33
290-301 1 7/16 36,5 3,03
302-316 1 1/2 38,1 2,78
317-328 1 9/16 39,7 2,50
329-340 1 5/8 41,3 2,27
342-353 1 11/16 42,9 2,08
354-367 1 3/4 44,4 1,92
368-379 1 13/16 46,0 1,79
380-392 1 7/8 47,6 1,67
393-405 1 15/16 49,2 1,56
406-420 2 50,8 1,47
422-431 2 1/16 52,4 1,39
432-443 2 1/8 54,0 1,32
444-456 2 3/16 55,6 1,25
457-470 2 1/4 57,2 1,19
472-482 2 5/16 58,7 1,14
483-495 2 3/8 60,3 1,09
496-508 2 7/16 61,9 1,04
509-522 2 1/2 63,5 1,00
523-535 2 9/16 64,0 0,96
536-546 2 5/8 65,1 0,93
547-559 2 11/16 66,7 0,89
560-573 2 3/4 68,3 0,86
574-585 2 13/16 71,4 0,83
586-598 2 7/8 73,0 0,81
599-610 2 15/16 74,6 0,78