Linking the National Plans for Acceleration
and Expansion of Economic Development to
Programming in the Education Sector
Published by:
Education Sector Analytical and Capacity Development Partnership (ACDP)
Agency for Research and Development (BALITBANG), Ministry of Education and Culture Building E, 19th Floor
Jl. Jendral Sudirman, Senayan, Jakarta 10270 Tel.: +62-21 5785 1100, Fax: +62-21 5785 1101 Website: www.acdp-indonesia.org
Secretariat email: [email protected] Printed in April 2017
The Government of Indonesia (represented by the Ministry of Education and Culture, the Ministry of Religious Affairs and the Ministry of National Development Planning/ BAPPENAS, the Australian Agency for International Development (AusAID), the European Union (EU) and the Asian Development Bank (ADB) have established the Analytical and Capacity Development Partnership (ACDP) as a facility to promote policy dialogue and institutional and organizational reform of the education sector to underpin policy implementation and help reduce disparities in provincial and district education performance. The facility is an integral part of the Education Sector Support Program (ESSP) which consists of EU sector budget support with agreed arrangements for results-led grant disbursement, and earmarked policy and program-led AusAID sector development grant support consisting of a school infrastructure program, a nationwide district and school management development program and a program to accelerate the GOI’s accreditation of private Islamic schools. This report has been prepared with grant support provided by AusAID and the EU through ACDP.
The institution responsible for implementation of the study was PT. Trans Intra Asia.
The Consultants Who Prepared This Report Are:
1. Satryo Soemantri Brodjonegoro, Team Leader/ Education Policy Research Specialist
2. Bahram Bekhradnia, Senior Education Policy Research Advisor
3. John Middleton, Training And Vocational Education Specialist
Linking the National Plans for Acceleration
and Expansion of Economic Development
to Programming in the Education Sector
Volume 1
Main Report
EUROPEAN UNION KEMENTERIAN PENDIDIKAN
DAN KEBUDAYAAN
KEMENTERIAN AGAMA
Table of Contents
Table of Contents ... i
List of Tables ... iv
List of Figures ... vi
Abbreviations and Acronyms ... viii
Executive Summary and Summary of Recommendations ... ix
1. Introduction and background to the study ... 1
1.1. Skills change in the economy ... 3
2. Methodology and approach ... 6
2.1. Secondary data ... 11
2.2. Major survey ... 11
2.3. Focus group discussions ... 12
2.4. Literature reviews and assessment of international practice ... 12
2.5. Structure of this report ... 12
3. Demand for skills ... 14
3.1. Projections based on SAKERNAS data ... 14
3.2. Analysis of demand: survey of employers ... 24
3.2.1. Company Distribution and Characteristics ... 25
3.2.2. Company employment ... 33
3.3. Principal findings ... 34
3.3.1. Almost 70 per cent of employers expect to hire more workers in the next 3-5 year period ... 34
3.3.2. The highest percentage of employers expect to hire five workers or less ... 34
3.3.3. Employers use a variety of methods to recruit new workers ... 34
3.3.4. There is a mismatch between worker availability and required skills ... 35
3.3.5. Occupations requiring higher technical skills and management expertise are expected to be in highest demand ... 36
3.3.6. Employers see workers with strong skills, both technical and soft, as critical to company success ... 37
3.3.7. More than 50 per cent of employers felt skill shortages slow down their operations ... 38
3.3.8. More than 20 per cent of employers did not fill vacancies because of skill shortages ... 39
3.3.9. More than 65 per cent of employers have hired higher education graduates in the past three years ... 40
3.3.10. Most companies provide additional training to newly hired graduates ... 40
3.3.11. Almost 60 per cent of companies interviewed do not provide internships for graduates ... 41
3.3.12. Employer assessment of basic graduate skills is largely negative ... 41
3.3.13. Employers have very weak links with local training institutions ... 42
4.3.1. SMK – performance in the labor market. ... 55
4.3.2. BLK – performance in the labor market. ... 60
4.4. International experience ... 61
4.5. Findings from surveys of SMK and BLK ... 62
4.6. Process of Curriculum Development to Match Industrial Needs Applied by SMK, BLK ... 65
4.7. Industrial-Educational Cooperation in Developing Graduate Competence ... 67
4.8. Education-Industrial Links based on RPJMN 2015 (Medium Term Plan) ... 69
4.8.1. Access to and Use of Labor Market Information ... 69
4.8.2. Collaboration with Employers ... 71
4.8.3. Effectiveness of Fields of Study in Helping Students Find Employment ... 72
4.9. Conclusions and recommendations ... 80
5. CAPACITY OF HIGHER EDUCATION INSTITUTIONS TO MEET DEMAND FOR SKILLS ... 85
5.1. Student demand and supply ... 85
5.1.1. Demand ... 85
5.1.2. Supply ... 86
5.2. Ability of universities to respond to future growth ... 90
5.3. Quality ... 91
5.3.1. Accreditation ... 92
5.3.2. Curriculum review ... 93
5.3.3. Real world Experience for students ... 96
5.3.4. International exposure ... 97
5.3.5. Faculty Quality ... 97
5.3.6. Institutional disposition ... 100
5.4. Student Outcomes ... 101
5.5. Use of Labour market Information ... 103
5.6. Conclusions and recommendations ... 105
6. RESEARCH AND INNOVATION CAPACITY ... 110
6.1. Introduction ... 110
6.2. The Current Situation in Indonesia ... 110
6.3. International efforts to improve R&D capacity ... 116
6.3.1. Innovation ... 121
6.3.2. Lessons ... 122
6.3.3. Entrepreneurship ... 122
6.3.4. Lessons ... 125
6.4. Conclusions and Recommendations – Actions for Indonesia ... 126
7. Strengthening the Labour Market Information System in Indonesia ... 129
7.1. Review of International Best Practice in LMIS Development ... 129
7.1.1. Background to the review ... 129
7.1.2. Elements of successful LMIS in different countries ... 130
7.1.3. Canada ... 130
7.1.12. Australia ... 140
7.1.13. Public sector LMI providers ... 141
7.1.14. LMI delivered through the educational system ... 141
7.1.15. Private LMI providers ... 142
7.1.16. Lessons learned ... 142
7.1.17. Features of an optimal LMIS ... 143
7.1.18. Conclusion ... 144
7.2. Current Assessment of Labour Market Information Systems in Indonesia ... 144
7.2.1. Present Arrangements ... 144
7.2.3. The impact on Labour market Information System Performance ... 145
7.2.4. Local labour offices ... 146
7.2.5. Collection of LMI ... 146
7.2.6. LMI reporting ... 147
7.2.7. Services provided to job seekers ... 147
7.2.8. Regional government offices (BAPPEDA) ... 148
7.2.9. Conclusion ... 149
7.3. Recommendations ... 149
7.3.1. Development of a Labour Market Information System ... 150
7.3.2. Establishment of Labour Market Information Coordinating Committees ... 150
7.3.3. Conduct of Regular Establishment Surveys ... 151
7.3.4. Need for Counseling and Placement Services at Labour Offices ... 152
7.3.5. Need for Capacity Building at Government Offices Responsible for LMIS ... 152
8. BIBLIOGRAPHY ... 153
Appendix 1 - Annex 1 International Best Practice in the Development of Labour market Information Systems
Appendix 1 - Annex 2 Improving Technical and Vocational Education and Training in Indonesia
Appendix 1 - Annex 3. International Experience with Support for Innovation and Entrepreneurship
Appendix 2 - Projections of Labor Market in Indonesia
List of Tables
Table 2.1 Theme of Regional Development under National Medium Term Strategy ... 9
Table 3.1 Companies Planning to Hire ... 34
Table 3.2 Planned Company Recruitment by Region ... 34
Table 3.3 Internships provided by companies ... 41
Table 3.4 Areas where graduate skills are lacking ... 42
Table 3.5 Use by employers of government labour market information ... 44
Table 4.1 SMK Sample, By Ownership ... 50
Table 4.2 Senior Seconday Enrolment in 2011/2102 ... 51
Table 4.3 Average Number of SMK Teachers 2015, Sample Schools ... 53
Table 4.4 Average Number of SMK Staff 2015 by Civil Service Status, Sample School ... 53
Table 4.5 Employer opinion of SMA and SMK graduates 2015 ... 57
Table 4.6 Share of staff by schooling level identified by firms as in need of training ... 59
Table 4.7 Per cent of Responding Institutions Reporting Access to Employment Information ... 62
Table 4.8 Institutions maintain labor market and employment information by per cent of institutions responding yes ... 62
Table 4.9 SMK and BLK: Source of labor market information by per cent responding ... 62
Table 4.10 Counsellor or teacher assigned to help student find jobs. Per cent of institutions responding yes, by ownership ... 63
Table 4.11 Labor Market Information Provided to Students/Participants, Per cent of Institutions Responding Yes, by Ownership ... 63
Table 4.12 Labor market information provided to teachers, per cent of institutions responding yes, by ownership ... 64
Table 4.13 Labor market information provided to parents by ownership, percentage of institutions responding yes ... 64
Table 4.14 SMK BLK: Do Employers Provide Additional Instructors or Trainers ... 66
Table 4.15 SMK BLK: Companies Pay for instructors/Trainers Provided ... 66
Table 4.16 SMK BLK: Institution Has Internship Arrangements With Employers ... 66
Table 4.17 Reasons why BLK do not organize internship arrangements with employers ... 66
Table 4.18 Per cent of SMK and BLK With MOUs with Employers by Institution Ownership ... 67
Table 4.25 SMK: Per cent of Responding Institutions Providing, Labor Market
Information to Students, Teachers and Parents, by Region ... 71
Table 4.26 Counsellor or teacher assigned to help students find jobs, by Region ... 71
Table 4.27 SMK Have MOUs with Employers by Region ... 71
Table 4.28 SMK: Participate in Meetings with Employers on Employment Opportunities ... 72
Table 4.29 SMK Graduate survey conducted annually, by region ... 72
Table 4.30 Most effective and least effective fields of study in enabling students to find employment, Java and Bali and other regions combined. ... 72
Table 4.31 SMK BLK: Budget Issues That Constraint Institution, by Ownership ... 75
Table 4.32 SMK BLK: Institution Can Raise Funds by Charging Employers ... 75
Table 4.33 SMK BLK Other Operational Costs. Per cent of Yes Response by Institution Type and Ownership ... 75
Table 4.34 SMK BLK Do Institutions Have Authority to Change Curricula Yes Response by Institution Type and Ownership ... 76
Table 4.35 SMK BLK: Do Institutions Have the Authority to Develop Facilities? ... 76
Table 4.36 SMK: Constraints to overcome to Improve The Quality of Graduates ... 78
Table 4.37 BLK: Constraints to overcome to improve the quality of graduates ... 79
Table 4.38 SMK BLK: Incentives Needed to Make Changes Top Three Responses ... 80
Table 5.1 Places available vs places occupied for S1, 2014 ... 89
Table 5.2 Places available vs places occupied for D1, 2014 ... 89
Table 5.3 Constraints on developing programs of study – Student Demand ... 90
Table 5.4 Constraints on developing programs of study - Quality of High School Graduates ... 90
Table 5.5 Shortage of Equipment ... 91
Table 5.6 Shortage of physical infrastructure ... 91
Table 5.7 Shortage of appropriately qualified Staff ... 91
Table 5.8 Accreditation grades achieved by public and private universities by region (% of programs achieving each grade) ... 93
Table 5.9 Number of institutions whose students get work experience from local firms ... 96
Table 5.10 Average number of lectures by international lecturers ... 97
Table 5.11 Percentage of faculty recruited from industry ... 98
Table 5.12 Number of lecturers with different levels of education qualification ... 100
Table 5.13 Percentage of institutions undertaking tracer studies ... 102
Table 5.14 Results of tracer study: graduates in unemployment ... 102
Table 5.15 Percentage of institutions offering training in generic skills ... 105
List of Figures
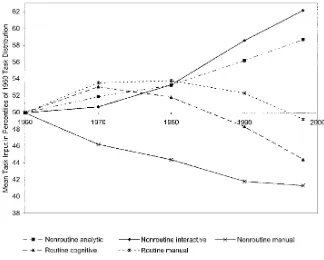
Figure 1.1 Trends in Routine and non-routine task input 1960-1998 ... 4
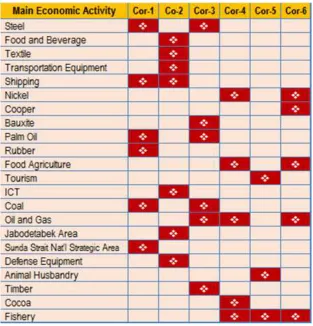
Figure 2.1 Potential Economic & Industry by Corridor ... 6
Figure 3.1 Labour Projection by Education Level, 2014-2018: Agriculture - National ... 15
Figure 3.2 Labour Projection by Education Level, 2014-2018: Mining - National ... 16
Figure 3.3 Labour Projection by Education Level, 2014-2018: Manufacturing Industry – National ... 17
Figure 3.4 Labour Projection by Education Level, 2014-2018: Electricity, Gas and Drinking Water - National ... 18
Figure 3.5 Labour Projection by Education Level, 2014-2018: Construction and Real Estate - National ... 19
Figure 3.6 Labour Projection by Education Level, 2014-2018: Trade, Hotel and Restaurant - National ... 20
Figure 3.7 Labour Projection by Education Level, 2014-2018: Transportation and Communication - National ... 21
Figure 3.8 Labour Projection by Education Level, 2014-2018: Finance - National ... 22
Figure 3.9 Labour Projection by Education Level, 2014-2018: Other Services - National ... 23
Figure 3.10 Company Type ... 25
Figure 3.11 Company Status ... 26
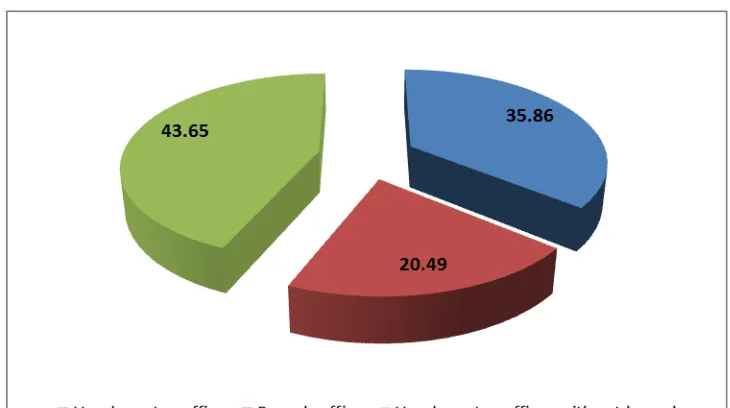
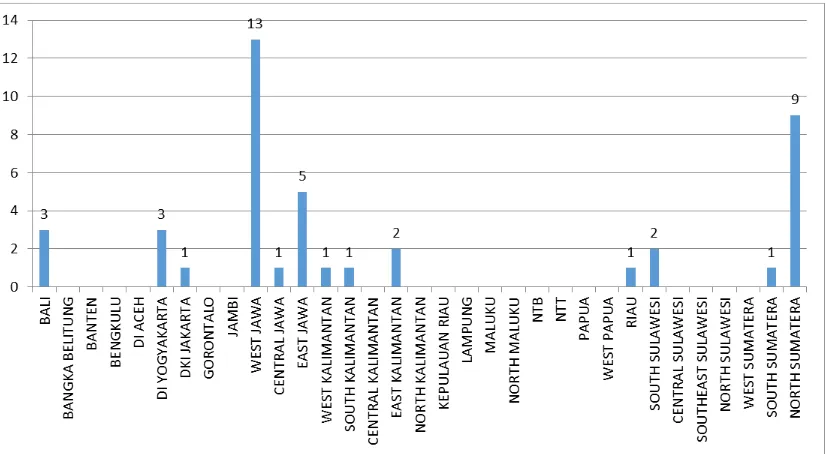
Figure 3.12 Sample Distribution of Food Crop Companies by Operational Office ... 27
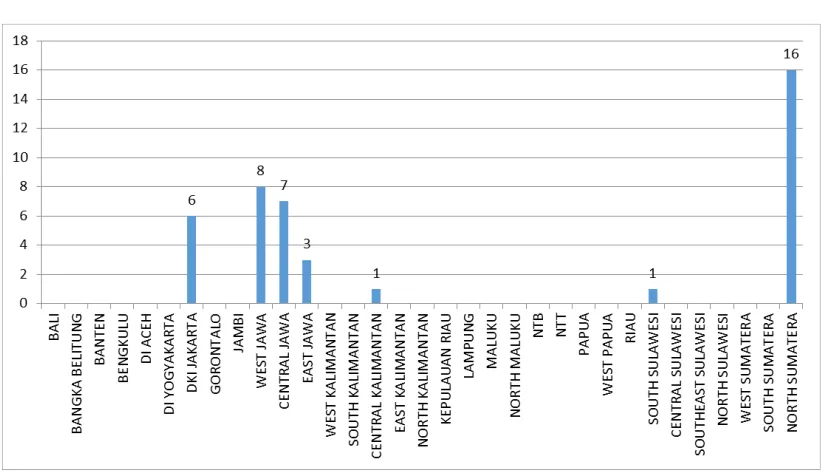
Figure 3.13 Sample Distribution of Livestock Companies by Operational Office ... 27
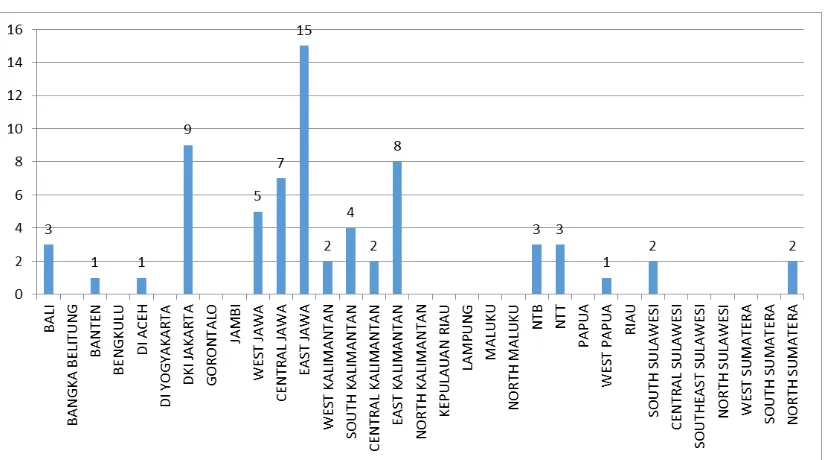
Figure 3.14 Sample Distribution of Plantation Companies by Operational Office ... 28
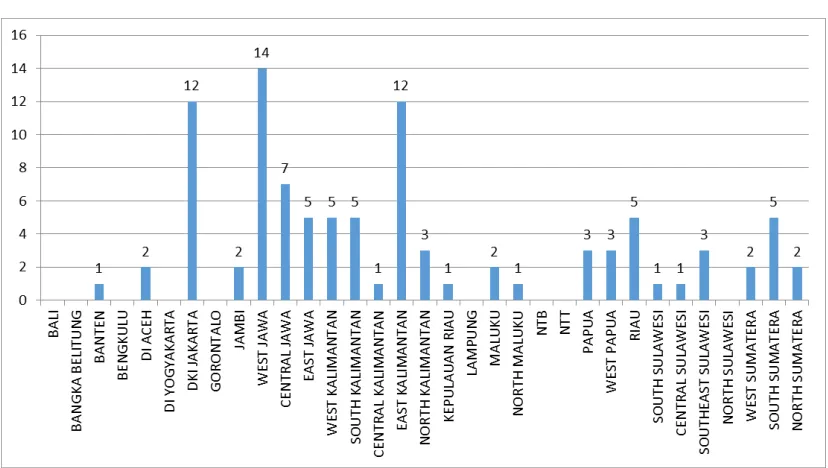
Figure 3.15 Sample Distribution of Forestry Companies by Operational Office ... 28
Figure 3.16 Sample Distribution of Tourism Companies by Operational Office ... 29
Figure 3.17 Sample Distribution of Land Transport Companies by Operational Office ... 29
Figure 3.18 Sample Distribution of Air Transport Companies by Operational Office ... 30
Figure 3.19 Sample Distribution of Marine Transport Companies by Operation Office ... 30
Figure 3.20 Sample Distribution of Fishery Companies by Operational Office ... 31
Figure 3.21 Sample Distribution of Mining/Energy Companies by Operational Office ... 31
Figure 3.22 Sample Distribution of ‘Other’ Companies by Operational Office ... 32
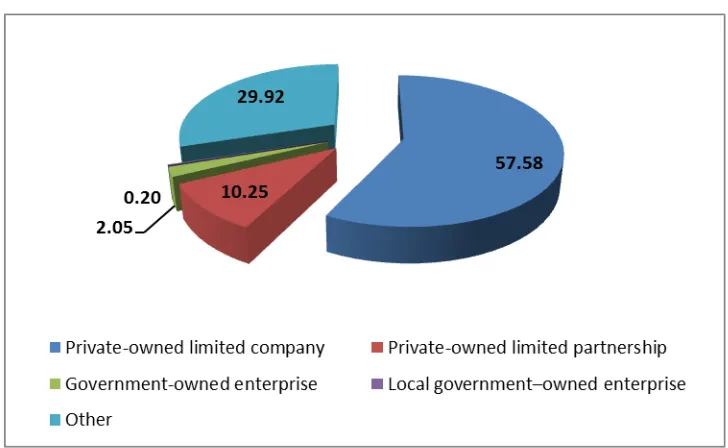
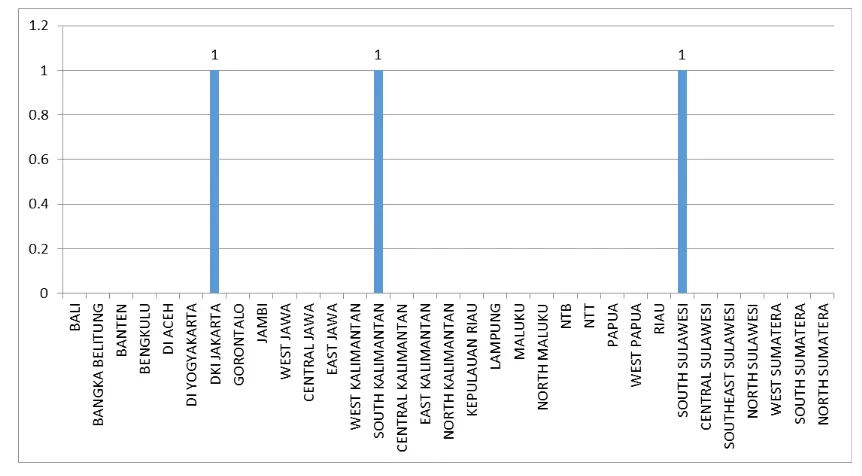
Figure 3.23 Company Ownership ... 32
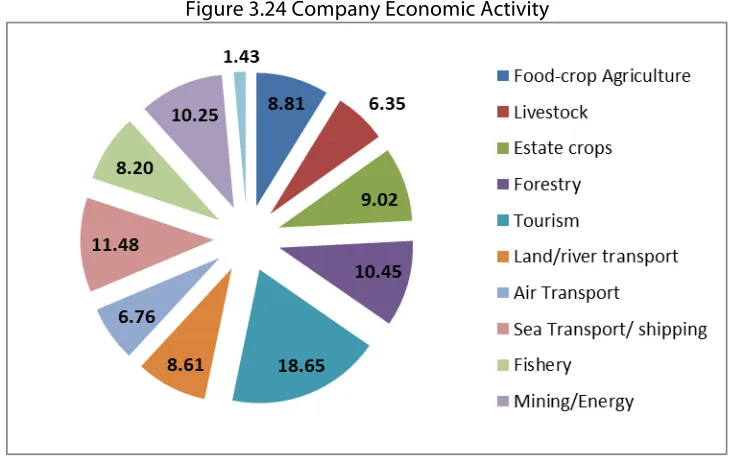
Figure 3.24 Company Economic Activity ... 33
Figure 3.25 Distribution of Employment by Occupation ... 33
Figure 3.26 Employer Recruitment Methods ... 35
Figure 3.27 Company Difficulty in finding new workers ... 35
Figure 3.28 Company Assessment of Worker Skill Availability ... 36
Figure 3.37 Company participation in institution job fairs ... 43
Figure 3.38 Example of employer responses about graduate skills and abilities ... 46
Figure 4.1 Gross enrolment rate of senior secondary learners 2006/2006 to 2011/2012 ... 51
Figure 4.2 Gender parity indices in senior secondary schooling ... 52
Figure 4.3 Employer’s 2010 Opinion of Quality of Employees with Senior Secondary Education (%) ... 56
Figure 4.4 Relative Wages SMK to SA Graduates, Age 20-24 (2002-2007) ... 58
Figure 4.5 Unemployment Rate for SMK and SMA Graduates ... 58
Figure 4.6 Number of Months to Find a Job, New Graduates, 2006 ... 58
Figure 4.7 Mean score in mathematics and reading, PISA, 2012 ... 60
Figure 4.8 Main Strengths of Informal Education as Perceived by Employers ... 61
Figure 5.1 % growth in the named disciplines between 2009-2014 (D1 & S1) ... 85
Figure 5.2 Match between places available and places occupied ... 86
Figure 5.3 Constraints on expansion ... 88
Figure 5.4 Accreditation grades achieved by public and private universities ... 92
Figure 5.5 Percentage reporting a process to revise curriculum ... 93
Figure 5.6 Percentage of institutions that last revised curriculum within the stated time ... 94
Figure 5.7 Institutions with curriculum advisory committees with representatives from industry ... 95
Figure 5.8 Institutions with curriculum advisory committees with representatives from industry – regional and subject breakdown ... 95
Figure 5.9 Percentage of institutions providing internships a part of the program ... 97
Figure 5.10 Faculty qualification levels ... 98
Figure 5.11 Sources of information about the labour market ... 104
Figure 6.1 Effect of different levels of decision making about research topics ... 120
Figure 6.2 Universities providing start-up support for spin-out enterprises ... 123
Figure 6.3 Universities offering courses in entrepreneurship ... 124
Figure 7.1 Career one stop coach website ... 133
Figure 7.2 Local labour offices reporting by region ... 146
Figure 7.3 How local labour offices obtain vacancy information from employers ... 147
Figure 7.4 Services provided by local labour offices to job seekers ... 148
Abbreviations and Acronyms
ACDP Kerjasama untuk Pengembangan
Analisis dan Kapasitas
Analytical and Capacity Development Partnership
AEC Komunitas Ekonomi ASEAN ASEAN Economic Community
ADB Asian Development Bank Asian Development Bank
BALITBANG Badan Penelitian dan Pengembangan Research and Development Board
BAPPENAS Badan Perencanaan dan
Pengembangan Nasional
Ministry of National Development Planning
BLK Balai Latihan Kerja Center of Work Training
FGD Kelompok Diskusi Terfokus Focus Group Discussions
ILO Organisasi Ketenagakerjaan
Internasional International Labour Organizatio n
KADIN Kamar Dagang Indonesia Indonesian Chamber of Trade and
Industries
MoEC Kementerian Pendidikan dan
Kebudayaan Ministry of Education and Culture
MoF Kementerian Keuangan Ministry of Finance
MoRA Kementerian Agama Ministry of Religious Affairs
MSS Standar Pelayanan Minimal Minimum Service Standards
SISLATKERNAS Sistem Latihan Kerja Nasional National Training System
SD Sekolah Dasar Primary School
SMP Sekolah Menengah Pertama Junior Secondary School
SMK Sekolah Menengah Kejuruan Vocational School
JUKNIS Petunjuk Teknis Technical Guidelines
TIA Trans Intra Asia Trans Intra Asia
ToR Kerangka Acuan Kerja Terms of Reference
TVET Pendidikan dan Latihan Teknik dan
Kejuruan
EXECUTIVE SUMMARY AND SUMMARY OF RECOMMENDATIONS
1.1
INTRODUCTION AND METHODOLOGY
At present a substantial part of Indonesia's wealth is based on agriculture, and the extraction of raw materials. The economic and industrial strategy pursued by the present government, like the previous, recognizes that this is not a sufficient basis for achieving the country’s full potential, and is focused on developing intellectual, manufacturing and service-based industries that can add value to the abundant raw materials and agricultural goods that are produced. And it recognizes also that it will not achieve this unless its workforce is educated to a far higher level than at present, unless it's education institutions and economic needs of far better aligned, and its research and innovation base strengthened.
The present project is concerned with the education implications of the economic and industrial strategy and what will be required in order to bring it to fruition, together with identifying the labour market information that will be required and a system for providing this.
1.2
DEMAND FOR SKILLS
In the absence of good labour market information, we adopted a two pronged approach to examining the question of skills needs and the issues that arise in the present circumstances. First we interrogated the Sakernas data in order to develop projections at a high level – this provided a macro-level analysis. And second, we conducted a detailed survey of employers, which asked about their hiring patterns and intentions, skills needs and the impact of skill shortages and where they arose.
Using SAKERNAS data we made projections of trends in skill levels to 2014–18, from which it is apparent that that there will be acceleration in skills levels required in most sectors, with the strongest growth in high-level skills demand arising in finance, in transport and communication and in "other services". The only sectors not showing significant increases in high-level skills are agriculture, manufacturing and construction. Demand will vary in different regions, and information about this should be part of the labour market information systems that we recommend should be developed at both local and national levels.
Our main conclusions from the employer surveys are that the majority of companies plan to hire more workers during the next 3-5 years, most using local private employment agencies to find workers, particularly at the skilled and more senior levels, and only slightly more than 7 per cent using on-line advertising.
more workers. The second highest method (21 per cent) was to increase overtime hours for existing skilled staff, while 11 per cent were forced to hire less qualified applicants. Only 3 per cent of employers were prepared to venture outside of the country to seek qualified workers.
• Almost one-half of the employers interviewed were concerned that skill shortages slow down their existing operations and over 30 per cent felt this would slow the expansion of future operations. Further over 20 per cent feel that skill shortages directly reduce knowledge transfer.
• Occupations requiring higher technical skills and management expertise are expected to be in highest demand. There will be demand for technicians, engineers and supervisory and senior management personnel and to a lesser degree there will be a requirement for research assistants, personnel managers, machinists and metal fabricators.
As far as the employment, training and skills of graduates is concerned
• 65 per cent of employers sampled had hired higher education graduates during the last three years, while 35 per cent had not.
• Across all regions employers on average provide up to three months of training to newly hired graduates.
• Almost 60 per cent of employers interviewed do not provide internships for graduates. • Employer assessment of basic graduate skills is largely negative with employers
assessing reading and writing skills as very poor. This was followed by work habits, communication, and team work which were assessed by employers as poor. Technical skills were also assessed as relatively poor.
• Employers have weak links with local training institutions. Across all regions only 7 per cent of employers have input into curriculum development, 12 per cent use institutions for staff training, 7 per cent enter into joint research projects and 7 per cent have staff arrangements for instructors. Only in the provision of interns is the involvement higher with 32 per cent of firms accepting interns.
• Less than half of the employers interviewed made use of labour market information. More than 93 per cent of employers did not make use of local government offices in the recruitment of new workers and only 13 per cent of employers participated in job vacancy surveys conducted by government labour offices. On average only 40 per cent of employers make any use of labour market information available on the internet.
from business and industry; alignment of curriculum development programs and vocational skills according to the main economic activity in the district/city and labor market needs However, it should be noted also that we have not attempted precisely to quantify the need for specific skills in specific industries over the coming period. The data do not exist to enable us to do so, and that would in any case be wrong. One lesson that comes through clearly from international experience is that detailed manpower planning that was once fashionable – identifying in precise detail industries that would grow and the occupations and skills that they would require, quantified and precisely identified - is not a successful approach. What is successful is to ensure that labour market signals are provided in a form that education institutions are able to respond to rapidly and flexibly, and to enable them to do that. And in order to enable that what is needed is local information and local structures, and that is what we recommend here.
Policy options arising from the analysis of demand
Addressed to MoEC and MoM
• Government should take the lead in developing measures to strengthen the linkages between employers and the higher education institutions
Addressed to the Ministry of Education and Culture
• In response to negative employer opinion about basic graduate skills the Ministry of Education and Culture should conduct employer satisfaction surveys as a starting point in addressing this problem
• MoEC should consider the international experience we report on in our enterprise study to institute regular employer consumer surveys for the SMK and SMA. Made publicly available, the findings of these surveys could increase the accountability public and private SMK, providing an incentive to improve their performance. These surveys could also generate useful independent monitoring support to local and Provincial governments
Addressed to MoM
• Better information sources should be developed to provide information about skills gaps
• Measures should be taken to address the identified need from the survey sample for higher skilled occupations
Addressed to Higher Education Institutions
1.3
REVITALIZATION OF SMK AND BLK
In our survey, three-quarters of employers responding reported that SMK graduates are ready to develop their technical capacity to work in their company, that the schools have supplied their graduates with technical skills that match the needs of the economy and that the schools have provided graduates with an adequate balance of technical concepts, theoretical knowledge and analytical skills. Their satisfaction with the technical skills that students have acquired is in contrast to their dissatisfaction with basic skills (see below). While employers give high ratings to the technical skills of SMK graduates that they hire, they also report that thirty per cent need training after they are hired.
Although the future is always uncertain, as the recent China experience demonstrates, it is most likely that for some time to come the skills structure of the current economy will determine most of the demand for skills. Using SAKERNAS data on the education structure of the current workforce we projected demand for workers across all education levels out to 2018. The projections show that demand for SMA graduates will grow more quickly than for SMK graduates in the Transport and Communications, Finance, Social Services, Trade, Hotel and Restaurant, and construction and Real Estate Sectors. SMK graduates are projected to be in higher demand than SMA graduates only in Mining and Manufacturing. This growing demand for SMA graduates is an early signal of the value employers place on cognitive skills. Sixty per cent of SMA graduates proceed on to post-secondary education while only about ten per cent of SMK graduates follow this path.
And although any increase in demand for secondary school graduates is most likely to be met, the quality of the graduates rather than their numbers is likely to be the main issue, and that in turn depends on junior school outcomes which the poor results in OECD’s PISA test of mathematics and reading suggest need improvement. Improving basic and junior secondary education would make a substantial contribution to the quality and effectiveness of both SMA and SMK education and, over time, enable a much larger share of SMK graduates to be prepared for to enter formal employment.
There is currently substantial variation in the practices of SMK in the use of labor market information and building collaboration with employers. Our survey has shown that while virtually all SMK in our sample access labor market information less than 50 per cent of the public SMK share the information with students, teachers and parents.
European experience shows the value to both skill and behavioral learning of structured and supervised apprenticeships as an integral part of secondary vocational education. SMK internships are weak by comparison. 90 or more per cent of public SMK report arranging work internships for their students but these are ad hoc arrangements not well integrated with the curricula. So more formal and better structured internships would be an invaluable learning experience.
annual survey of graduates. Clearly, if there are no data on employment outcomes both the public and private SMK are not accountable for the outcomes that justify their costs.
Our survey also found that SMK can identify courses of study that are effective in helping students find jobs, and are also equally able to identify ineffective courses. But despite this, currently SMK cannot change their courses of study. SMK follow a national curriculum that was put in place eight years ago and has not been updated since. And as part of a national reform, most public SMK teachers are now civil servants. So although new courses of study designed to support the projected new economy would require teachers with different skills, civil service teachers are not easily laid off and so teachers with redundant skills cannot be replaced.
There are other constraints on linking public SMK to changing skill needs. From secondary sources we know that all levels of government are unlikely to take SMK performance into account when allocating budgets. This lack of accountability for outcomes is a major constraint on SMK quality and labor market responsiveness.
The central challenge to the SMK is to improve the quality of instruction generally and, more significantly, take strong steps to better serve the half of the student body that does not now enter formal employment. If successful, a quality improvement program could increase the share of graduates prepared for work in formal sector from about 600,000 annually now to close to 2 million when universal secondary education is achieved.
The MOEC will clearly have the main responsibility in leading change.
It will not be easy to or cheap to move the SMK toward the performance levels required for a high-income economy. These schools are currently rigid in curricula and staffing, and until these constraints can be eased to better enable them to respond to changing skills needs, some groundwork could be laid.
It will be important that SMK move toward increased flexibility of curriculum and staffing to support the emerging regional economic strategy. Over the medium term, pilot projects could be developed to test new practices across the regions
Policy options arising from the study of SMK
Addressed to MoEC
• MoEC should take steps to better monitor the use of labor market information by the SMK. This task could be assigned to District Education Offices with the annual SMK report as a vehicle. This would be a first step in improving accountability.
educators and citizens to guide and oversee this process.
• MoEC should establish and support a high-level Working Group to assess and evaluate the present condition of SMK internships and recommend strategies and action plans to bring these internships closer to international good practice. This working group would need to have access to resources, and also expertise, which we believe should be drawn from among Indonesian institutions.
• We recommend that, pending the finding of this Working Group, the MOEC consider Norway’s internship model of subsidizing the employer costs of a six-month apprenticeship at the level of half the annual of a year of SMK education with half of the subsidy going to the student in wages as an incentive to employers and students alike. • Above all, MoEC should determine ways in which the courses of study of the SMK could
be regularly updated and periodically replaced as the skill needs and employment opportunities change with the economy. This will be essential to aligning SMK courses with the changing regional economies under the RPJMN 2015. For example, a district or city government could be empowered and financed to work with employers, schools and citizens to identify courses of study that are not effective in the local economy and seek the support of the MOEC in replacing them with other SMK courses of study in the near term.
• Over the longer term, and depending on progress made in monitoring and accountability, MoEC should consider providing financial incentives to local governments and to the SMK to reward improvements in the employment outcomes of public and private SMK
• There should be a reform in the definition and role/mission of SMK. SMK could not be conducted
as it is any longer otherwise SMK will be marginalized totally. SMK should be a special school due to its uniqueness and strength, not just another secondary school. Therefore number of SMKs should be limited (e.g. in Japan only 5).
The BLK system is small, aging and expensive. BLKs have little autonomy or accountability: there are no rewards or sanctions in the governance of the system. Appropriately, the MoM and MOEC are considering reforms that could revitalize the BLK through integration with the SMK, and indeed A number of BLK have MOUs with SMK and the World Bank has reported that a substantial number of SMK students and graduates take short training courses at the BLK. Some reforms are already in progress. In addition to the urban BLK the MoM operates a successful program of Mobile Training Units (MTU) that provide training in skills appropriate to rural areas and in the informal sector. More than 50,000 persons graduate from MTU programs each year.
New self-paced competency-based training packages have been introduced but they are being implemented in only a small number of centres. Most BLK conduct training on a classroom schedule. Trainees are assessed internally with little reference to national standards.
Finally, our survey found that the BLK lag behind the SMK in the use of labour market information and collaboration with employers, such as through internships.
Policy options arising from the study of BLK
Addressed to MoM
• We recommend that ways should be found to better leverage the resources of the BLK, possibly through stronger linkages with the SMK.
• With an aging and shrinking teaching force, an uncertain curriculum reform, deteriorating equipment and facilities, and very high costs, the formal urban BLK should be reformed to better adapt their resources to the future economy.
• In developing these reforms, the MoM could consider models for linking skills training with formal vocational education that have been well developed in the USA, especially the Area Vocational Centres that provide accredited courses to secondary school students as well as non-formal training for out of school youth and unemployed adults.
• The Mobile Training Units (MTU) program should be continued and should remain under public management with district governments playing a stronger role.
1.4
CAPACITY – UNIVERSITY EDUCATION
As stated above, it is unwise to attempt to project in any detail or precision the likely future demand of the labour market for specific skills and translate that into precise requirements from the education system. We were nevertheless able to take a view about broadly whether the university system was likely to be able to meet the demands made of it for skilled manpower as a result of the RPJMN policy. Our conclusion is that in terms of pure numbers it will be able to do so.
Demand for highly skilled manpower is likely to increase substantially (although it is not possible to say in detail what the nature of that demand will be); and there is sufficient potential student demand, and the capacity of the university system - in terms of both of physical capacity and the availability of academic staff – will be sufficient, to meet needs as they are foreseen at present.
meet need, and will do so in future; and on the other whether institutions are able to meet the demand now and potentially in the future as well. Based on our survey results we have concluded that the situation is broadly positive. However, there are some regionally specific concerns, and to major general cautions:
• physical resources
• the availability of adequately qualified faculty.
We do not think that these need be long-term constraints on expansion:
• if they recruit additional students, universities will obtain sufficient additional income to repay the costs of additional plant and equipment
• we believe that a Masters qualification is the appropriate level for most undergraduate teaching (it is a different matter for research) and we have noted with approval the Government's commitment to increase the number of Masters graduates sevenfold within 10 years.
These conclusions hold for both for S1 and D1 places, though there appears to be a serious imbalance between the two with a large preponderance of S1 places compared to D1.
The quality of provision is more important than quantity There is now good research evidence that simply increasing the number of graduates will have a limited impact upon economic progress – what matters is the quality of those graduates. Here there is rather more concern. Examination of accreditation scores reveals wide variations – not only between public and private institutions, which is well known, but between large institutions and small institutions and also between regions.
We found an almost linear relationship between accreditation grades and size of institution, with small institutions having a far worse accreditation record than large institutions, and there were marked differences between regions as well, with the Papua, Nusa Tengarra and Kalimantan regions in our sample having no Category A accreditations in either public or private institutions. This has significance in view of the Government’s medium term strategy intention to reduce disparities and build up capacity in all regions, related to their industrial strengths.
Other indicators of quality – and in particular the existence of processes for reviewing the curriculum and the engagement of industry in such processes - appear satisfactory across the country and in all disciplines, and the availability of work experience and internships are also high. However, there are some regional differences which will need to be addressed if the Government’s strategy is to be achieved.
The ultimate measure of quality is the outcomes for the graduates produced by the education system. The great majority of institutions said that they conducted tracer studies to follow up the outcomes for their graduates, and moreover that the outcomes were broadly positive – though again with some worrying regional and discipline variations.
Finally, we think that the Government should be actively involved in seeking to improve the provision of information of all kinds – and we have recommended that tracer studies should be conducted and their results published, together with information about the professional accreditation of program and other critical facts.
The replies to questions about labour market information systems give particular cause for concern. It is apparent that very little use is made of official sources of labour market information, because, according to replies in the focus group discussions these are not trusted, are out of date and are not relevant. It is essential that these are reformed to make them valuable resource, and we make recommendations about this.
Policy options arising from the analysis of the capacity of universities
Addressed to the Ministry of Research, Technology and Higher Education
• The Government should conduct the review proposed by the OECD, aimed at rationalizing provision on a provincial level, as one instrument in the improvement of quality, and this review should specifically consider how smaller institutions might be rationalized and their quality increased, as well as the balance of provision between D1 and S1 levels..
• BAN-PT should be provided significantly increased resources and its remit should widen from accreditation to one of quality assurance more generally, and it should consider issues of outcomes as well as inputs and process that bear on the quality of provision
• The Government should take steps to publish a relatively small number of performance indicators covering all universities in the country, to provide information about student outcomes, and these should include annual tracer studies, and possibly a student satisfaction survey
• A separate and serious study should be undertaken – or better still studies that have previously taken place should be reviewed – with a view to an unequivocal commitment to increase the autonomy of public institutions – both managerial, governance, financial and academic autonomy - beginning with those judged to be of the highest standard and which are most prepared for autonomy
• Higher education institutions should be provided with autonomy for their accountability. With
Addressed to Universities
• All universities should ensure that all relevant programmes – that is to say programs that aim to prepare students for specific occupations – are informed by curriculum advisory committees at faculty, departmental and even program level with representatives from industry and are reviewed at least once every five years
1.5
RESEARCH AND INNOVATION CAPACITY
Economically successful countries have well developed research and innovation systems, and there are numerous examples of countries that have sought to develop their economies by developing these – and their higher education generally – as one of the elements on the way to achieving that. Indonesia needs to develop its research and innovation capacity if it is to achieve its economic ambitions.
At present Indonesia performs worse than the majority of its neighbors, on most generally accepted measures of research performance – and in particular publications and patents on the output side and faculty qualifications and finance on the input side. This is beginning to be addressed with the welcome creation of the Indonesian Science Fund. However, how the Fund operates, its priorities, parameters and programs will be of the utmost importance to ensure that its benefits are maximized. Among the lessons to be drawn from international experience are the following:
• There is a balance to be struck between supporting excellent research and building capacity. Although building capacity is an important consideration, limited research funds mean that in a competitive environment there is an opportunity cost associated with overlooking excellence as the key consideration.
• Nevertheless, the ISF can legitimately – and should – identify research priorities and topics judged to be in the national interest
• Availability of staff is a constraint. In only three Regions in our survey – Java, Sumatra and Sulawesi – do more than 20 per cent of faculty have PhDs, and in all the others the proportion is nearer just 10 per cent. This is no basis for developing a strong research base – and it is essential that there is some research strength throughout the country. There are a large number of initiatives, most found in Asia, Europe and the Middle East, intended to drive/maintain national competitiveness and attractiveness to mobile investment and talent, as some governments have become concerned that they are/have been under-investing vis-à-vis their competitors. These realizations are leading many countries to restructure their higher education and research systems with the primary objective of ensuring that some of their universities become outstanding in research, and are able to match the best in other countries.
• An emphasis on the development of basic and applied research, which provide the cornerstone – the sine qua non - of innovation and applied research.
In considering the balance between supporting excellent research and building capacity, the best approach would be to invest selectively but substantially in a relatively small number of institutions in order to boost their research capacity and output, but do so in a way that might have spin-offs for other institutions.
The aim should be to encourage cooperation and clusters so that every region has at least one research university that aims to be of national significance and a beacon for research into the topics of research significance for that region; and that each province has at least one university where significant research activity takes place – though at a lower level of intensity than in the regional research universities. And the aim should be that ultimately 3 or 4 universities in the country develop their research capability to be world class.
Innovation and entrepreneurship do not exist independent of basic research, fundamental discoveries, and the availability and development of the staff needed in order to innovate and exploit these discoveries. So given Indonesia’s poor performance in basic research it is not surprising that innovation and entrepreneurship are underdeveloped – manifested for example in its poor performance in creating new businesses. This is something recognized by the Government, and statements have been made signaling Government policy to encourage entrepreneurship
Both Government and universities need to do more to support innovation and entrepreneurship. The aim of innovation support – whether from universities or from Government – is to unlock the capacity of universities and their staff for innovation, bringing to bear their theoretical knowledge into exploitable goods and services.
Policy options arising from the analysis of research capacity
Addressed to the Ministry of Research, Technology and Higher Education & the Indonesian Science Fund
• There should be increased and targeted funding for basic science – targeted both in the sense of identifying strategic topics, and also identifying those institutions where research is to be concentrated, and where funding is to be principally directed.
Addressed to the Indonesian Science Fund
Addressed to the Ministry of Research, Technology and Higher Education
• In order to meet the need for an increased number of gifted researchers the Government should implement two programmes: one explicitly concentrated on drawing Indonesians undertaking research in overseas institutions to return to a relatively small number of Indonesian universities, and the second to send faculty abroad to undertake PhDs with the requirement that they return to their parent university.
• The Government should consider a program to provide dollar for dollar funds for any money generated by universities from entrepreneurial activity.
• The Government should encourage those universities in receipt of Government funds – whether through the ISF or otherwise – to establish centrally located infrastructure support such as technology transfer offices, incubator facilities and science parks, and should consider providing seed funding support for this purpose
• The Government should provide incentives (e.g. competitive grants) to all universities to develop entrepreneurship programs – which can be done collaboratively between institutions, not necessarily discretely by individual institution
1.6
DEVELOPMENT OF LABOUR MARKET INFORMATION SYSTEMS
The following actions were taken to assess the LMIS:
1.1.
Review of International Best Practice in LMIS Development
We reviewed international best practice in the development of labour market information systems (LMIS) in selected countries and the methods used to identify skills gaps and shortages linked to projections of labour demand and economic development.
Based on our review seven fundamental features of an optimal LMIS were identified. These are: • Good governance and cost-effectiveness;
• Timely, accurate and relevant data
• Effective analysis and interpretation of data; • Competent labour market analysts;
• Information that is easily accessible to users through a variety of outlets; • Knowledgeable intermediaries; and
• Development of education and guides for effectively using LMI.
1.2.
Results from the survey of government agencies in Indonesia on use
The main responsibility of the BAPPEDA office is the development of a regional development plan. As far as the LMI area is concerned the offices develop a skills development plan which helps to fund the programs of the local agencies such as the labour offices. Survey results show that In terms of the development and distribution of LMI the BAPPEDA offices have little direct involvement.
The results from the government surveys show that the use of LMI is very limited. The Indonesian labour market information system is particularly weak at the district/local level. In general the collection, analysis and dissemination of labour market information is very fragmented in the country. There is a pressing need to better coordinate these functions to ensure that the primary users of LMI including policy makers and planners, employment services, training institutions, employers; students and job seekers receive timely and accurate data and information. The collection of information from employers on the demand for workers and their skill requirements is particularly weak as opposed to supply information on job seekers and graduates from training institutions which is fairly readily available.
Under the third National Medium Terms Development Plan (RPJMN) of 2015-2019, the Strategic Plan of the Ministry of Manpower addresses the need for a more effective LMIS. In particular, the Ministry Plan proposes to facilitate labour mobility and functioning of the labour market by: (a) Improving the effectiveness and efficiency of the labour market as well as maintaining the balance between supply and labor requirements; (b) Integrating the labour market information system (LMIS) to respond to the information needs of companies, training providers and job seekers as well as policy makers to work together with the private sector job market; (c) increasing industry involvement in the design and implementation of employment services, as well as the development of a standard system that uses a feedback mechanism from stakeholders; (d) ensuring that job placement and counselling are implemented correctly; (e) improving outreach/cooperation between educational institutions, and employers to develop an ongoing collaboration. This is a positive step and is supported by our recommendations.
Policy options arising from the analysis of Labour market Information Systems
Addressed to the Ministry of Manpower
• As a strategic priority the Government should ensure the development of a labour market information system and provide incentives and structures to implement this. • The Ministry of Manpower and the regional labour offices should conduct regular
establishment surveys to obtain demand data and statistics.
• Each local labour office should be mandated to provide placement and counselling services to its clients
1.
Introduction and background to the study
This project was born out of the previous Government’s MP3EI strategy and its recognition that as the world's fourth largest country by population, Indonesia underperforms as an economy. Its precise location in the ranking of economies varies according to date and authority, but at best it lies in the lower teens – between 16th and 20th - and there is recognition that in order to achieve the desired economic boost the balance of economic activity will need to change.
Although the MP3EI project has been superseded with the arrival of the new government and the issue of Presidential decree 2/2015, promulgated on 8 January 2015 which launched the National Medium-Term Plan, the issues that underpinned many aspects of the vision that drove that project have been carried forward into the new government's medium-term economic strategy, and have been repeated in one way or another by other commentators and global authorities.
And although the fundamental approach – the identification of geographically-based Development Areas and strategic industries for development in those areas – remained similar, there are seven Regional Development Areas in the Medium-Term plan, compared to six ‘Corridors’ in MP3EI, and the details of the industries in each area are differently described. Where necessary we have modified our approach to fit the new Medium Term Plan.
The other significant difference between the MP3EI and the medium-term strategy is that the latter has a five-year horizon compared to the 25 year horizon of the MP3EI. That is a helpful change which will, for example, mean that employer perceptions of skills needs are likely to be much more meaningful – while it is reasonable to ask employers to say what they anticipate their needs will be five years hence, that is not so 25 years hence. In this report, unless otherwise specified, we have taken the Medium-Term Plan’s five-year horizon while setting it in the context of the longer term.
At present a substantial part of the of Indonesia's wealth is based on the tertiary sector – agriculture, but also the extraction of raw materials. Because of Indonesia's good fortune to have an abundance of raw materials and a fertile and productive land, it has exploited these and benefited. However, if it is to move up a step in terms of economic performance there is recognition that that will not be achieved by continuing along this path. Simply to allow foreign companies – or even Indonesian companies – to extract its raw materials, but then to take these overseas to add value – simply to rely on income from upstream activity, but allow others to reap the far greater benefits available from downstream activity – is seriously to miss a trick. The economic and industrial strategy pursued by the present government, like the previous, recognises this, and is focused on developing downstream industries that can add value to the abundant raw materials and agricultural produce that are produced.
and knowledge able to provide industry with the new and enhanced skills and knowledge needed to produce these high-level products and services; and it will also need to develop its research and innovation base to enable it to make discoveries and to exploit these discoveries – as well as discoveries made elsewhere – in order to develop new advanced products and services.
Indonesia has benefited from a large number of reviews carried out by global authorities in the last few years, and our own surveys and analyses carried out in the context of the present project confirm the unanimous conclusion that in this respect there remains much to be done.
An illustration of the gap that needs to be filled is provided by the World Bank's “Knowledge Economy Index1" which in 2012 placed Indonesia at number 108 in the world, below all Southeast
Asian countries other than Lao and Cambodia. That is a measure of the challenge facing the country, and in particular its education system. The purpose of this present study is to identify what can be done to improve the education system generally, but specifically also to identify how the education system can better respond to the developing needs of the labour market and how labour market needs and education system outputs can be better aligned. It covers both skills output and manpower requirements, but also innovation, research and entrepreneurship – all indicators of, and prerequisites for, a vibrant and modern economy.
Indonesia's potential is unquestionable. It has led some to conclude that it is on the cusp of becoming one of the world’s great economic powerhouses. The McKinsey global Institute report in 2012, for example, said
“Indonesia could be on the cusp of a new era of sustained growth and rising prosperity with the advantage of a following wind from major international and domestic trends … By 2030 Indonesia could become the seventh-largest economy in the world – overtaking Germany and Great Britain’
That was written at a time when the macroeconomic outlook was outstanding and had been stable and improving for many years. It is unlikely that such a hyperbolic statement would now be made, but the general point is undoubtedly true. If Indonesia can address some of the issues that have been recognised, and if it can take the further steps needed to develop its skills, knowledge and other infrastructure to the extent that is necessary, then it will undoubtedly make great strides towards becoming one of the world’s great economies. But meanwhile there are important issues to resolve.
The present project is concerned with the education implications of the economic and industrial strategy and what will be required in order to bring it to fruition, together with identifying the labour market information that will be required and a system for providing this. Essentially, as described in our earlier Progress Reports, this study concerns the objective of strengthening human resource capacity and national science and technology – the outputs of the education system and the higher education system in particular – to support the development of the main industries being developed in each Regional Development Area.
sets of the consultants cover labour markets and labour market information systems, education and skills provision - both at school and higher education levels - statistical analysis and survey development.
The team began work in September 2014 (the kick-off meeting was on 22 September 2014), and produced an inception report which was delivered to ACDP in November 2014, a First Phase report delivered in March 2015, and a Progress Report delivered in July 2015. Our Terms of Reference require us to produce our final report by the end of September 2015.
1.1.
Skills change in the economy
As economies change education and training must change as well.2 Education systems take
considerable time to change and there can be an intellectually and politically challenging decision about what to change, when and how.
Forty years ago the (too) simple idea was to project the number and type of skilled workers that would be needed in different sectors by calculating the shares of different occupations – managers, engineers, technicians, production workers, craft persons, unskilled workers – in the current economy and multiplying these by the expected rate of growth in the economy.3
With hindsight, we now know that the structure of economies, employment, production and skills demand can change quickly and in unexpected ways making longer-term projections unreliable. But it is still important to link education and training policy and strategy to medium-term economic strategies and plans. It is also important that students in secondary schools and universities learn about the world of work through counselling and also through some experience in the work place in order to make better plans for their post-education futures.
Over the last decade there has been an animated debate, fortunately supported by good economic research, regarding the impact of globalization and technological change on the skills required for competitiveness in the very rapidly evolving global economy. The research has been greatly aided by much better measurement of learning achievement through international testing. And instead of equating skills demand with occupational categories, education certificates and projected employment growth we are now measuring changes at the level of skills.
The research is concentrated in high income, high technology economies but the findings are instructive for economies, such as Indonesia, that aspire to high-income status. And while it is common to talk about rapid economic and skills change, the research suggests that this happens over decades, not years.
schools, it has been estimated that a one-half standard deviation improvement in the test scores of US students would increase America’s GDP by two per cent twenty years later through higher earnings in work. This would be worth an estimated US$ 250 billion, more than enough for substantial investments in school quality. The research also shows that similar impact occurred in part high growth in East Asian economies that rapidly expanded and improved secondary and tertiary education.4
Investments in the quality of basic and secondary education have a significant economic payoff in high growth economies and in those countries aspiring to high growth status as well.
We also know more about the impact of technological changes on workforce skills and the implications for education and training strategies.
Economists now have measures of actual skills used in employment in the US and other high-income OECD economies, replacing the long-standing use of occupational categories and levels of education in the economic analysis of education investments. Rather than compare the earnings of factory workers and electrical engineers, we can now also look at the differences in kinds of skills that are used in work.
Tasks are classified on two dimensions. One discriminates between jobs with analytic and interactive tasks that require thinking, information processing and interactions with others, and tasks that are manual. The other dimension compares routine tasks and non-routine tasks – the latter requiring flexibility, creativity, problem solving and complex communication, and the former tasks that a computer can easily be programmed to do. 5
non-routine thinking and non-routine interactive skills increased substantially, while the share of jobs using routine skills fell sharply. In sum, more jobs required more and higher cognitive analytical and interpersonal skills while the share of jobs using of routine manual skills declined.
This research gives us insight into how technological change impacts skill demand and helps explain why the US and other advanced economies are seeing middle skilled jobs and salaries decline while jobs and wages for the top 10 percent increase quite sharply.6 There are clear
implications for education and training policies and investment. Importantly, demand and salaries have increased for workers with the better cognitive skills (language, math, science) that are learned in good secondary schools and colleges.
Recent research on the pace of technological change and changes in employment by occupation over the past two decades suggests that, across the OECD, this has been a general and steady process.7 Data that examine changes in skills confirm that the demand for cognitive and
interpersonal skills is rising while the demand for craft skill and manual labour has declined. The study recommended that students have access to guidance manuals that provide a “full understanding” of jobs and wages available in the labour market, their entry requirements, working conditions and wages,
A TVET policy study published by the Asian Development Bank in 2004 developed a broadly useful model that suggests the type of education and training that best serves economies at different stages of development.
While all such models are approximate they are helpful in thinking about directions for change and development in education and training both to manage well the economy as it is and, at the same time, take steps to adapt the current system for the future economy.
By the ADB scale Indonesia would appear to be well into the stage of investment-driven growth while aspiring to the level of Innovation Driven Growth. Reaching this goal will require more work to develop its education and training systems at all levels.8 And indeed, unless it does so it will be
2.
Methodology and approach
The MP3EI strategy, which we have taken as our starting point, identified 22 industries (broadly economic and industrial sectors) which would be developed in six “economic corridors". Some economic corridors would be concerned with several of these industrial sectors and some with fewer, but none with all. The economic/industrial sectors and their allocation to economic corridors is shown in Figure 2.1 below.
Figure 2.1 Potential Economic & Industry by Corridor
Note: Cor-1 = Sumatera, Cor-2=Java, Cor-3=Kalimantan, Cor-4 = Sulawesi, Cor-5=Bali-Nusa Tenggara, Cor-6=Papua-Maluku
Source: MP3EI Report, Coordination Ministry of Economic Development, 2011
Moving on from the original terms of reference, this study has been aligned and implemented in accordance with the policy directions of the present government, particularly as articulated in the TRISAKSI and Nawacita
Briefly, these have identified the following policy directions relevant to the study
In economic and regional development the policy is intended to identify specific fields and to strengthen these by increasing competitiveness which itself is based on the advantages of natural and human resources, as well as quality and capacity in science and technology, which it is intended should be continuously improved.
Economic corridors have been established with the specific themes of development according to regional potential as follows:
• Maluku
• Nussa Tenggara • Sulawesi • Kalimantan • Java-Bali • Sumatra.
These economic corridors have broadly been the basis for analysis in this study. The substantive regional development policies include:
• Encouraging the accelerated development of centres of economic growth as the main drivers (engines of growth), in each island, aligned with the particular potential and advantages of each region, especially for the development of food, energy, maritime, tourism and industry. Industrialisation should be encouraged to develop downstream industries and the processing of raw materials.
• Accelerating economic development of region-based maritime and marine industries, including fish production, marine energy and minerals, nautical tourism and shipping • Selecting growth centres with strong prospects for high-value commodities.
• Increasing human resource capacity in science and technology to support the development of industrial clusters
In education development the new policy is to:
• Implement 12 years of compulsory education by expanding and improving the quality of secondary education and the equity of provision so accelerating the availability of trained human resources to meet the needs of the labour market
• Strengthen the curriculum and its implementation
• Improve the relevance and competitiveness of higher education
• Improve access, quality and relevance of education and skills training for jobs
In detail, strategic actions are articulated to:
development needs
• Increasing graduate competence in science according to labour market needs, especially in agriculture, maritime, tourism, manufacturing industry and the creative economy • Increasing graduate expertise and skills so as to reduce periods of unemployment
• Strengthening cooperation between higher education institutions and the world of work for research and development
• Developing entrepreneurship education and training and creating partnerships between higher education institutions and businesses
The policy of increasing science and technology capacity gives rise to the following intended activities:
• Increasing support for science and technology, including improvement of graduate output, infrastructure, institutions and networks
• Establishment of 100 techno parks, and science parks in every province
In science, technology and innovation the aim is to harness science and research in order to improve the competitiveness of the production sector, by:
• Supporting research and development that is relevant to the creation of technologies and new products
• Strengthening University-Industry-Government partnerships, again through the development of science and technology parks, incubators and venture capital. The development of Technopreneur is envisaged for this end.
The final relevant