Dzulfiqar Akbar Juhaendi, 2013
THE USE
OF JIGSAW TECHNIQUE IN IMPROVING STUDENTS’
READING COMPREHENSION
(A Quasi-Experimental Research in Eight Grade Students of a Junior High School in Bandung)
A Research Paper
Submitted in partial fulfillment of the requirements for Sarjana Pendidikan degree
By:
DZULFIQAR AKBAR JUHAENDI
0608977
ENGLISH EDUCATION DEPARTMENT
FACULTY OF LANGUAGE AND ARTS EDUCATION
INDONESIA UNIVERSITY OF EDUCATION
Dzulfiqar Akbar Juhaendi, 2013
THE USE OF JIGSAW TECHNIQUE IN
IMPROVING STUDENTS’ READING
COMPREHENSION
Oleh
DZULFIQAR AKBAR JUHAENDI
Sebuah skripsi yang diajukan untuk memenuhi salah satu syarat memperoleh gelar Sarjana pada Fakultas Pendidikan Pendidikan Bahasa dan Seni
©Dzulfiqar Akbar Juhaendi 2013 Universitas Pendidikan Indonesia
Januari 2013
Hak Cipta dilindungi undang-undang.
Dzulfiqar Akbar Juhaendi, 2013
PAGE OF APPROVAL
The Use of Jigsaw Technique in Improving Students’ Reading Comprehension
(A Quasi-Experimental Research in Eight Grade Students
of a Junior High School in Bandung)
By
Dzulfiqar Akbar Juhaendi
0608977
Approved by
First Supervisor Second Supervisor
Sudarsono M.I., M.A. Iyen Nurlaelawati S.Pd., M.Pd.
NIP. 196607051994031004 NIP. 197709062009122002
Head of English Education Department
Prof.Dr. H. Didi Suherdi, M.Ed.
ABSTRACT
ABSTRACT
In junior high school, teaching reading comprehension is very important in order to help students gain information and knowledge from written sources. A good teaching technique is necessary to improve students’ reading comprehension. This study investigated the use of Cooperative Learning: Jigsaw Technique in improving students’ reading comprehension and students’ responses to the use of the technique. Quasi experimental research was used in this study. The samples of this study were two classes of eight grade students of a junior high school in Bandung; one class became the control group and the other the experimental group. Each class consisted of 42 students. From the findings it is shown that the implementation of Jigsaw technique failed to improve the students’ reading comprehension as indicated by the statistical scores in the post test of the experimental group (M= 74.85), SE (1.54), and the post test of the control group (M=78.73), SE (1.40). The students’ responses in the questionnaires and observation proved that learning condition and class management became the causes of the ineffectiveness. In accordance with the result, it is recommended that teachers need to pay attention to the learning condition and class control when deciding to use Jigsaw technique.
First Supervisor Second Supervisor
Sudarsono M.I., M.A. Iyen Nurlaelawati S.Pd., M.Pd.
TABLE OF CONTENTS
Approval... i
Statement of Authorization... ii
Preface... iii
Acknowledgement... iv
Abstract... ... vi
Table of Contents... vii
List of Figures... xi
List of Table... xii
CHAPTER I: INTRODUCTION... 1
1.1 Background... 1
1.2 The Scope of the Research... 4
1.3 Research Questions... 5
1.4 The Aim of The Research... 5
1.5 Significance of the Research... 5
1.6 Clarification of Term... 5
1.7 Organization of the Paper... 6
CHAPTER II: THEORETICAL FOUNDATION 2.1 Reading Comprehension... 8
2.3 Jigsaw Technique... 13
2.3.1 Advantages of Jigsaw Technique... 14
2.3.2 Jigsaw Technique Procedures in Reading Comprehension... 16
2.4 Previous Studies... 17
CHAPTER III: RESEARCH METHODOLOGY... 3.1 Research Design... 18
3.1.1 Research Variables... 19
3.2 Research Hypothesis... 21
3.3 Data Collection... 21
3.3.1 Population... 21
3.3.2 Sample... 21
3.3.3 Research Instruments... 22
3.4 Research Procedure... 23
3.4.1 Material... 23
3.4.2 Organizing Teaching Procedure... 24
3.4.3 Instrument Try Out... 26
3.4.4 Pre-Test... 26
3.4.5 Treatment... 26
3.4.6 Post-Test... 27
3.5 Data Analysis... 28
3.5.2 Data Analysis on Instrument Try Out... 28
3.5.2.1 Validity... 28
3.5.2.2 Difficulty Level... 30
3.5.2.3 Discrimination... 31
3.5.2.4 Reliability... 33
3.5.3 Data Analyses on Pre-test and Post-test... 34
3.5.3.1 Testing The Normal Distribution... 34
3.5.3.2 The Variance Homogeneity... 35
3.5.3.3 The Independent t-test... 36
3.5.3.4 The Dependent t-test... 37
3.5.3.5 The Calculation of Effect Size... 37
3.5.4 Data Analyses of Questionnaire... 38
3.5.5 Data Analysis of Observation... 39
CHAPTER IV: FINDINGS AND DISCUSSION... 4.1 The Findings and discussion From The Test Score... 41
4.1.1 The Pre-test Score Analysis... 41
4.1.1.1 Normality of Distribution Test... 42
4.1.1.2 The Homogeneity of Variance Test………. 42
4.1.1.3 The Independent t-test………. 43
4.1.2 The Post-test Score Analysis... 43
4.1.2.2 The Homogeneity of Variance Test………. 44
4.1.2.3 The Independent t-test………. 44
4.1.2.4 The Dependent t-test……… 45
4.1.3 The Calculation of Effect Size... 46
4.1.4 Discussion of Findings from Test Score... 46
4.2 TheFindings and discussion from The Questioners………. 48
4.2.1 The Students’ Responses on Jigsaw Technique... 48
4.2.2 Discussion of Findings from the Questioners... 51
4.3 The Findingsand discussion from Observation... 52
4.3.1 Discussion of Findings from the Observation... 55
CHAPTER V: CONCLUSIONS AND SUGGESTIONS... 5.1 Conclusion... 57
5.2 Suggestion... 58
REFERENCES... 60
APPENDICES
LIST OF FIGURES
Figure 3.1 Variables... 20
Figure 4.1Students’ Score Improvements... 47
Figure 4.2 Students’ Responses of Using Jigsaw Technique... 48
Figure 4.3 Students’ Positive Responses... 49
LIST OF TABLES
Table 3.1 The Quasi-Experimental Design... 19
Table 3.2 Lesson Plan of Control and Experimental Groups... 25
Table 3.3 r Coefficient Correlation (Validity)... 29
Table 3.4 The Result of Validity Test... 29
Table 3.5 Criteria of difficulty Index... 30
Table 3.6 The Result of Difficulty Test... 31
Table 3.7 Criteria of Discrimination Index... 32
Table 3.8 Discrimination Index... 32
Table 3.9 r Coefficient Correlation (Reliability)... 33
Table 3.10 Effect Size Value... 38
Table 3.11 Criterion on Students’ Response... 39
Table 3.12 Checklist Table for the Teacher’s Activity... 40
Table 3.13 Checklist Table for the Students’ Activity... 40
Table 4.1 Students’ Activity... 52
CHAPTER I
BACKGROUND
Introduction
This chapter provides general outline of this study. It covers background
of the study, the scope of the research, research question statement of the
problems, aims of the research, significance of the research, clarification of terms,
and also organizations of the paper.
1.1 Background
Nowadays, many sources of knowledge such as books, journals, articles,
encyclopedias are written in English. In that condition, only people with good
English proficiency may deal with the sources. With that reason, in broadening
knowledge, language, in this case English, is one of the bridges that people are
required to master. Improving reading skill is the way to comprehend the sources.
Learning to read in English is considered very useful and essential in broadening
knowledge in many areas of expertise.
In order to gain knowledge from written sources, reading skill is important
to improve. According to Haris and Sipay (1980:8), reading is the ability to
recognize printed symbols and to comprehend their meanings. In line with that,
Burmaster (2005:3) states that reading is a process of determining words and
reading as a mental and cognitive process in trying to follow and respond to a
message from a writer.
Students have to be able to comprehend what they read. According to
Brown (2001) Reading comprehension is primarily a matter of developing
efficient comprehension strategies for the majorities of the second language
learners who are already literate in their native language. In line with this, Snow
(2002:11) states that reading comprehension is a process of extracting and
constructing meaning simultaneously by doing some interaction and involvement
with written language.
Most schools in Indonesia, especially in junior high schools use a method
which makes students passive learners (Nurkamto, 2000). That situation leads the
students to the consideration that English is hard to learn, especially reading. This
can be caused by several factors, for example the use of inappropriate method
where the teacher only makes the students as listeners in reading class. Besides,
the use of inappropriate textbooks also affects negatively to the students‟ reading
skill. In teaching reading to the students, the only way to gain the knowledge is by
listening to teachers‟ lecturing (Nurkamto, 2000).. This method makes teachers as
the only source of learning in the class. According to Novak (1998), conventional
teaching is concerned with the teacher being the controller of the learning
environment. It means that during the teaching activity, the teacher only used
lecturing as the method; giving instruction and explaining. During the activity, the
In accordance with the situations mentioned above, this research attempts
to find out if cooperative learning may be the answer to solve the problem of
teaching and learning reading skill. Johnson & Johnson (1999) state that
cooperative learning is one of the most remarkable and fertile areas of theory,
research and practice in education. It will only work if students work well in a
group in terms of accomplishing the learning goal.
Cooperative learning strategy is appropriate to apply in big classes- classes
with many students. Cooperative learning task goes a further step by encouraging
students to work together and by promoting an equal opportunity for every student
to participate in the activity, improving self-esteem enjoyment of school and
interethnic methods are key in this approach (Johnson, Johnson and Holobec,
1993; Slavin, 2005).
Cooperative learning has several teaching techniques. One of them is
Jigsaw technique. Jigsaw is developed by Elliot Aronson and first used in 1971 in
Austin, Texas. According to Aronson et al (1978):
Jigsaw is a cooperative learning strategy that enables each student of a „home group‟ to specialize in one aspect of a learning unit. Student meet with other members from other groups who are assigned the same aspect called “expert group” and after mastering the material, returnto the ‟home group‟ and teach or explain the material to their group members. Just as in a Jigsaw puzzle, each piece-each student‟s part- is essential for the completion and full understanding of the final product. If each student‟s part is essential, then each student is essential. That is what makes the Jigsaw strategy is so effective.
Jigsaw technique, as an effective way to improve students‟ reading
on their research journal explain that Jigsaw is a great way to introduce speaking
into a reading lesson. It provides a real opportunity for genuine communication. In
real life, we may tell people about a news article we have read, so this is a
classroom activity that is fairly authentic. The other learning journal by Mengduo
and Xiaoling (2010) shows that Jigsaw technique can give students a real learning
opportunity because every member‟s effort is required. Those conditions made the
students active learners.
Due to the reasons above, teaching with the conventional method is no
longer relevant to be applied in nowadays schools, in this case junior high school.
Students need more flexible methods to gain knowledge and teacher should find a
better way of teaching to make the students easier in gaining knowledge.
This research tries to find evidence of the statement by doing research on
the use of both conventional teaching and learning and cooperative learning and
this research titled: “The Use of Jigsaw Techniques to Improves Students’ Reading
Comprehension”
1.2. The Scope of the Research
This research focus on finding out the effectiveness of implementing with
Jigsaw techniques to improve students‟ reading comprehension. There are two
groups to be investigated, one as the control group and the other one as the
experimental group. For this present study, the participants are the second grade
1.3 Research Questions
The writer intends to figure out the problems‟ solutions in this research
through the following research questions:
1. Is Jigsaw technique effective in improving students‟ reading comprehension?
2. How do the students respond to the use of Jigsaw technique in teaching
reading?
1.4 The Aim of the Research
The aim of the research is to investigate whether Jigsaw technique is
effective in improving students‟ reading comprehension or not. Besides, it is also
aimed to finding out the students‟ responses toward the use of Jigsaw technique in
teaching reading.
1.5 Significance of the Research
This research is expected to provide positive contribution to the teachers
especially in teaching reading to the students. Jigsaw which is already broadly
known is expected to be one of the effective ways in improving students‟
knowledge. For the future researcher studying the same field, it can be reference
to study more detail in this area of research.
1. Effectiveness is a capability of producing an effect or the quality of being able
to bring about an effect.
2. Reading is the way of getting information from something that is written
3. Cooperative learning is a model of learning where the students learn and work
in small groups collaboratively or positive purposes in order to reach the
learning goals easier.
4. Jigsaw is a cooperative learning strategy that enables each student of a „home group‟ to specialize in one aspect of a learning unit. Students meet other
members from other groups who are assigned the same aspect called “expert group”. After mastering the material, they return to the ‟home group‟ and teach
or explain the material to their group members. Just as in a Jigsaw puzzle, each
piece-each student‟s part- is essential for the completion and full understanding of the final product. If each student‟s part is essential, then each student is
essential (Aronson et al, 1978).
1.7 Organization of the Paper
The paper is devided into five chapters. The chapters are subdivided into
subtopics that elaborate the issue given.
1. Chapter I is introduction. It comprises the background of the study,
background of the study, the scope of the research, research question statement
of the problems, aims of the research, significance of the research, clarification
2. Chapter II is theoritical foundation presenting the theoretical foundation on the
issue that is relevant to the present study.
3. Chapter III is research methodology. It comprises the method of research, the
data collection, and the data analyses.
4. Chapter IV is findings and discussion presenting the result of data collection,
data presentation, and explanation the result of the data analyses.
5. Chapter V is conclusions and suggestions.
CHAPTER III
RESEARCH METHODOLOGY
Introduction
This chapter provides a discussion of the methodology employed in
conducting the research. The description and account below involve: research
design, research variables, research hypothesis, data collection, research
procedure and data analysis.
3.1 Research Design
The research conducted quasi-experimental as the research design. The
quasi-experimental design was used because this method does not require random
sampling (Jackson, 2008:318). This research method provide the students with
pre-test, treatment, and post test to find out the effect of Jigsaw technique on the
student’s reading comprehension. Since there was no random sampling, the
sample in this research is considered as nonequivalent sample which consisted of
Experimental and Control group (Jackson, 2008: 323).
In this research, two classes were taken as the sample classes; those were
labeled as the experimental group and control group. The first group (e1) as the
experimental group was given a pre-test (X1), treated by using Jigsaw technique
(T), and then provided a post-test (X2). The second group (c1) as the control
post-test (X2) (Hatch and Farhady 1982:21),. Here is the representation of the
design:
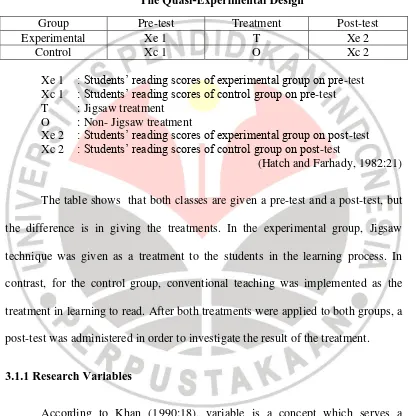
Table 3.1
The Quasi-Experimental Design
Group Pre-test Treatment Post-test
Experimental Xe 1 T Xe 2
Control Xc 1 O Xc 2
Xe 1 : Students’ reading scores of experimental group on pre-test Xc 1 : Students’ reading scores of control group on pre-test T : Jigsaw treatment
O : Non- Jigsaw treatment
Xe 2 : Students’ reading scores of experimental group on post-test Xc 2 : Students’ reading scores of control group on post-test
(Hatch and Farhady, 1982:21)
The table shows that both classes are given a pre-test and a post-test, but
the difference is in giving the treatments. In the experimental group, Jigsaw
technique was given as a treatment to the students in the learning process. In
contrast, for the control group, conventional teaching was implemented as the
treatment in learning to read. After both treatments were applied to both groups, a
post-test was administered in order to investigate the result of the treatment.
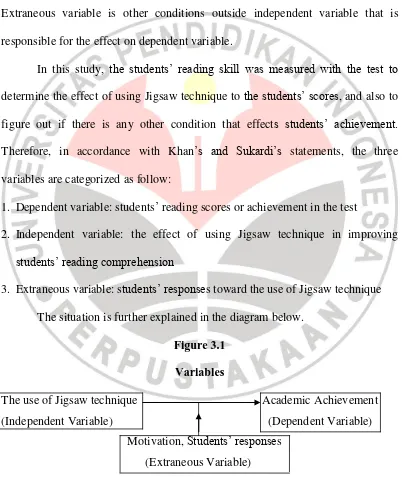
3.1.1 Research Variables
According to Khan (1990:18), variable is a concept which serves a
particular purpose and can be expressed in quantitative or qualitative value. There
were three variables in this research. Those variables were independent variable,
The independent variable is the prominent method which is manipulated
and measured by a researcher. The dependent variable is students' scores that are
observed and measured to determine the effect of independent variable (Sukardi,
2008:179). There is also another type of variable called extraneous variable.
Extraneous variable is other conditions outside independent variable that is
responsible for the effect on dependent variable.
In this study, the students’ reading skill was measured with the test to
determine the effect of using Jigsaw technique to the students’ scores, and also to
figure out if there is any other condition that effects students’ achievement.
Therefore, in accordance with Khan’s and Sukardi’s statements, the three
variables are categorized as follow:
1. Dependent variable: students’ reading scores or achievement in the test
2. Independent variable: the effect of using Jigsaw technique in improving
students’ reading comprehension
3. Extraneous variable: students’ responses toward the use of Jigsaw technique
The situation is further explained in the diagram below.
Figure 3.1
Variables
The use of Jigsaw technique Academic Achievement
(Independent Variable) (Dependent Variable)
Motivation, Students’ responses (Extraneous Variable)
3.2 Research Hypothesis
Basically this research began with null hypothesis (Ho). The hypothesis is
stated as follow:
Ho:m experimental=m control
The null hypothesis (Ho) means that there is no difference between the
experimental group and the control group in the mean of adjustment level
(Kranzler and Moursund, 1999).
3.3 Data Collection
The data collection in this study included population, sample, and research
instruments.
3.3.1 Population
According to Borg and Gall (1979: 179), population is all members of a
real or hypothetical set of people or object to which we wish to generalize the
result of the research. It is supported by Arikunto (2002) who stated that
population is the whole subject of the research. The population of the research
was the second grade of a junior high school in Bandung.
3.3.2 Sample
A sample is a part or a representation of the whole population that is
selected population (Kahn, 1990:27). The two choosen classes involved in the
research have relatively the same characteristics.
In accordance with the research design, the two classes were divided into
the experimental group and control group (VIII-8 as experimental class and VIII-9
as control class). Both classes consisted of 42 students.
3.3.3 Research Instruments
In this research, observations and a pre-test were used to gain the
information about the prior reading proficiency of the students from both groups.
Then a post-test and a set of questionnaire were distributed to obtain more
information about the students’ responses toward the use of Jigsaw technique in
improving their reading comprehension. All research instruments were also meant
to investigate the effectiveness of using Jigsaw technique in term of improving
students’ reading comprehension.
a. Pre-test
A pre-test was conducted to find out initial differences between the experimental and control groups’ levels in reading skill before receiving the
treatment. The pre-test was held in both control and experimental classes. The
students had 50 minutes to finish the test consisting of 26 multiple-choice
questions.
b. Post-test
A post-test was conducted to find out the students’ progress in reading
The post-test was held in both control and experimental classes. The students had
50 minutes to finish the test which consists of 26 multiple choice questions.
c. Observation
Observations were conducted to collect the data about the teacher and
students’ performances during the teaching and learning process. This study used
the focused observation method. This method was chosen because it could refine
the judgment about both the teacher and students’ activity (Hopkins, 1993). The
observations were conducted during the treatments applied to the experimental
group.
d. Questionnaire
The questionnaire consisted of ten questions. The questionnaire was aimed
to gather more information about the students’ responses towards the use of
Jigsaw technique based on the students’ point of view. The questionnaire was
only distributed to the experimental group. The students’ answers were collected
to find out the students’ perception towards the use of Jigsaw technique. The
questions were related to the topic and research questions. These questions
illustrated the students’ responses when they were using Jigsaw technique to
improve their reading comprehension.
3.4 Research Procedure
The texts used for teaching and learning process during the experimental
period were taken from English in Focus (2008) and English on Sky 2 (2007). The
materials consisted of narrative texts and questions. The narrative texts were
chosen as requirements from the school where the research was held.
3.4.2. Organizing teaching procedure
A teacher is responsible for the teaching and learning process, not only as
a performer but also a facilitator. First, the appropriate materials should be chosen
and prepared well. Second, teaching procedures were organized in the control and
experimental groups. They were written differently in both lesson plans for
experimental and control groups. Both lesson plans have different procedures. The
lesson plans for control group used conventional procedure. The lesson plans for
experimental group employed Jigsaw procedure which was adapted from Slavin
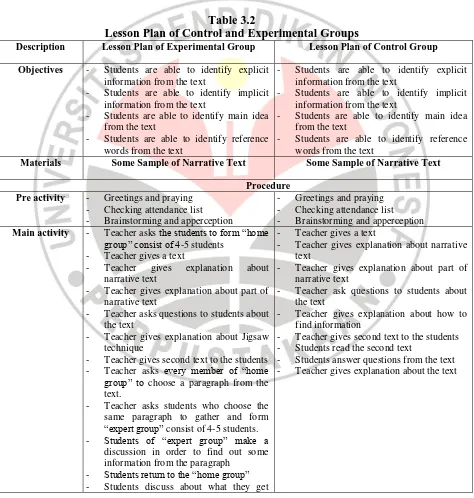
Table 3.2
Lesson Plan of Control and Experimental Groups
Description Lesson Plan of Experimental Group Lesson Plan of Control Group
Objectives - Students are able to identify explicit
Materials Some Sample of Narrative Text Some Sample of Narrative Text
Procedure Pre activity - Greetings and praying
- Checking attendance list - Brainstorming and apperception
- Greetings and praying - Checking attendance list - Brainstorming and apperception
Main activity - Teacher asks the students to form “home
group” consist of 4-5 students
- Teacher gives a text
- Teacher gives explanation about
narrative text
- Teacher gives explanation about part of
narrative text
- Teacher asks questions to students about
the text
- Teacher gives explanation about Jigsaw
technique
- Teacher gives second text to the students - Teacher asks every member of “home
group” to choose a paragraph from the text.
- Teacher asks students who choose the
same paragraph to gather and form “expert group” consist of 4-5 students.
- Students of “expert group” make a
discussion in order to find out some information from the paragraph
- Students return to the “home group” - Students discuss about what they get
- Teacher gives a text
- Teacher gives explanation about narrative
text
- Teacher gives second text to the students - Students read the second text
from the discussion in each “expert
Post activity - Teacher and students conclude what they have learnt today
- Students are given opportunity to ask
questions
- Teacher gives homework to students - Closing and Praying
- Teacher and students conclude what they
have learnt today
- Students are given opportunity to ask
questions
- Teacher gives homework to students - Closing and Praying
3.4.3. Instrument try out
Instrument try out was held before the pre-test and post-test were
administered to the two chosen classes. The purpose is to measure the validity and
reliability of the instrument. The try out was administered in another class which
was not involved during the research process.
3.4.4. Pre-test
The pre-test instrument consisted of 26 questions. The test was
administered to both the experimental and control groups during the school hours.
3.4.5. Treatments
The control and the experimental groups got different treatments. The
control group was treated using conventional teaching while Jigsaw technique was
implemented in the experimental group. Two types of lesson plans were used in
this research; the first was used for the experimental group and second one was
Four meetings were conducted for both groups. The duration for each
meeting was 80 minutes; each meeting consisted of pre-activity, main activity and
post-activity (see Table 3.2). The details are explained below.
The first meeting was conducted on may 16th, 2011. Before the giving the
explanation about the material, the students were given two passages in this
meeting. The first passage was entitled Takatuliang the Woodcarver and the
second was The Story of Sangkuriang and Tangkuban Perahu.
The second meeting was carried out on May 19th, 2011 for the control
group and May 20th 2011 for the experimental group. The students were given two
passages in this meeting. The first one was entitled The Cowardly Lion and the
second was Red Feather the Hen.
The third meeting was carried out on May 23rd, 2011 for both groups. As
the first meetings, the students were given two passages. the first was entitled
Little brother, little sister and the second was Beauty and the Beast.
The fourth meeting was conducted on May 26th, 2011 for the control group
and May 27th, 2011 for the experimental group, these were the last meeting.
Unlike the other meetings, in this meeting the students were only given one
passage. The title of the passage was The deathly Poppy Fields. After finishing the
activity, the teacher reviewed the whole materials. In this activity, teacher asked
the students about what was not clear yet about the materials.
At the end of the treatments, the post test was conducted. This test was
given to both groups (control and experimental groups) to find out the
improvements of their reading skill after the experimental group received the
treatments. The test was administered to both groups on May30th, 2011.
3.5 Data Analysis
Data analysis in the research includes scoring technique, data analysis on
the instrument try out, data analysis on the pre-test and post-test, data analysis on
the questioners, and data analysis on the observation.
3.5.1 Scoring
According to Arikunto (2003), there are two types of formula that can be
used in the process of scoring and data. They are formula with punishment and
formula with no punishment. The formula with no punishment was used in this
study. It means that there are no minus score when the students choose the wrong
answer.
In which: S: Score
R: Right Answer
3.5.2 Data analysis on instrument try out
3.5.2.1 Validity
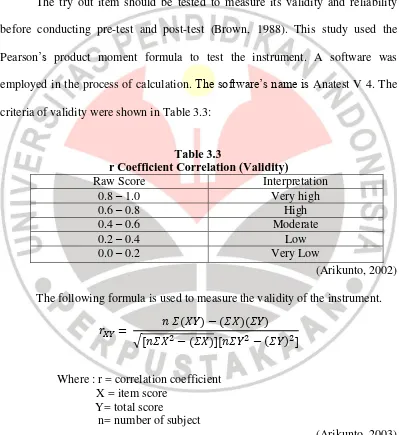
The try out item should be tested to measure its validity and reliability
before conducting pre-test and post-test (Brown, 1988). This study used the
Pearson’s product moment formula to test the instrument. A software was
employed in the process of calculation. The software’s name is Anatest V 4. The
criteria of validity were shown in Table 3.3:
Table 3.3
The following formula is used to measure the validity of the instrument.
√
Where : r = correlation coefficient X = item score
Y= total score
n= number of subject
(Arikunto, 2003)
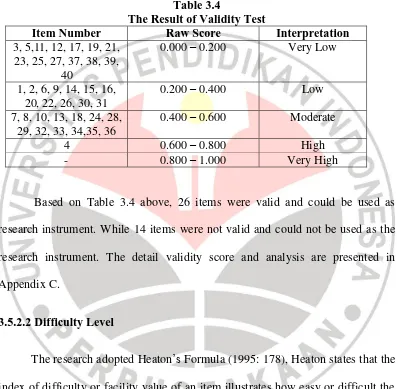
Validity test was intended to find out whether or not the test instrument
analyzed using corrected item total correlation in Anatest V.4 for windows. The
result of the statistical computation on the try out test is presented in the following
table.
Table 3.4
The Result of Validity Test
Item Number Raw Score Interpretation 3, 5,11, 12, 17, 19, 21,
research instrument. While 14 items were not valid and could not be used as the
research instrument. The detail validity score and analysis are presented in
Appendix C.
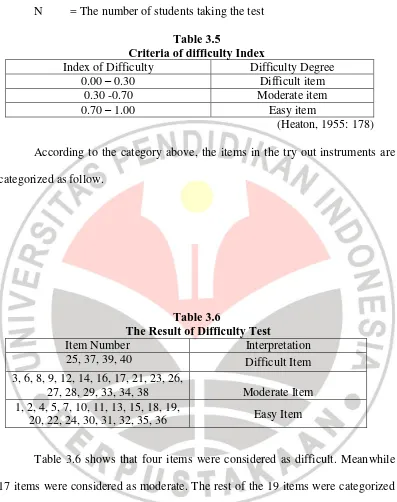
3.5.2.2 Difficulty Level
The research adopted Heaton’s Formula (1995: 178), Heaton states that the
index of difficulty or facility value of an item illustrates how easy or difficult the
certain item established in the test. In addition, the following formula was used to
calculate the index of difficulty of an item.
FV= R N
N = The number of students taking the test
Table 3.5
Criteria of difficulty Index
Index of Difficulty Difficulty Degree
0.00 – 0.30 Difficult item
0.30 -0.70 Moderate item
0.70 – 1.00 Easy item
(Heaton, 1955: 178)
According to the category above, the items in the try out instruments are
categorized as follow.
Table 3.6
The Result of Difficulty Test
Item Number Interpretation
25, 37, 39, 40 Difficult Item
3, 6, 8, 9, 12, 14, 16, 17, 21, 23, 26,
27, 28, 29, 33, 34, 38 Moderate Item 1, 2, 4, 5, 7, 10, 11, 13, 15, 18, 19,
20, 22, 24, 30, 31, 32, 35, 36 Easy Item
Table 3.6 shows that four items were considered as difficult. Meanwhile
17 items were considered as moderate. The rest of the 19 items were categorized
easy. Because the items taken as the instrument was only 26, the instrument
consists of 9 moderate items, and 17 easy items. The category of the instruments
is presented as follows
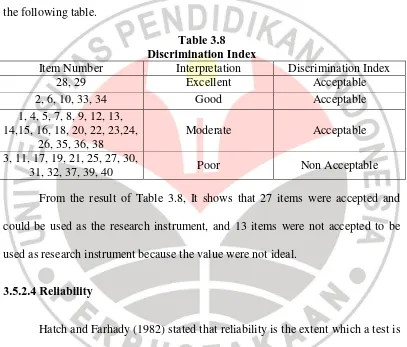
The discrimination index of an item indicates the extent to which the item
distinguishes between the tests, separating the more able tests from the less able
(Heaton, 1995:179).
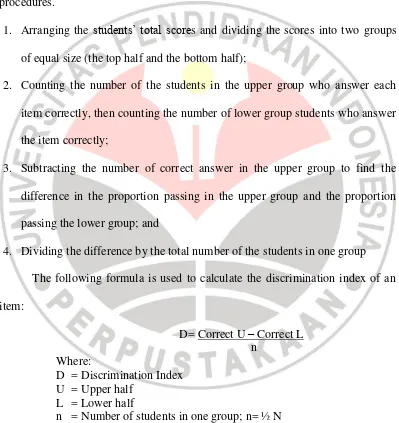
The present study are able to find the discrimination index by following the
procedures.
1. Arranging the students’ total scores and dividing the scores into two groups
of equal size (the top half and the bottom half);
2. Counting the number of the students in the upper group who answer each
item correctly, then counting the number of lower group students who answer
the item correctly;
3. Subtracting the number of correct answer in the upper group to find the
difference in the proportion passing in the upper group and the proportion
passing the lower group; and
4. Dividing the difference by the total number of the students in one group
The following formula is used to calculate the discrimination index of an
The criteria of discrimination index were shown in Table 3.7
Table 3.7
Discrimination Index Interpretation
The result of the statistical computation on the try out test is presented in
the following table.
Table 3.8 Discrimination Index
Item Number Interpretation Discrimination Index
28, 29 Excellent Acceptable
2, 6, 10, 33, 34 Good Acceptable
used as research instrument because the value were not ideal.
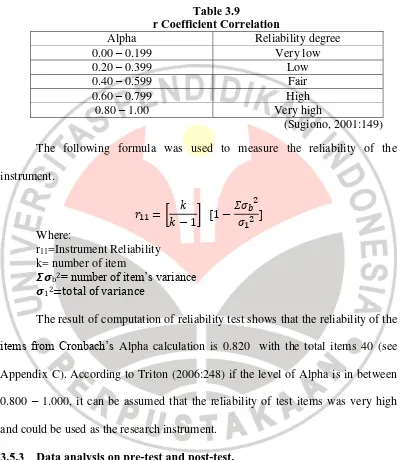
3.5.2.4 Reliability
Hatch and Farhady (1982) stated that reliability is the extent which a test is
produced in constant result when administered under similar condition. Another
statement comes from Arikunto (2002), an instrument is regarded as reliable if it
is reliable to collect the data required. To find out the reliability of the test items,
the present study used internal consistency method which is facilitated by
The result of the calculation was interpreted by the following criteria in
The result of computation of reliability test shows that the reliability of the
items from Cronbach’s Alpha calculation is 0.820 with the total items 40 (see
Appendix C). According to Triton (2006:248) if the level of Alpha is in between
0.800 – 1.000, it can be assumed that the reliability of test items was very high
and could be used as the research instrument.
3.5.3 Data analysis on pre-test and post-test.
Pre-test was administered at the beginning of the experiment in order to
obtain the initial equivalence between the groups. To determine the equivalence of
Post-test was given at the end of the experiment, and t-test was also used
to find out whether the hypothesis (null hypothesis) was rejected or accepted. If
the null hypothesis was accepted, it means that there was no difference between
the experimental and control groups after implementing Jigsaw technique.
3.5.3.1. Testing the normal distribution
In the research, the present study used Kolmogrov-Smirnov’s formula to
analyze the normal distribution. The table data output from SPSS 17.00 for
windows. The following formula was used to calculate the Normal distribution of
the data:
√
Where: µ = mean of x
σ = Standard deviation of x
π= 3.14159 e= 2.71828
These steps were taken to test the normal distribution:
1. Looking at the hypothesis
Ho= The distribution of the scores are normally distributed
H1= The distribution of the scores are not normally distributed
2. Analyzing the normal distribution by using Kolmogrov-smirnov formula in
3. Comparing the level of significance to test hypothesis. If the result is more
than the level of significance (0.05), the null hypothesis is accepted, the score
are normally distributed.
3.5.3.2 The variance homogeneity
In analyzing the variance homogeneity, the present study used Levene’s
formula in SPSS 17.00. These are the steps taken to test variance homogeneity:
1. Stating the hypothesis
Ho= the variance of the experimental and control group are homogeneous
H1= the variance of the experimental and control group are not homogeneous
2. Analyzing the variance homogeneity using SPSS 17.0 for windows
3. Comparing the level of significance value to test hypothesis. If Levene’s test
is significant at p< 0.05, it means that the null hypothesis is incorrect and the
variances are significantly difference. But, if Levene’s is non significant at
p>0.05. it means that the variance is approximately equal (Field, 2002).
3.5.3.3 The independent t-test
The primary purpose of t-test is to determine whether the means of the
two groups’ scores are different from a statistically significant degree as stated by
Kranzel and Moursound (1999:89). There are some requirements of the data
which must be considered before conducting t-test. First, the data should be
formed in the same type. Third, the data should have a normal distribution
(Coolidge, 2000: 143).
The procedures of t-test computation were as follow:
1. Stating the hypothesis
Ho= there is no difference between the pre-test and post-test means for the
experimental group and control group.
H1= there is significance difference between the pre-test and post-test mean
for the experimental group and for the control group.
2. Finding the t value with independent sample test computation in SPSS 17.00
for windows
3. Comparing the significance value with the level of significance for testing
hypothesis. If the significance value is less than the level of significance
(0.05), the null hypothesis is accepted. It means that the two groups are
equivalent.
3.5.3.4 The dependent t-test
The pre-test and post-test scores were analyzed by using dependent t-test
to investigate whether or not the pre-test and post-test scores of the experimental
group was significantly different (Hatch &Farhady, 1982: 114). These are the
procedures taken in dependent t-test:
1. Stating the hypothesis
Ho= there is no significant difference between the pre-test and post-test score
2. Finding the value with dependent sample test computation in SPSS 17.00 for
windows.
3. Comparing the level of significance from the calculation of dependent t-test
with the level of significance for testing the hypothesis. If the probability is
more than or equal than the level of significance, the null hypothesis is
accepted. But if the probability is less the level of significance, the null
hypothesis is rejected.
3.5.3.5 The calculation of effect size
In the research, to verify the influence of independent variable to the
dependent variable and to know how well the treatment works, the calculation of
size effect was employed. In order to determine the effect size in the independent
t-test, a correlation coefficient of effect size can be derived as presented below:
√
Where: r= Effect size
t= tobt or t value from the calculation of independent t-test
df= N1+N2-2
(Rosenthal, 1991:19)
After obtaining the value of r, the score was matched with the following
scale to interpret the effect size.
Table 3.10 Effect Size Value
Effect Size r value
Small 0.100
Large 0.371
(Coolidge, 2000: 151)
3.5.4 Data analysis of questionnaires
Data from the questionnaire were calculated with the frequency of the
students who answered the questions given. These data revealed the use of Jigsaw
technique in improving students’ reading comprehension. The results of
questionnaires were calculated using the formula below:
P= fo x100%
“no” was counted as zero. After that, the result was shown in order to find out the
students’ responses toward the use of Jigsaw technique in improving students’
reading comprehension by using the percentages as follows.
Table 3.11
Criterion on Students’ Response
No Percentage (%) Criterion
3.5.5 Data analysis of observation
Data from the observation were collected using checklist tables and each
category from the table was described briefly. There are two tables which were
used to collect the data. The first table was to record the teacher’s activities during
the treatments. The second table was to record the students’ activities during the
treatments. The format of the tables which were used to present the findings of the
data are as follow.
Table 3.12
Checklist Table for the Teacher’s Activity
1st Meeting
2nd Meeting
3rd Meeting
4th Meeting Explain the material
Ask student to form expert group
Respond to students’ question
Bring the students back to the home group
Checklist Table for the Students’ Activity
1st
Make a discussion in expert group
Return to the “home group”
Make a discussion in “home group”
Answer the questions about the text
CHAPTER V
CONCLUSIONS AND SUGGESTIONS
Introduction
This chapter consists of the research conclusions and suggestions.
Conclusions are drawn as the interpretation toward the results of the research
study while suggestions are written to be addressed to the English teachers and
further researchers.
5.1 Conclusions
Referring to the findings in the previous chapter, it can be concluded that
Jigsaw method used in the experimental group is not more effective than the
conventional method used in the control group. The result shows that the control
group (ME=78.73, SE= 1.40) had better improvement than the experimental
group (ME=74.85, SE= 1.54). The result also shows that the Jigsaw method gave
small effects on the students’ reading comprehension. In other words, Jigsaw
technique is not effective in improving students’ reading comprehension. The
result from the calculation of the effect size also shows that the treatment gave
small effect (r=0.201<.243) to the experimental group.
Besides, the findings also show that most of the students did not like the
Jigsaw technique. Moreover, the results of questionnaire show that most of the
findings show that most of the students thought that the Jigsaw technique did not
help them to increase their reading ability.
The students also thought that Jigsaw technique was confusing and it did
not make the students felt more interest in learning to read. The findings show that
the instruction about the Jigsaw procedure was not well-received. Besides, the
finding shows that the students often find someone who dominated the group
which made them less motivated in learning to read. The disruptive students were
also found during the treatments. It made the students could not focus on doing
their task during the treatments.
5.2 Suggestions
Having accomplished the study, there are some recommendations to
propose. Those recommendations go to both teacher and researchers. First, if
teachers intend to use Jigsaw technique, they should know about the learning
situation in the class. When teachers find some dominant students, teachers should
try to control them; otherwise they will try to dominate the others and it will give
a bad motivation to the others. Second, if teachers want to use Jigsaw technique
the teacher should make the students understand about this method: otherwise the
method will make the students confused and it will lead to the lack of enthusiasm
in learning to read.
For the next researchers who want to do the research on the use of Jigsaw
technique in improving students’ reading comprehension, researcher should be
more careful when implementing the technique. It will be better to ensure that the
researcher should control the dominant students to prevent them from dominating
the other students. This research paper is expected to be reference to make it
REFERENCES
Arikunto, Suharsimi, Dr., Prof.(2002). Prosedur penelitian: Suatu Pendekatan Praktek.
(2003). Prosedur Penelitian: Suatu Pendekatan Praktek (Edisi Revisi V). Jakarta: PT, Rineka Cipta.
Aronson et al. (1978).The Jigsaw Classroom.(0nline) Retrieved from
:http:www.cooperativelearning.com/instructional strategies online jigsaw.html [ January,20th,2011]
Avenoso, E. and Totoro, K. Comparison of retention rates of the first and second year co-op
and non-co-op students at small liberal arts college. Journal of Cooperative
education, 29, 6-13.
Borg, Walter R. and Gall, Meredith D. (1979). Educational Research: An Introduction. New York: Longman Inc.
Brown, H.D. (1987). Principles of Language Learning and Teaching.2nded. Englewood Cliffs, N.J. Prentice-Hall.
(2001). Teaching by Principles. New York: Addison Wesley Longman Inc.
Burmaster, Elizabeth.(2005) Reading: In Grades 3 through 8 and 10. Wisconsin: Department of Public Instruction.
Cohen, J. (1987). Statistical power analysis for the behavioral sciences (2nded.). Hillsdale, NJ: Lawrence-Erlbaum.
Coolidge, Federick L. (2000). Statistic “A Gentle Introduction”. London: Cromwell Press Ltd.
Cooper, H. (1989). Homework. White Plains, NY: Longman
Davies, Florence. (1995) Penguin English Applied Linguistic. London: Penguin Books Ltd.
David and Roger Johnson. 2001. "Cooperative Learning."Available at::
<http://www.clcrc.com/pages/cl.html>. [ February10th,2011]
Forgan, Harry W. and Mangrum II, Charles T.(1989). Teaching Content Area Reading Skills
(4th Edition). New York: Merrill Publishing Company.
Gall, M., Gall.J.P, And Borg, W.R. (2002) Educational Research: An Introduction. Pearson Education
Haris, D.D. and Sipay, L.(1980). Teaching Reading Vocabulary. New York: Holt Rinehart
Hatch, Evelyn. And Farhady, Hossein.(1982). Research Design and Statistic for Linguistic. Massachusetts, Newbury House Publisher Inc.
Hismanoglou, M. (2000).“Language Learning Strategies in Foreign Language Learning and Teaching”. The Internet TESL Journal, Vol. VI, No. 8, Aug 2000. http://iteslj.org/
Hopkins, D. (1993). A Teacher’s Guide to Classroom Research, 2nd Edition. Milton Kenyes, Open University Press.
Isjoni, (2007). Cooperative Learning :MengembangkanKemampuamBelajarBerkelompok. Jakarta :Alfabeta.
Jackson, Sherri L. (2008). Research Method and Statistic. A Critical Thinking Approach (3rd Edition). Wardsworth.
Johnson, D.W., Johnson R.T., and Holubec E.J. (1993) Cooperation in the Classroom: 6th
edition. Edina, MN: Interaction Book Company
Joyce, Bruce and Weil, Marsha (1992).Model of Teaching 4th Edition.Massachusetts: Simon and Schuster Inc.
(1994). Cooperative learning. San Clemente. CA: Kagan Publishing
Khan, M. S. (1990).Educational Research.New Delhi: ASHISH Publishing House
Kranzler,G and Moursund, J. (1999). Statisric for the Terrified: Second Edition. New Jersey: Prentice Hall Inc.
Lie, Anita (2008).Cooperative Learning: Mempraktikan Cooperative Learning di
Ruang-ruangKelas. Jakarta : PT Grasindo
MacmilanDictionary, http://www.macmilandictionary.com
Mengduo, Qiao and Xiaoling, Jin (2010).Jigsaw Strategy as a Cooperative Learning
Technique: Focusing on the Language Learners. Harbin: Harbin Institute of
Technology
Mukarto. (2007). English on Sky 2. Jakarta: Gramedia.
Novak, J.D. (1998). Learning, Creating and Using Knowledge: Concept maps as facilitative
Nurkamto, Joko. (2000). Problema Pengajaran Bahasa Inggris di Indonesia.Surakarta :UniversitasSebelasMaret.
Priyanto, Duwi (2010). Paham Analisa StatistikDengan SPSS. Yogyakarta: Mediakom
Rahmawati, Rahmawati.(2003). Improving Students Listening Comprehension Through Story
Telling Technique.Indonesia University of Education: Unpublished.
Roshental, R. (1991). Meta-Analytic Procedures for Social Research. California : Sage Publication Inc.
Simanjuntak, Edithia G., Dra. (1990) Developing reading skill for EFL Students.Jakarta :Depdikbud. DirjenPendidikanTingi P2LPTK.
Snow, Catherine E. (2002). Reading for Understanding:Toward an R&D Program in Reading
ComprehensionSanta Monica: RAND Education.
Slavin, Robert E.(2005). Cooperative Learning: Theory, Research and Practice. London: Allymand Bacon.
Smith, Nila B. and Robinson, H.A.(1980). Reading Instruction for Today’s Children(2nd
Edition). London Prentice-Hall Inc.
Spencer, Kagan. (1985).Cooperative learning resources for teachers. Riverside, CA: University of California at Riverside.
Sudjana(1996) Metoda Statistika. Bandung :Tarsito
Sugiyono.(2008). MetodePenelitianPendidikan (PendekatanKuantitatif, Kualitatif, dan
R&D). Bandung: CV Alfabeta.
Sukardi.(2008). MetodePenelitiamPendidikandanPrakteknya.Jakarta: BumiAksara
Triton, P.B. (2006). Terapan SPSS 13.00. Riset Statistic Parametrik. Yogyakarta: Andi
Offset.
Wallace, C. (1992). Reading. Oxford: Oxford University Press.
Wardiman, A., Jahur, Masduki B., dan Djusma, M. Sukirman. (2008). English in Focus for
Grade VIII Junior High School. Jakarta: Pusat Perbukuan, Departemen Pendidikan