Dengan meningkatnya kebutuhan jalur komunikasi data, khususnya pada
komunikasi dengan
bandwidth
rendah, PLC menjadi metode alternatif untuk
komunikasi sinyal kendali. Sistem PLC dalam Tugas Akhir ini telah dirancang
dan direalisasi dengan menggunakan modulasi FSK sebagai
physical layer,
dan
menggunakan protokol komunikasi UART. Sebagai pengendali digunakan
mikrokontroler MCS51. Sistem PLC pada Tugas Akhir ini dibuat dengan
konfigurasi satu
master
dua
slave
.
Within increasing demand in data communication line, especially in
narrow band communication, PLC can be alternative for control signal
communication. PLC system for this final project use FSK modulation as physical
layer, and use UART as communication protocol. Microcontroller MCS51 used
as controller. PLC system in this task uses one master two slave configuration.
This PLC system has been implemented as on off control with 48 outputs.
From the test has been held, these systems can work excellent with 10
mV
pp
data
ABSTRAK
...
i
ABSTRACT
... ii
KATA PENGANTAR
... iii
DAFTAR ISI
... v
DAFTAR GAMBAR
... viii
DAFTAR TABEL
... x
BAB I PENDAHULUAN
I.1 Latar Belakang ... 1
I.2 Perumusan Masalah ... 2
I.3 Tujuan ... 2
I.4 Pembatasan Masalah ... 2
I.5 Alat yang digunakan ... 2
I.6 Sistematika Pembahasan ... 2
BAB II TEORI PENUNJANG
II.1 UART
(
Universal Asynchronous Receive/Transmit
) ...
4
II.2 Modulasi FSK (
Frequency Shift Keying
) ... 5
II.2.1
Modulasi Langsung ...
6
II.2.2
Modulasi dengan FractionalN Synthesizer ...….
8
II.3 Demodulator FSK Exar XR2211... 9
II.4 LPF
(Low Pass Filter
) ……... 13
II.5 BPF (
Band Pass Filter
) ……... 14
II.6 Rangkaian Dasar Mikrokontroler …... 15
III.2 Perancangan Dan Realisasi BPF ... 21
III.3 Perancangan Dan Realisasi Modulator FSK ... 22
III.4 Perancangan Dan Realisasi Demodulator FSK ... 23
III.5 Perancangan Dan Realisasi Rangkaian Mikrokontroler ... 25
III.5.1
Rangkaian Mikrokontroler
Master
... 25
III.5.2
Rangkaian Mikrokontroler
Slave ...
... 26
III.6 Penggabungan Modul – Modul PLC
Master Controller
... 27
III.7 Penggabungan Modul – Modul PLC
Slave Controller
... 28
III.8 Perancangan Dan Realisasi Program Mikrokontroler ... 28
BAB IV UJI COBA ALAT
IV.1 Karakteristik LPF ... 34
IV.2 Karakteristik BPF ... 35
IV.3 Karakteristik
Modulator
FSK ... 35
IV.4 Karakteristik
Demodulator
FSK ... 36
IV.5 Karakteristik Sinyal FSK Di Jalur Listrik DC ... 37
IV.6 Karakteristik Noise Di Jalur Listrik DC ... 38
IV.7 Pengujian Sistem PLC ... 38
BAB V KESIMPULAN DAN SARAN
V.1 Kesimpulan ... 40
V.2 Saran ... 40
Listing Program Mikrokontroler
Master
... A1
Listing Program Mikrokontroler
Slave
A
....
... A6
Listing Program Mikrokontroler
Slave
B
....
... A10
Lampiran B
Rangkaian Keseluruhan Sistem PLC ... B1
Layout PCB Mikrokontroler
Master
... B2
Layout PCB Mikrokontroler
Slave ...
... B3
Layout PCB FSK
modulator ...
... B4
Layout PCB FSK
demodulator ...
... B4
Lampiran C
IC LM 555 ... C1
IC Exar XR 2211 ... C11
Lampiran D
1. Gambar II1 Timing diagram UART ...
5
2. Gambar II2 Spektrum frekuensi FSK ...
5
3. Gambar II3 Sinyal FSK ...
6
4. Gambar II4 Modulasi langsung dengan VCO ...
7
5. Gambar II5 IC 555 sebagai FSK
modulator ....
...
7
6. Gambar II6
FractionalN Synthesizer
...
8
7. Gambar II7 FSK
demodulator
...
9
8. Gambar II8
Tracking Frequency
...
11
9. Gambar II9
Low pass filter...
... 13
10. Gambar II10
High pass filter...
... 14
11. Gambar II11 Diagram Blok mikrokontroler AT89S52 ...
15
12. Gambar II12 Rangkaian dasar mikrokontroler AT89S52 ...
16
13. Gambar II13 SPST (
Single Pole Single Throw
) ...
17
14. Gambar II14 SPDT (
Single Pole Double Throw
) ... 17
15. Gambar II15 DPST (
Double Pole Single Throw
) ... 18
16. Gambar II16 DPDT (
Double Pole Double Throw
) ...
18
17. Gambar III1 Blok diagram PLC ...
19
18. Gambar III2
Low Pass Filter...
... 20
19. Gambar III3
High Pass Filter ...
... 21
20. Gambar III4
Voltage Controlled Oscillator
dengan IC 555 ...
23
21. Gambar III5 FSK
Demodulator...
...
25
22. Gambar III6
Master Controller ...
...
26
23. Gambar III7
Slave Controller ...
... 27
24. Gambar III8
Master PLC controller
...
27
25. Gambar III9
Slave PLC controller
...
28
26. Gambar III10 Flowchart program
master controller ...
...
29
27. Gambar III11 Flowchart program
slave controller .
...
29
28. Gambar III12 SFR
Timer Mode
...
30
32. Gambar IV1 Karakteristik LPF (logaritmis)...
.
...
34
33. Gambar IV2 Karakteristik BPF (logaritmis)...
.
...
35
34. Gambar IV3 Respon PLL
demodulator
FSK...
.
...
35
1. Tabel III1 SFR
serial mode
...
32
2. Tabel IV1 Karakteristik LPF (
Low Pass Filter
) ...
34
3. Tabel IV2 Karakteristik BPF (
Band Pass Filter
) ...
35
4. Tabel IV3 Karakteristik
modulator
FSK ...
35
5. Tabel IV4 Karakteristik FSK demodulator terhadap frekuensi ... 36
6. Tabel IV5 Karakteristik
demodulator
FSK terhadap tegangan ...
37
7. Tabel IV6 Karakteristik sinyal FSK Di Jalur Listrik DC terhadap
beban terpasang ... 37
8. Tabel IV7 Karakteristik sinyal FSK Di Beban terhadap
beban terpasang ... 38
9. Tabel IV8 Karakteristik
noise
di jalur listrik DC ... 38
Listing program
master controller
$mod51
CALL INIT
LAGI:
MOV A,P1
MOV R5,A
MOV P0,#11111110B
JB P0.4,NO2
MOV R0,#01H
NO2:
JB P0.5,NO3
MOV R0,#03H
NO3:
JB P0.6,NOA
MOV R0,#05H
NOA:
JB P0.7,NO4
MOV A,R5
ANL A,#0FH
ADD A,#0F0H
MOV R4,A
MOV A,R0
RR A
RR A
RR A
RR A
MOV A,R5
ANL A,#0F0H
RL A
RL A
RL A
RL A
ADD A,#0F0H
MOV R4,A
MOV A,R0
INC A
RR A
RR A
RR A
RR A
ADD A,#0FH
ANL A,R4
MOV P2,A
CALL KIRIM
NO4:
MOV P0,#11111101B
JB P0.4,NO5
MOV R0,#07H
NO5:
JB P0.5,NO6
MOV R0,#09H
NO6:
JB P0.6,NOB
MOV R0,#0BH
NOB:
MOV P0,#11111011B
JB P0.4,NO8
NO8:
MOV R0,#0DH
JB P0.5,NO9
NO9:
MOV R0,#0FH
JB P0.6,NOC
NOC:
JB P0.7,NOSTARR
NOSTARR:
MOV P0,#11110111B
JB P0.4,NO0
MOV R4,#0F0H
MOV A,R0
RR A
RR A
RR A
RR A
ADD A,#0FH
ANL A,R4
MOV P2,A
CALL KIRIM
NO0:
JB P0.5,NOKRESS
NOKRESS:
JB P0.6,NOD
MOV R4,#0FFH
MOV A,R0
RR A
RR A
RR A
RR A
ADD A,#0FH
ANL A,R4
MOV P2,A
CALL KIRIM
CALL DELAY
MOV R4,#0FFH
MOV A,R0
INC A
RR A
RR A
RR A
RR A
JB P0.7,NON
NON:
LJMP LAGI
INIT:
MOV P0,#00H
MOV P1,#00H
MOV P2,#00H
MOV SP, #30H
MOV SCON, #50H
;inisialisasi baud rate (9600 bps)
MOV TMOD, #20H
MOV TL1, #0FDH
MOV TH1, #0FDH
MOV PCON, #00H
SETB TR1
RET
KIRIM:
CLR TI
MOV SBUF,A
JNB TI,$
RET
DELAY:
DLY0:
MOV R6,#0FFH
DLY1:
DJNZ R6,DLY1
RET
Listing program
slave controler
SLAVE A
$mod51
MOV R0,#00H
MOV R1,#00H
MOV R2,#00H
MOV R3,#00H
MOV R4,#00H
MOV R5,#00H
MOV R6,#00H
MOV R7,#00H
MOV P0,00H
MOV P1,00H
MOV P2,00H
LJMP START
TERIMA:
JNB RI,$
MOV A,SBUF
MOV R1,A
CLR RI
MOV A,#11110000B
ANL A,R1
MOV R2,A
MOV A,#00001111B
ANL A,R1
RETI
START:
MOV SP, #30H
MOV SCON, #50H
;inisialisasi baud rate (9600 bps)
MOV TMOD, #20H
MOV TL1, #0FDH
MOV TH1, #0FDH
MOV PCON, #00H
SETB TR1
ULANG:
CALL TERIMA
CJNE R2,#10H,ADDB
MOV A,R3
ORL A,#0F0H
MOV R5,A
MOV A,P0
ANL A,R5
ORL A,R3
MOV P0,A
ADDB:
CJNE R2,#20H,ADDCO
MOV A,R4
ORL A,#0FH
MOV R5,A
MOV A,P0
ANL A,R5
ORL A,R4
MOV P0,A
ADDCO:
ORL A,#0F0H
MOV R5,A
MOV A,P1
ANL A,R5
ORL A,R3
MOV P1,A
ADDD:
CJNE R2,#40H,ADDE
MOV A,R4
ORL A,#0FH
MOV R5,A
MOV A,P1
ANL A,R5
ORL A,R4
MOV P1,A
ADDE:
CJNE R2,#50H,ADDF
MOV A,R3
ORL A,#0F0H
MOV R5,A
MOV A,P2
ANL A,R5
ORL A,R3
MOV P2,A
ADDF:
CJNE R2,#60H,ADDG
MOV A,R4
ORL A,R4
MOV P2,A
ADDG:
LJMP ULANG:
DELAY:
MOV R0,#0FH
DLY1:
MOV R1,#0FFH
DLY0:
SLAVE B
$mod51
MOV R0,#00H
MOV R1,#00H
MOV R2,#00H
MOV R3,#00H
MOV R4,#00H
MOV R5,#00H
MOV R6,#00H
MOV R7,#00H
MOV P0,00H
MOV P1,00H
MOV P2,00H
LJMP START
TERIMA:
JNB RI,$
MOV A,SBUF
MOV R1,A
CLR RI
MOV A,#11110000B
ANL A,R1
MOV R2,A
MOV A,#00001111B
ANL A,R1
START:
MOV SP, #30H
MOV SCON, #50H
;inisialisasi baud rate (9600 bps)
MOV TMOD, #20H
MOV TL1, #0FDH
MOV TH1, #0FDH
MOV PCON, #00H
SETB TR1
ULANG:
CALL TERIMA
CJNE R2,#70H,ADDB
MOV A,R3
ORL A,#0F0H
MOV R5,A
MOV A,P0
ANL A,R5
ORL A,R3
MOV P0,A
ADDB:
CJNE R2,#80H,ADDCO
MOV A,R4
ORL A,#0FH
MOV R5,A
MOV A,P0
ANL A,R5
ORL A,R4
MOV P0,A
ADDCO:
CJNE R2,#90H,ADDD
MOV A,R3
MOV R5,A
MOV A,P1
ANL A,R5
ORL A,R3
MOV P1,A
ADDD:
CJNE R2,#A0H,ADDE
MOV A,R4
ORL A,#0FH
MOV R5,A
MOV A,P1
ANL A,R5
ORL A,R4
MOV P1,A
ADDE:
CJNE R2,#B0H,ADDF
MOV A,R3
ORL A,#0F0H
MOV R5,A
MOV A,P2
ANL A,R5
ORL A,R3
MOV P2,A
ADDF:
CJNE R2,#C0H,ADDG
MOV A,R4
MOV P2,A
ADDG:
LJMP ULANG:
DELAY:
MOV R0,#0FH
DLY1:
MOV R1,#0FFH
DLY0:
LAMPIRAN B
Skema Keseluruhan Sistem PLC
Ja
lu
r L
is
tr
ik
D
C
.6
15
m
H
10
0
nF
12
PCB MASTER CONTROLLER
PCB Bottom
PCB SLAVE CONTROLLER
PCB Bottom
PCB FSK MODULATOR
...the analog plus company
TMTone Decoder
June 1997-3
FEATURES
D Wide Frequency Range, 0.01Hz to 300kHz
D Wide Supply Voltage Range, 4.5V to 20V
D HCMOS/TTL/Logic Compatibility
D FSK Demodulation, with Carrier Detection
D Wide Dynamic Range, 10mV to 3V rms
D Adjustable Tracking Range, +1% to 80%
D Excellent Temp. Stability, +50ppm/°C, max.
APPLICATIONS
D Caller Identification Delivery
D FSK Demodulation
D Data Synchronization
D Tone Decoding
D FM Detection
D Carrier Detection
GENERAL DESCRIPTION
The XR-2211 is a monolithic phase-locked loop (PLL) system especially designed for data communications applications. It is particularly suited for FSK modem applications. It operates over a wide supply voltage range of 4.5 to 20V and a wide frequency range of 0.01Hz to 300kHz. It can accommodate analog signals between 10mV and 3V, and can interface with conventional DTL, TTL, and ECL logic families. The circuit consists of a basic PLL for tracking an input signal within the pass band, a
quadrature phase detector which provides carrier detection, and an FSK voltage comparator which provides FSK demodulation. External components are used to independently set center frequency, bandwidth, and output delay. An internal voltage reference proportional to the power supply is provided at an output pin.
The XR-2211 is available in 14 pin packages specified for military and industrial temperature ranges.
ORDERING INFORMATION
Part No. Package
Operating Temperature Range
XR-2211M 14 Pin CDIP (0.300”) -55°C to +125°C
XR-2211N 14 Pin CDIP (0.300”) -40°C to +85°C
XR-2211P 14 Pin PDIP (0.300”) -40°C to +85°C
INP
TIM C1
TIM C2 TIM R VREF
COMP I
9 NC 1
VCC
4 GND
2
3 LDF 11 LDO
6 LDOQ
5 LDOQN 14
13 12 10 8
7 DO Pre Amplifier
Lock Detect Comparator Loop
q-Det
Internal Reference
VREF
FSK Comp Quad
[image:30.612.74.525.122.420.2]q-Det VCO
PIN CONFIGURATION
VCC
14 Lead CDIP, PDIP (0.300”)
TIM C1 TIM C2 TIM R LDO VREF NC COMP I INP LDF GND LDOQN LDOQ DO 1 2 3 4 5 6 7 14 13 12 11 10 9 8
14 Lead SOIC (Jedec, 0.150”) 14 1 2 3 4 5 6 7 13 12 11 10 9 8 VCC INP LDF GND LDOQN LDOQ DO TIM C1 TIM C2 TIM R LDO VREF NC COMP I PIN DESCRIPTION
Pin # Symbol Type Description
1 VCC Positive Power Supply.
2 INP I Receive Analog Input.
3 LDF O Lock Detect Filter.
4 GND Ground Pin.
5 LDOQN O Lock Detect Output Not. This output will be low if the VCO is in the capture range.
6 LDOQ O Lock Detect Output. This output will be high if the VCO is in the capture range.
7 DO O Data Output. Decoded FSK output.
8 COMP I I FSK Comparator Input.
9 NC Not Connected.
10 VREF O Internal Voltage Reference. The value of VREF is VCC/2 - 650mV.
11 LDO O Loop Detect Output. This output provides the result of the quadrature phase detection.
12 TIM R I Timing Resistor Input. This pin connects to the timing resistor of the VCO.
13 TIM C2 I Timing Capacitor Input. The timing capacitor connects between this pin and pin 14.
ELECTRICAL CHARACTERISTICS
Test Conditions: VCC = 12V, TA = +25°C, RO = 30KW, CO = 0.033mF, unless otherwise specified.
Parameter Min. Typ. Max. Unit Conditions
General
Supply Voltage 4.5 20 V
Supply Current 4 7 mA R0 > 10KW. See Figure 4.
Oscillator Section
Frequency Accuracy +1 +3 % Deviation from fO = 1/R0 C0
Frequency Stability
Temperature +20 +50 ppm/°C See Figure 8.
Power Supply 0.05 0.5 %/V VCC = 12 +1V. See Figure 7.
0.2 %/V VCC = + 5V. See Figure 7.
Upper Frequency Limit 100 300 kHz R0 = 8.2KW, C0 = 400pF
Lowest Practical Operating Frequency
0.01 Hz R0 = 2MW, C0 = 50mF
Timing Resistor, R0 - See Figure 5
Operating Range 5 2000 KW
Recommended Range 5 KW See Figure 7 and Figure 8.
Loop Phase Dectector Section
Peak Output Current +150 +200 +300 mA Measured at Pin 11
Output Offset Current 1 mA
Output Impedance 1 MW
Maximum Swing +4 + 5 V Referenced to Pin 10
Quadrature Phase Detector Measured at Pin 3
Peak Output Current 100 300 mA
Output Impedance 1 MW
Maximum Swing 11 VPP
Input Preampt Section Measured at Pin 2
Input Impedance 20 KW
Input Signal
Voltage Required to
Cause Limiting 2 10 mV rms
Notes
Parameters are guaranteed over the recommended operating conditions, but are not 100% tested in production.
DC ELECTRICAL CHARACTERISTICS
(CONT’D)Test Conditions: VCC = 12V, TA = +25°C, RO = 30KW, CO = 0.033mF, unless otherwise specified.
Parameter Min. Typ. Max. Unit Conditions
Voltage Comparator Section
Input Impedance 2 MW Measured at Pins 3 and 8
Input Bias Current 100 nA
Voltage Gain 55 70 dB RL = 5.1KW
Output Voltage Low 300 500 mV IC = 3mA
Output Leakage Current 0.01 10 mA VO = 20V
Internal Reference
Voltage Level 4.9 5.3 5.7 V Measured at Pin 10
Output Impedance 100 W AC Small Signal
Maximum Source Current 80 mA
Notes
Parameters are guaranteed over the recommended operating conditions, but are not 100% tested in production.
Bold face parameters are covered by production test and guaranteed over operating temperature range.
Specifications are subject to change without notice
ABSOLUTE MAXIMUM RATINGS
Power Supply . . . 20V Input Signal Level . . . 3V rms Power Dissipation . . . 900mW
Package Power Dissipation Ratings
CDIP . . . 750mW Derate Above TA = 25°C . . . 8mW/°C
PDIP . . . 800mW Derate Above TA = 25°C . . . 60mW/°C
SOIC . . . 390mW Derate Above TA = 25°C . . . 5mW/°C
SYSTEM DESCRIPTION
The main PLL within the XR-2211 is constructed from an input preamplifier, analog multiplier used as a phase detector and a precision voltage controlled oscillator (VCO). The preamplifier is used as a limiter such that input signals above typically 10mV rms are amplified to a constant high level signal. The multiplying-type phase detector acts as a digital exclusive or gate. Its output (unfiltered) produces sum and difference frequencies of the input and the VCO output. The VCO is actually a current controlled oscillator with its normal input current (fO) set by a resistor (R0) to ground and its driving current
with a resistor (R1) from the phase detector.
The output of the phase detector produces sum and difference of the input and the VCO frequencies
(internally connected). When in lock, these frequencies are fIN+ fVCO (2 times fIN when in lock) and fIN - fVCO (0Hz
when lock). By adding a capacitor to the phase detector output, the 2 times fIN component is reduced, leaving a
DC voltage that represents the phase difference between the two frequencies. This closes the loop and allows the VCO to track the input frequency.
PRINCIPLES OF OPERATION
Signal Input (Pin 2): Signal is AC coupled to this terminal. The internal impedance at pin 2 is 20KW. Recommended input signal level is in the range of 10mV rms to 3V rms.
Quadrature Phase Detector Output (Pin 3): This is the high impedance output of quadrature phase detector and is internally connected to the input of lock detect voltage comparator. In tone detection applications, pin 3 is connected to ground through a parallel combination of RD
and CD (see Figure 3) to eliminate the chatter at lock
detect outputs. If the tone detect section is not used, pin 3 can be left open.
Lock Detect Output, Q (Pin 6): The output at pin 6 is at “low” state when the PLL is out of lock and goes to “high” state when the PLL is locked. It is an open collector type output and requires a pull-up resistor, RL, to VCC for
proper operation. At “low” state, it can sink up to 5mA of load current.
Lock Detect Complement, (Pin 5): The output at pin 5 is the logic complement of the lock detect output at pin 6. This output is also an open collector type stage which can sink 5mA of load current at low or “on” state.
FSK Data Output (Pin 7): This output is an open collector logic stage which requires a pull-up resistor, RL, to VCC for
proper operation. It can sink 5mA of load current. When decoding FSK signals, FSK data output is at “high” or “off” state for low input frequency, and at “low” or “on” state for high input frequency. If no input signal is present, the logic state at pin 7 is indeterminate.
FSK Comparator Input (Pin 8): This is the high impedance input to the FSK voltage comparator. Normally, an FSK post-detection or data filter is connected between this terminal and the PLL phase detector output (pin 11). This data filter is formed by RF
and CF (see Figure 3.) The threshold voltage of the
comparator is set by the internal reference voltage, VREF, available at pin 10.
Reference Voltage, VREF (Pin 10): This pin is internally biased at the reference voltage level, VREF: VREF = VCC /2
- 650mV. The DC voltage level at this pin forms an internal reference for the voltage levels at pins 5, 8, 11 and 12. Pin
10 must be bypassed to ground with a 0.1mF capacitor for proper operation of the circuit.
Loop Phase Detector Output (Pin 11): This terminal provides a high impedance output for the loop phase detector. The PLL loop filter is formed by R1 and C1 connected to pin 11 (see Figure 3.) With no input signal, or with no phase error within the PLL, the DC level at pin 11 is very nearly equal to VREF. The peak to peak voltage swing
available at the phase detector output is equal to 2 x VREF.
VCO Control Input (Pin 12): VCO free-running frequency is determined by external timing resistor, R0,
connected from this terminal to ground. The VCO free-running frequency, fO, is:
fO+ R1
0·C0 Hz
where C0 is the timing capacitor across pins 13 and 14.
For optimum temperature stability, R0 must be in the range of 10KW to 100KW (see Figure 9.)
This terminal is a low impedance point, and is internally biased at a DC level equal to VREF. The maximum timing
current drawn from pin 12 must be limited to < 3mA for proper operation of the circuit.
VCO Timing Capacitor (Pins 13 and 14): VCO frequency is inversely proportional to the external timing capacitor, C0, connected across these terminals (see
Figure 6.) C0 must be non-polar, and in the range of 200pF to 10mF.
VCO Frequency Adjustment: VCO can be fine-tuned by connecting a potentiometer, RX, in series with R0 at pin 12
(see Figure 10.)
VCO Free-Running Frequency, fO: XR-2211 does not
have a separate VCO output terminal. Instead, the VCO outputs are internally connected to the phase detector sections of the circuit. For set-up or adjustment purposes, the VCO free-running frequency can be tuned by using the generalized circuit in Figure 3, and applying an alternating bit pattern of O’s and 1’s at the known mark and space frequencies. By adjusting R0, the VCO can then be tuned to obtain a 50% duty cycle on the FSK output (pin 7). This will ensure that the VCO fO value is
ÎÎÎ ÎÎÎ ÎÎÎ ÎÎÎ ÎÎÎ ÎÎÎ ÎÎÎ ÎÎÎ ÎÎÎ ÎÎÎ ÎÎÎ ÎÎÎ ÎÎÎ Loop Filter ÎÎÎ ÎÎÎ ÎÎÎ ÎÎ ÎÎ ÎÎ ÎÎÎ ÎÎÎ FSK Output FSK Comp Data Filter Det ÎÎ ÎÎ ÎÎ ÎÎÎ Lock Detect Outputs Lock Detect Comp Det VCO Lock Detect Filter Preamp Input φ φ VCC Rl RB Loop Phase Detect C 1 11 R1 RF CF 8 FSK Comp. 7 Internal Reference 6 LDOQ 10 Lock Detect Comp. VCO 14 13 12 R0 C0 2 0.1mF Input Signal Quad Phase Detect RD 3 CD 5 LDOQN
Figure 2. Functional Block Diagram of a Tone and FSK Decoding System Using XR-2211
φ
φ
[image:35.612.163.416.103.313.2]0.1mF
Figure 3. Generalized Circuit Connection for FSK and Tone Detection
DESIGN EQUATIONS
(All resistance in W, all frequency in Hz and all capacitance in farads, unless otherwise specified)
(See Figure 3 for definition of components)
1. VCO Center Frequency, fO:
fO+ 1 R0·C0
2. Internal Reference Voltage, VREF (measured at pin 10):
VREF+
ǒ
VCC2
Ǔ
–650mV in volts3. Loop Low-Pass Filter Time Constant, t:
t+ C1·RPP (seconds)
where:
RPP+
ǒ
R1·RF
R1)RF
Ǔ
if RF is 1 or CF reactance is 1, then RPP = R1
4. Loop Damping, j:
z+
ǒ
1250·C0R1·C1
Ǔ
Ǹ
Note: For derivation/explanation of this equation, please see TAN-011.
5. Loop-tracking
bandwidth, "+ Dff 0
Df f0
+ R0 R1
Tracking Bandwidth
Df Df
6. FSK Data filter time constant, tF:
tF+
RB · RF
( RB ) RF)·CF (seconds)
7. Loop phase detector conversion gain, Kd: (Kd is the differential DC voltage across pin 10 and pin11, per unit of phase error at phase detector input):
Kd+ VREF · R1 10, 000·p
ƪ
volt radian
ƫ
Note: For derivation/explanation of this equation, please see TAN-011.
8. VCO conversion gain, Ko: (Ko is the amount of change in VCO frequency, per unit of DC voltage change at pin 11):
K0+ –2
p
VREF·C0·R1
+
ǒ
radianvoltńsecondǓ
9. The filter transfer function:
F(s)+ 1 1 ) SR1·C1
at 0 Hz. S = Jw and w = 0
10. Total loop gain. KT:
KT+KO·Kd·F(s)+
ǒ
RF5, 000·C0·(R1)RF)
Ǔ
ƪ
1 seconds
ƫ
11. Peak detector current IA:
IA+ VREF
20, 000 (VREF in volts and IA in amps)
APPLICATIONS INFORMATION
FSK Decoding
Figure 10 shows the basic circuit connection for FSK decoding. With reference to Figure 3 and Figure 10, the functions of external components are defined as follows: R0 and C0 set the PLL center frequency, R1 sets the system bandwidth,
and C1 sets the loop filter time constant and the loop damping factor. CF and RF form a one-pole post-detection filter for the FSK data output. The resistor RB from pin 7 to pin 8 introduces positive feedback across the FSK comparator to
facilitate rapid transition between output logic states.
Design Instructions:
The circuit of Figure 10 can be tailored for any FSK decoding application by the choice of five key circuit components: R0, R1, C0, C1 and CF. For a given set of FSK mark and space frequencies, fO and f1, these parameters can be calculated as
follows:
(All resistance in W’s, all frequency in Hz and all capacitance in farads, unless otherwise specified)
a) Calculate PLL center frequency, fO:
fO+
Ǹ
F1·F2b) Choose value of timing resistor R0, to be in the range of 10KW to 100KW. This choice is arbitrary. The recommended value is R0 = 20KW. The final value of R0 is normally fine-tuned with the series potentiometer, RX.
RO+ RO)RX 2
c) Calculate value of C0 from design equation (1) or from Figure 7:
CO+ R1
0· f0
d) Calculate R1 to give the desired tracking bandwidth (See design equation 5).
R1+ R0·f0 (f1–f2)
·2
e) Calculate C1 to set loop damping. (See design equation 4):
Normally, j = 0.5 is recommended.
C1+
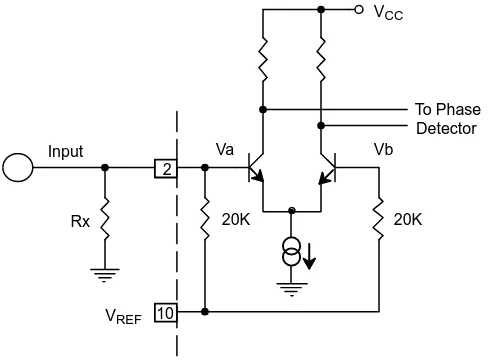
f) The input to the XR-2211 may sometimes be too sensitive to noise conditions on the input line. Figure 4 illustrates a method of de-sensitizing the XR-2211 from such noisy line conditions by the use of a resistor, Rx, connected from pin 2 to ground. The value of Rx is chosen by the equation and the desired minimum signal threshold level.
VIN minimum (peak)+ Va–Vb+DV"2.8mV offset+VREF
20, 000
(20, 000)RX) or RX+20, 000
ǒ
VREF
DV –1
Ǔ
VIN minimum (peak) input voltage must exceed this value to be detected (equivalent to adjusting V threshold)
ÎÎ
ÎÎ
ÎÎ
VCC
Rx Input
2
20K Va
20K To Phase Detector Vb
[image:39.612.164.408.229.409.2]VREF 10
Figure 4. Desensitizing Input Stage
g) Calculate Data Filter Capacitance, CF:
Rsum+
(RF)R1)·RB
(R1)RF)RB)
CF+ 0.25 (Rsum·Baud Rate)
Baud rate in 1 seconds
4 6 8 10 12 14 16 18 20 22 24 1 2 3 4 5 5 2 4 3 1 1 2 3 4 5 Curve R0 5K 10K 30K 100K 300K V+ (Volts)
fO = 1kHz
RF = 10R0
Normalized Frequency Drift (% of f )
R (K )
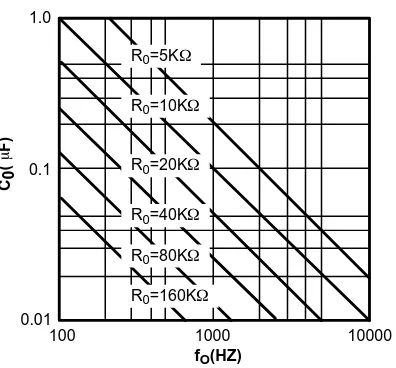
[image:40.612.53.561.57.701.2]= 1 kHz R0=5KΩ
Figure 5. Typical Supply Current vs. V+ (Logic Outputs Open Circuited)
Figure 6. VCO Frequency vs. Timing Resistor
[image:40.612.326.524.80.264.2]Figure 7. VCO Frequency vs. Timing Capacitor Figure 8. Typical fO vs. Power Supply Characteristics
Figure 9. Typical Center Frequency Drift vs. Temperature
20
15
10
5
0
R0=10KΩ
R0>100K
4 6 8 10 12 14 16 18 20 22 24
ÎÎÎÎÎÎÎÎÎÎÎ ÎÎÎÎÎÎÎÎÎÎÎ ÎÎÎÎÎÎÎÎÎÎÎ ÎÎÎÎÎÎÎÎÎÎÎ ÎÎÎÎÎÎÎÎÎÎÎ ÎÎÎÎÎÎÎÎÎÎÎ ÎÎÎÎÎÎÎÎÎÎÎ ÎÎÎÎÎÎÎÎÎÎÎ ÎÎÎÎÎÎÎÎÎÎÎ ÎÎÎÎÎÎÎÎÎÎÎ ÎÎÎÎÎÎÎÎÎÎÎ 1.0 0.1 0.01
100 1000 10000
fO(HZ)
+1.0
+0.5
0
-0.5 -1.0
-50 -25 0 25 50 75 100 125
Temperature (°C)
R0=1MΩ R0=500K R0=50K
R0=10K 1MΩ 500K
50K 10K V+ = 12V
R1 = 10 R0
fO
Supply Voltage, V+ (Volts)
R0=20KW
ÎÎÎÎÎÎÎÎÎÎÎÎ ÎÎÎÎÎÎÎÎÎÎÎÎ ÎÎÎÎÎÎÎÎÎÎÎÎ ÎÎÎÎÎÎÎÎÎÎÎÎ ÎÎÎÎÎÎÎÎÎÎÎÎ ÎÎÎÎÎÎÎÎÎÎÎÎ ÎÎÎÎÎÎÎÎÎÎÎÎ ÎÎÎÎÎÎÎÎÎÎÎÎ ÎÎÎÎÎÎÎÎÎÎÎÎ ÎÎÎÎÎÎÎÎÎÎÎÎ ÎÎÎÎÎÎÎÎÎÎÎÎ 1,000 100 10
0 1000 10000
fO(Hz)
1.02 1.01 1.00 0.99 0.98 0.97
R0=5KW
C0=0.001mF
C0=0.0033mF
C0=0.01mF
C0=0.0331mF
C0=0.1mF
C0=0.33mF
R0=160KW
R0=40KW
R0=80KW
R0=10KW
W
0
Normalized Frequency
O
Supply vs. Current (mA)
C ( F)0
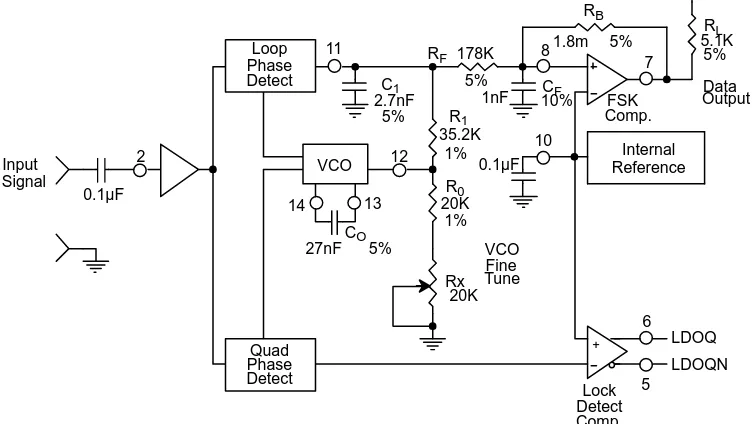
[image:40.612.320.548.338.488.2] [image:40.612.185.413.529.686.2]Design Example:
1200 Baud FSK demodulator with mark and space frequencies of 1200/2200.
Step 1: Calculate fO: from design instructions
(a) fO+Ǹ1200·2200=1624
Step 2: Calculate R0 : R0 =10K with a potentiometer of 10K. (See design instructions (b))
(b) RT+ 10)
ǒ
102
Ǔ
+15KStep 3: Calculate C0 from design instructions
(c) CO+ 1
15000·1624 +39nF
Step 4: Calculate R1 : from design instructions
(d) R1+ 20000·1624·2
(2200–1200) +51, 000
Step 5: Calculate C1 : from design instructions
(e) C1+
1250·39nF
51000·0.52 +3.9nF
Step 6: Calculate RF : RF should be at least five times R1, RF = 51,000⋅5 = 255 KW Step 7: Calculate RB : RB should be at least five times RF, RB = 255,000⋅5 = 1.2 MW
Step 8: Calculate RSUM :
RSUM+ (RF)R1)·RB
(RF)R1)RB)
+240KW
Step 9: Calculate CF :
CF+ 0.25
ǒRSUM·Baud RateǓ +1nF
VCC RL 5.1K 5% RB 1.8m 5% Loop Phase Detect 11 C1 2.7nF 5% R1
35.2K 1%
8
FSK Comp. RF 178K
5% C F 1nF 10% 7 Data Output Internal Reference 0.1µF
10 VCO 14 13 12 Rx 20K R0 20K 1% CO 27nF 5% 2
[image:42.612.83.460.98.310.2]0.1µF Input Signal Lock Detect Comp. VCO TuneFine 6 LDOQ 5 LDOQN Quad Phase Detect
Figure 10. Circuit Connection for FSK Decoding of Caller Identification Signals (Bell 202 Format)
VCC RL 5.1k RB Loop Phase Detect C 1 11 R1 RF CF 8 FSK Comp. 7 Internal Reference 0.1µF
10 VCO 14 13 12 R0 C0 Rx 2
0.1µF Input Signal Lock Detect Comp. 6 LDOQ 5 LDOQN 3 CD RD
Between 400K and 600K Quad Phase Detect
Figure 11. External Connectors for FSK Demodulation with Carrier Detect Capability
+
[image:42.612.98.480.388.646.2]Loop Phase Detect 11 C1 220pF 5% R 1 200K 1% 8 FSK Comp. VCC 7 Internal Reference 0.1µF
10 VCO 14 13 12 R0 20K 1% C0 50nF 5% Rx 5K 2
[image:43.612.84.534.77.333.2]0.1µF Input Tone Lock Detect Comp. Tune Fine 6 LDOQ RL2 5.1K RL3 5.1K Logic Output 5 LDOQN 3 CD 80nF RD 470K Quad Phase Detect
Figure 12. Circuit Connection for Tone Detection
VCC
VCO
+ +
FSK Decoding with Carrier Detect
The lock detect section of XR-2211 can be used as a carrier detect option for FSK decoding. The recommended circuit connection for this application is shown in Figure 11. The open collector lock detect output, pin 6, is shorted to data output (pin 7). Thus, data output will be disabled at “low” state, until there is a carrier within the detection band of the PLL and the pin 6 output goes “high” to enable the data output.
Note: Data Output is “Low” When No Carrier is Present.
The minimum value of the lock detect filter capacitance CD is inversely proportional to the capture range, +Dfc. This is the range of incoming frequencies over which the loop can acquire lock and is always less than the tracking range. It is further limited by C1. For most applications, Dfc
> Df/2. For RD = 470KW, the approximate minimum value of CD can be determined by:
CD§ 16Df C in mF and f in Hz.
C in mF and f in Hz.
With values of CD that are too small, chatter can be
observed on the lock detect output as an incoming signal
frequency approaches the capture bandwidth. Excessively large values of CD will slow the response time
of the lock detect output. For Caller I.D. applications choose CD = 0.1mF.
Tone Detection
Figure 12 shows the generalized circuit connection for tone detection. The logic outputs, LDOQN and LDOQ at pins 5 and 6 are normally at “high” and “low” logic states, respectively. When a tone is present within the detection band of the PLL, the logic state at these outputs become reversed for the duration of the input tone. Each logic output can sink 5mA of load current.
Both outputs at pins 5 and 6 are open collector type stages, and require external pull-up resistors RL2 and
RL3, as shown in Figure 12.
With reference to Figure 3 and Figure 12, the functions of the external circuit components can be explained as follows: R0 and C0 set VCO center frequency; R1 sets the
detection bandwidth; C1 sets the low pass-loop filter time
Design Instructions:
The circuit of Figure 12 can be optimized for any tone detection application by the choice of the 5 key circuit components: R0, R1, C0, C1 and CD. For a given input, the tone frequency, fS, these parameters are calculated as follows:
(All resistance in W’s, all frequency in Hz and all capacitance in farads, unless otherwise specified)
a) Choose value of timing resistor R0 to be in the range of 10KW to 50KW. This choice is dictated by the max./min.
current that the internal voltage reference can deliver. The recommended value is R0 = 20KW. The final value of R0
is normally fine-tuned with the series potentiometer, RX.
b) Calculate value of C0 from design equation (1) or from Figure 7 fS = fO: CO+ 1
R0·fs
c) Calculate R1 to set the bandwidth +Df (See design equation 5):
R1+ R0·f0·2
Df
Note: The total detection bandwidth covers the frequency range of fO +Df
d) Calculate value of C1 for a given loop damping factor:
Normally, j = 0.5 is recommended.
C1+ 1250·C0 R1·j2
Increasing C1 improves the out-of-band signal rejection, but increases the PLL capture time.
e) Calculate value of the filter capacitor CD . To avoid chatter at the logic output, with RD = 470KW, CD must be:
CD§ 16
Df C in mF
Increasing CD slows down the logic output response time.
Design Examples:
Tone detector with a detection band of + 100Hz:
a) Choose value of timing resistor R0 to be in the range of 10KW to 50KW. This choice is dictated by the max./min. current that the internal voltage reference can deliver. The recommended value is R0 = 20 KW. The final value of R0 is normally fine-tuned with the series potentiometer, RX.
b) Calculate value of C0 from design equation (1) or from Figure 6 fS = fO:
C0+ 1 R0·fS +
1
c) Calculate R1 to set the bandwidth +Df (See design equation 5):
R1+
R0·fO·2
Df +
20, 000·1, 000·2
100 +400K
Note: The total detection bandwidth covers the frequency range of fO +Df
d) Calculate value of C0 for a given loop damping factor: Normally, j= 0.5 is recommended.
C1+
1250·C0 R1·j2 +
1250·50·10–9
400, 000·0.52+6.25pF
Increasing C1 improves the out-of-band signal rejection, but increases the PLL capture time.
e) Calculate value of the filter capacitor CD . To avoid chatter at the logic output, with RD = 470KW, CD must be:
CD+ 16Df w20016 w80nF
Increasing CD slows down the logic output response time.
f) Fine tune center frequency with 5KW potentiometer, RX.
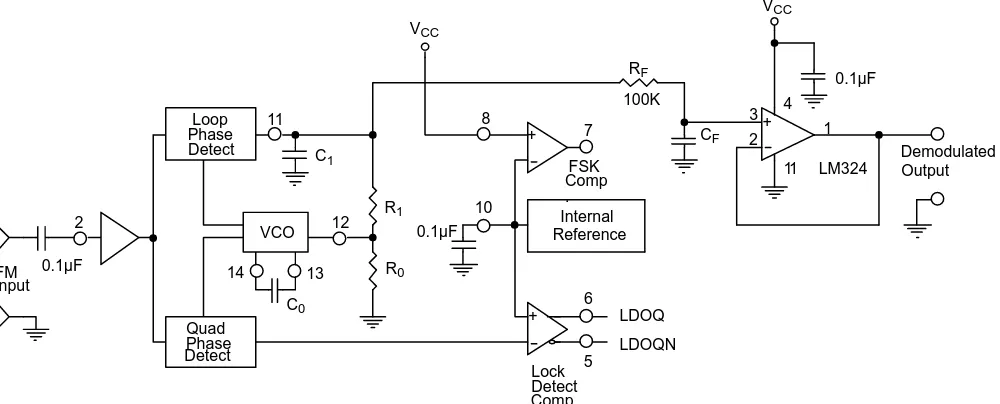
0.1µF RF 100K VCC Loop Phase Detect C 1 11 R1 8 FSK Comp . 7 3 2 1 4 11 LM324 CF Output Demodulated Internal Reference 6 LDOQ 0.1µF
10 Lock Detect Comp. VCO 14 13 12 R0 C0 2 0.1µF Input FM
Quad Phase
[image:45.612.58.558.396.598.2]Detect 5 LDOQN
Figure 13. Linear FM Detector Using XR-2211 and an External Op Amp. (See Section on Design Equation for Component Values.)
VCC
+
+
Linear FM Detection
XR-2211 can be used as a linear FM detector for a wide range of analog communications and telemetry applications. The recommended circuit connection for this application is shown in Figure 13. The demodulated output is taken from the loop phase detector output (pin 11), through a post-detection filter made up of RF and CF,
and an external buffer amplifier. This buffer amplifier is necessary because of the high impedance output at pin 11. Normally, a non-inverting unity gain op amp can be used as a buffer amplifier, as shown in Figure 13.
The FM detector gain, i.e., the output voltage change per unit of FM deviation can be given as:
VOUT+ R1·VREF
100·R0
where VR is the internal reference voltage (VREF = VCC /2
- 650mV). For the choice of external components R1, R0,
CD, C1 and CF, see the section on design equations.
[image:46.612.63.569.289.652.2]Capacitor 6 Input 5 7 Resistor V+
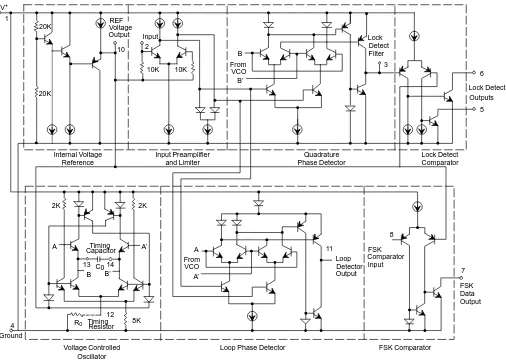
Figure 14. Equivalent Schematic Diagram 20K 20K Internal Voltage Reference Input Preamplifier and Limiter 10K 10K Quadrature Phase Detector Lock Detect Filter Lock Detect Outputs Lock Detect Comparator FSK Data Output FSK Comparator Input Loop Detector Output A From VCO 2K A’
Loop Phase Detector 8K
12 R0
Timing
13 B C0 14B’
A 0.100 0.200 2.54 5.08 A1 0.015 0.060 0.38 1.52 B 0.014 0.026 0.36 0.66 B1 0.045 0.065 1.14 1.65 c 0.008 0.018 0.20 0.46 D 0.685 0.785 17.40 19.94 E1 0.250 0.310 6.35 7.87
E 0.300 BSC 7.62 BSC e 0.100 BSC 2.54 BSC L 0.125 0.200 3.18 5.08
α 0° 15° 0° 15°
L
D
B e
B1
14 LEAD CERAMIC DUAL-IN-LINE
(300 MIL CDIP)
Rev. 1.00
SYMBOL MIN MAX MIN MAX
INCHES MILLIMETERS
A1
α
c Seating
Plane Base
Plane A
14
1 7
8
E1 E
14 LEAD PLASTIC DUAL-IN-LINE
(300 MIL PDIP)
Rev. 1.00
14 1
8 7
D
e B1
A1 E1
E
A L
B Seating
Plane
SYMBOL MIN MAX MIN MAX
INCHES
A 0.145 0.210 3.68 5.33 A1 0.015 0.070 0.38 1.78
A2 0.115 0.195 2.92 4.95
B 0.014 0.024 0.36 0.56 B1 0.030 0.070 0.76 1.78
C 0.008 0.014 0.20 0.38 D 0.725 0.795 18.42 20.19 E 0.300 0.325 7.62 8.26 E1 0.240 0.280 6.10 7.11 e 0.100 BSC 2.54 BSC eA 0.300 BSC 7.62 BSC
eB 0.310 0.430 7.87 10.92
L 0.115 0.160 2.92 4.06
α 0° 15° 0° 15°
MILLIMETERS
α
A2
C
Note: The control dimension is the inch column
SYMBOL MIN MAX MIN MAX
A 0.053 0.069 1.35 1.75 A1 0.004 0.010 0.10 0.25
B 0.013 0.020 0.33 0.51 C 0.007 0.010 0.19 0.25 D 0.337 0.344 8.55 8.75 E 0.150 0.157 3.80 4.00 e 0.050 BSC 1.27 BSC H 0.228 0.244 5.80 6.20 L 0.016 0.050 0.40 1.27
α 0° 8° 0° 8°
INCHES MILLIMETERS
14 LEAD SMALL OUTLINE
(150 MIL JEDEC SOIC)
Rev. 1.00
e
14 8
7
D
E H
B
A
L C
A1 Seating
Plane α
Note: The control dimension is the millimeter column
NOTICE
EXAR Corporation reserves the right to make changes to the products contained in this publication in order to im-prove design, performance or reliability. EXAR Corporation assumes no responsibility for the use of any circuits de-scribed herein, conveys no license under any patent or other right, and makes no representation that the circuits are free of patent infringement. Charts and schedules contained here in are only for illustration purposes and may vary depending upon a user’s specific application. While the information in this publication has been carefully checked; no responsibility, however, is assumed for inaccuracies.
EXAR Corporation does not recommend the use of any of its products in life support applications where the failure or malfunction of the product can reasonably be expected to cause failure of the life support system or to significantly affect its safety or effectiveness. Products are not authorized for use in such applications unless EXAR Corporation receives, in writing, assurances to its satisfaction that: (a) the risk of injury or damage has been minimized; (b) the user assumes all such risks; (c) potential liability of EXAR Corporation is adequately protected under the circum-stances.
Copyright 1995 EXAR Corporation Datasheet June 1997
LM555
Timer
General Description
The LM555 is a highly stable device for generating accurate time delays or oscillation. Additional terminals are provided for triggering or resetting if desired. In the time delay mode of operation, the time is precisely controlled by one external re-sistor and capacitor. For astable operation as an oscillator, the free running frequency and duty cycle are accurately controlled with two external resistors and one capacitor. The circuit may be triggered and reset on falling waveforms, and the output circuit can source or sink up to 200mA or drive TTL circuits.
Features
n Direct replacement for SE555/NE555
n Timing from microseconds through hours
n Operates in both astable and monostable modes
n Adjustable duty cycle
n Output can source or sink 200 mA
n Output and supply TTL compatible
n Temperature stability better than 0.005% per ˚C
n Normally on and normally off output
n Available in 8-pin MSOP package
Applications
n Precision timing
n Pulse generation
n Sequential timing
n Time delay generation
n Pulse width modulation
n Pulse position modulation
n Linear ramp generator
Schematic Diagram
DS007851-1
T
Ordering Information
Package Part Number Package Marking Media Transport NSC Drawing
8-Pin SOIC LM555CM LM555CM Rails
M08A
LM555CMX LM555CM 2.5k Units Tape and Reel
8-Pin MSOP LM555CMM Z55 1k Units Tape and Reel
MUA08A
LM555CMMX Z55 3.5k Units Tape and Reel
8-Pin MDIP LM555CN LM555CN Rails N08E
and Molded Mini Small Outline Packages
DS007851-3
If Military/Aerospace specified devices are required, please contact the National Semiconductor Sales Office/ Distributors for availability and specifications.
Supply Voltage +18V
Power Dissipation (Note 3)
LM555CM, LM555CN 1180 mW
LM555CMM 613 mW
Operating Temperature Ranges
LM555C 0˚C to +70˚C
Storage Temperature Range −65˚C to +150˚C
Dual-In-Line Package
Soldering (10 Seconds) 260˚C
Small Outline Packages (SOIC and MSOP)
Vapor Phase (60 Seconds) 215˚C
Infrared (15 Seconds) 220˚C
See AN-450 “Surface Mounting Methods and Their Effect on Product Reliability” for other methods of soldering surface mount devices.
Electrical Characteristics
(Notes 1, 2)(TA= 25˚C, VCC= +5V to +15V, unless othewise specified)
Parameter Conditions Limits Units
LM555C
Min Typ Max
Supply Voltage 4.5 16 V
Supply Current VCC= 5V, RL=∞
VCC= 15V, RL=∞
(Low State) (Note 4)
3 10
6
15 mA
Timing Error, Monostable
Initial Accuracy 1 %
Drift with Temperature RA= 1k to 100kΩ, 50 ppm/˚C
C = 0.1µF, (Note 5)
Accuracy over Temperature 1.5 %
Drift with Supply 0.1 %/V
Timing Error, Astable
Initial Accuracy 2.25 %
Drift with Temperature RA, RB= 1k to 100kΩ, 150 ppm/˚C
C = 0.1µF, (Note 5)
Accuracy over Temperature 3.0 %
Drift with Supply 0.30 %/V
Threshold Voltage 0.667 x VCC
Trigger Voltage VCC= 15V 5 V
VCC= 5V 1.67 V
Trigger Current 0.5 0.9 µA
Reset Voltage 0.4 0.5 1 V
Reset Current 0.1 0.4 mA
Threshold Current (Note 6) 0.1 0.25 µA
Control Voltage Level VCC= 15V
VCC= 5V
9 2.6 10 3.33 11 4 V
Pin 7 Leakage Output High 1 100 nA
Pin 7 Sat (Note 7)
Output Low VCC= 15V, I7= 15mA 180 mV
Parameter Conditions Limits Units LM555C
Min Typ Max
Output Voltage Drop (Low) VCC= 15V
ISINK= 10mA 0.1 0.25 V
ISINK= 50mA 0.4 0.75 V
ISINK= 100mA 2 2.5 V
ISINK= 200mA 2.5 V
VCC= 5V
ISINK= 8mA V
ISINK= 5mA 0.25 0.35 V
Output Voltage Drop (High) ISOURCE= 200mA, VCC= 15V 12.5 V
ISOURCE= 100mA, VCC= 15V 12.75 13.3 V
VCC= 5V 2.75 3.3 V
Rise Time of Output 100 ns
Fall Time of Output 100 ns
Note 1: All voltages are measured with respect to the ground pin, unless otherwise specified.
Note 2: Absolute Maximum Ratings indicate limits beyond which damage to the device may occur. Operating Ratings indicate conditions for which the device is
func-tional, but do not guarantee specific performance limits. Electrical Characteristics state DC and AC electrical specifications under particular test conditions which guar-antee specific performance limits. This assumes that the device is within the Operating Ratings. Specifications are not guarguar-anteed for parameters where no limit is given, however, the typical value is a good indication of device performance.
Note 3: For operating at elevated temperatures the device must be derated above 25˚C based on a +150˚C maximum junction temperature and a thermal resistance
of 106˚C/W (DIP), 170˚C/W (S0-8), and 204˚C/W (MSOP) junction to ambient.
Note 4: Supply current when output high typically 1 mA less at VCC= 5V.
Note 5: Tested at VCC= 5V and VCC= 15V.
Note 6: This will determine the maximum value of RA+ RBfor 15V operation. The maximum total (RA+ RB) is 20MΩ.
Minimuim Pulse Width Required for Triggering
DS007851-4
Supply Current vs. Supply Voltage
DS007851-19
High Output Voltage vs. Output Source Current
DS007851-20
Low Output Voltage vs. Output Sink Current
DS007851-21
Low Output Voltage vs. Output Sink Current
DS007851-22
Low Output Voltage vs. Output Sink Current
Voltage Level of Trigger Pulse
DS007851-24
Output Propagation Delay vs. Voltage Level of Trigger Pulse
DS007851-25
Discharge Transistor (Pin 7) Voltage vs. Sink Current
DS007851-26
Discharge Transistor (Pin 7) Voltage vs. Sink Current
MONOSTABLE OPERATION
In this mode of operation, the timer functions as a one-shot (Figure 1). The external capacitor is initially held discharged by a transistor inside the timer. Upon application of a
nega-tive trigger pulse of less than 1/3 VCCto pin 2, the flip-flop is
set which both releases the short circuit across the capacitor and drives the output high.
The voltage across the capacitor then increases
exponen-tially for a period of t = 1.1 RAC, at the end of which time the
voltage equals 2/3 VCC. The comparator then resets the
flip-flop which in turn discharges the capacitor and drives the
output to its low state.Figure 2 shows the waveforms
gener-ated in this mode of operation. Since the charge and the threshold level of the comparator are both directly propor-tional to supply voltage, the timing internal is independent of supply.
During the timing cycle when the output is high, the further application of a trigger pulse will not effect the circuit so long as the trigger input is returned high at least 10µs before the end of the timing interval. However the circuit can be reset during this time by the application of a negative pulse to the reset terminal (pin 4). The output will then remain in the low state until a trigger pulse is again applied.
When the reset function is not in use, it is recommended that
it be connected to VCCto avoid any possibility of false
trig-gering.
NOTE: In monostable operation, the trigger should be driven high before the end of timing cycle.
ASTABLE OPERATION
If the circuit is connected as shown inFigure 4 (pins 2 and 6
connected) it will trigger itself and free run as a multivibrator.
The external capacitor charges through RA+ RBand
dis-charges through RB. Thus the duty cycle may be precisely
set by the ratio of these two resistors.
In this mode of operation, the capacitor charges and
dis-charges between 1/3 VCCand 2/3 VCC. As in the triggered
mode, the charge and discharge times, and therefore the fre-quency are independent of the supply voltage.
[image:59.612.335.521.91.255.2]DS007851-5
FIGURE 1. Monostable
DS007851-6
VCC= 5V Top Trace: Input 5V/Div.
TIME = 0.1 ms/DIV. Middle Trace: Output 5V/Div. RA= 9.1kΩ Bottom Trace: Capacitor Voltage 2V/Div.
[image:59.612.53.270.145.314.2]C = 0.01µF
FIGURE 2. Monostable Waveforms
DS007851-7
FIGURE 3. Time Delay
[image:59.612.318.524.327.520.2]DS007851-8
[image:59.612.44.234.425.575.2]The charge time (output high) is given by:
t1= 0.693 (RA+ RB) C
And the discharge time (output low) by:
t2= 0.693 (RB) C
Thus the total period is:
T = t1+ t2= 0.693 (RA+2RB) C
The frequency of oscillation is:
Figure 6 may be used for quick determination of these RC values.
The duty cycle is:
FREQUENCY DIVIDER
The monostable circuit ofFigure 1 can be used as a fre-quency divider by adjusting the length of the timing cycle. Figure 7 shows the waveforms generated in a divide by three circuit.
PULSE WIDTH MODULATOR
When the timer is connected in the monostable mode and triggered with a continuous pulse train, the output pulse width can be modulated by a signal applied to pin 5.Figure 8 shows the circuit, and in Figure 9 are some waveform examples.
DS007851-9
VCC= 5V Top Trace: Output 5V/Div.
TIME = 20µs/DIV. Bottom Trace: Capacitor Voltage 1V/Div. RA= 3.9kΩ
RB= 3kΩ
C = 0.01µF
FIGURE 5. Astable Waveforms
[image:60.612.69.561.43.743.2]DS007851-10
FIGURE 6. Free Running Frequency
DS007851-11
VCC= 5V Top Trace: Input 4V/Div.
TIME = 20µs/DIV. Middle Trace: Output 2V/Div. RA= 9.1kΩ Bottom Trace: Capacitor 2V/Div.
C = 0.01µF
FIGURE 7. Frequency Divider
[image:60.612.343.521.54.207.2]DS007851-12
FIGURE 8. Pulse Width Modulator
DS007851-13
VCC= 5V Top Trace: Modulation 1V/Div.
TIME = 0.2 ms/DIV. Bottom Trace: Output Voltage 2V/Div. RA= 9.1kΩ
C = 0.01µF
[image:60.612.364.546.310.445.2] [image:60.612.80.273.439.627.2]PULSE POSITION MODULATOR
This application uses the timer connected for astable
opera-tion, as inFigure 10, with a modulating signal again applied
to the control voltage terminal. The pulse position varies with the modulating signal, since the threshold voltage and hence
the time delay is varied. Figure 11 shows the waveforms
generated for a triangle wave modulation signal.
LINEAR RAMP
When the pullup resistor, RA, in the monostable circuit is
re-placed by a constant current source, a linear ramp is
gener-ated.Figure 12 shows a circuit configuration that will perform
[image:61.612.45.532.41.748.2] [image:61.612.301.542.50.221.2]this function.
Figure 13 shows waveforms generated by the linear ramp. The time interval is given by:
[image:61.612.43.249.132.525.2]VBE≅0.6V DS007851-14
FIGURE 10. Pulse Position Modulator
DS007851-15
VCC= 5V Top Trace: Modulation Input 1V/Div.
TIME = 0.1 ms/DIV. Bottom Trace: Output 2V/Div. RA= 3.9kΩ
RB= 3kΩ
C = 0.01µF
FIGURE 11. Pulse Position Modulator
DS007851-16
FIGURE 12.
DS007851-17
VCC= 5V Top Trace: Input 3V/Div.
TIME = 20µs/DIV. Middle Trace: Output 5V/Div. R1= 47kΩ Bottom Trace: Capacitor Voltage 1V/Div.
R2= 100kΩ
RE= 2.7 kΩ
C = 0.01 µF
[image:61.612.68.254.149.299.2]For a 50% duty cycle, the resistors RAand RBmay be
con-nected as inFigure 14. The time period for the output high is
the same as previous, t1= 0.693 RAC. For the output low it
is t2 =
Thus the frequency of oscillation is
Note that this circuit will not oscillate if RBis greater than 1/2
RAbecause the junction of RAand RBcannot bring pin 2
down to 1/3 VCCand trigger the lower comparator.
ADDITIONAL INFORMATION
Adequate power supply bypassing is necessary to protect associated circuitry. Minimum recommended is 0.1µF in par-allel with 1µF electrolytic.
Lower comparator storage time can be as long as 10µs when pin 2 is driven fully to ground for triggering. This limits the monostable pulse width to 10µs minimum.
Delay time reset to output is 0.47µs typical. Minimum reset pulse width must be 0.3µs, typical.
Pin 7 current switches within 30ns of the output (pin 3) volt-age.
[image:62.612.346.566.51.225.2]DS007851-18
LIFE SUPPORT POLICY
NATIONAL’S PRODUCTS ARE NOT AUTHORIZED FOR USE AS CRITICAL COMPONENTS IN LIFE SUPPORT DEVICES OR SYSTEMS WITHOUT THE EXPRESS WRITTEN APPROVAL OF THE PRESIDENT AND GENERAL COUNSEL OF NATIONAL SEMICONDUCTOR CORPORATION. As used herein:
1. Life support devices or systems are devices or systems which, (a) are intended for surgical implant into the body, or (b) support or sustain life, and whose failure to perform when properly used in accordance with instructions for use provided in the labeling, can be reasonably expected to result in a significant injury to the user.
2. A critical component is any component of a life support device or system whose failure to perform can be reasonably expected to cause the failure of the life support device or system, or to affect its safety or effectiveness.
National Semiconductor Corporation
Americas Tel: 1-800-272-9959 Fax: 1-800-737-7018
National Semiconductor Europe
Fax: +49 (0) 180-530 85 86 Email: [email protected] Deutsch Tel: +49 (0) 69 9508 6208
National Semiconductor Asia Pacific Customer Response Group
Tel: 65-2544466 Fax: 65-2504466
National Semiconductor Japan Ltd.
Tel: 81-3-5639-7560 Fax: 81-3-5639-7507
Molded Dual-In-Line Package (N) NS Package Number N08E
PENDAHULUAN
Bab ini membahas mengenai latar belakang, identifikasi masalah, tujuan,
pembatasan masalah, spesifikasi alat dan sistematika pembahasan tugas akhir.
I.1
Latar Belakang
PLC dapat diterapkan dengan beberapa teknik komunikasi diantaranya:
CSMA (
Carrier Sense Multiple Access
), X10, FSK (
Frequency Shift Keying),
QAM (
Quadrature Amplitude Modulation
), FM (
Frequency Modulation
), DSSS
(
Direct Sequence Spread Spectrum
) dan lainlain
Ada dua aplikasi utama PLC, untuk komunikasi data, dan untuk sinyal
kendali. PLC yang digunakan untuk komunikasi data umumnya memiliki
bandwidth
yang lebih tinggi (>10Kbps) daripada PLC yang digunakan untuk
keperluan kendali (<10Kbps). Komunikasi data yang dapat diaplikasikan
menggunakan PLC antara lain LAN, Internet melalui kabel listrik, dan lain lain.
PLC dapat diterapkan pada jaringan listrik DC dan AC. Aplikasi
PLC pada jaringan listrik AC antara lain internet via kabel listrik, LAN via kabel
listrik, interkom via kabel listrik, dan lain lain. PLC pada jaringan DC umumnya
digunakan untuk keperluan kendali, tetapi tidak tertutup kemungkinannya untuk
diaplikasikan untuk keperluan komunikasi seperti internet, interkom, LAN, dan
lain lain.
PLC pada jalur listrik DC dapat digunakan sebagai jalur komunikasi pada
aplikasi
smart car
. Teknologi
smart car
memerlukan jalur komunikasi antara
I.2
Perumusan Masalah
1. Bagaimana merancang dan membuat sistem PLC untuk jaringan listrik DC
?
2. Bagaimana mengimplementasikan sistem PLC agar dapat digunakan sebagai
sistem kendali?
I.3
Tujuan
1. Merancang dan membuat sistem PLC untuk jaringan listrik DC
2. Mengimplementasikan sistem PLC agar dapat digunakan sebagai sistem
kendali
I.4
Pembatasan Masalah
1. Prototipe yang dibuat hanya terdiri atas satu
master
dan dua
slave
2. Kontroler menggunakan mikrokontroler MCS51
3. Jumlah output diskrit maksimum yang dapat dikendalikan sebanyak 64
I.5
Alat yang digunakan
1. Menggunakan mikrokontroler MCS51 sebagai kontroler
2. Menggunakan rangkaian LC untuk
high pass filter
dan
Band pass filter
3. Menggunakan IC
demodulator
FSK Exar XR2211
4. Menggunakan IC 555 sebagai modulator FSK
I.6
Sistematika Pembahasan
Sistematika pembahasan laporan tugas akhir ini disusun menjadi lima bab,
yaitu sebagai berikut :
Bab I : Pendahuluan
Bab II : Teori Penunjang
Bab ini membahas tentang landasan teori yang digunakan dalam
pembuatan sistem PLC yang menggunakan UART sebagai
data link layer,
dan FSK sebagai
physical layer
. Landasan teori yang dibahas pada bab ini
terdiri atas: protokol UART
(
Universal Asynchronous Receive/Transmit
),
teknik modulasi FSK (
Frequency Shift Keying
),
modulator
FSK,
demodulator
FSK, LPF (
Low Pass Filter
), BPF (
Band Pass Filter
) dan
rangkaian dasar mikrokontroler dan prinsip kerja rele.
Bab III : Perancangan dan Realisasi
Bab ini membahas perancangan sistem PLC, yaitu merancang dan
membuat LPF (
Low Pass Filter
), BPF (
Band Pass Filter
),
modulator
FSK
,
demodulator FSK, serta
rangkaian dan program mikrokontroler).
Bab IV : Uji Coba Alat
Bab ini membahas tentang pengujian LPF (
Low Passs Filter
), BPF (
Band
Pass Filter
),
modulator FSK, demodulator FSK,
rangkaian dan program pada
slave
dan
master controller
, serta rangkaian secara keseluruhan.
Bab V : Kesimpulan dan Saran
1. Sistem PLC untuk jaringan listrik DC sudah berhasil dibuat dan
diimplementasikan sebagai sistem kendali
on off
lampu LED.
2. Sistem PLC yang telah diimplementasikan pada Tugas Akhir ini dapat bekerja
dengan baik dengan ketahanan terhadap noise sebesar 200 mVpp.
1. Flold, “Electronic Device”, 5
thEdition, Prentice Hall, 1999.
2. MillmanHalkias, “Integrated Electronics”, McGraw Hill, 1985.
3. Roddy, Dennis, “Electronic Communication”, Prentice Hall, 1984.
4. Suhata, ”VB Sebagai Pusat Kendali Peralatan Elektronik”, Elex Media