87
Biplot Simulation of Exponential Function to
Determine Body Dimensions’ Growth Rate of
Bali Calf
Putu Sampurna, Ketut Saka, Lanang Oka, Sentana Putra
Abstract - Biplot simulation of exponential function was performed to determine body dimensions’growth rate of bali calf using biplot analysis with Promax rotation (90). Biplot graphic demonstration showed that exponential functions with slow growth occurred in quadrant II, with medium growth occurred in quadrant I, and with fast growth occurred in quadrant IV. Biplot demonstration of the body dimensions in male and female Bali calves showed 3 pieces of quadrants i.e. quadrant I, quadrant II and quadrant IV of two-dimensional eigenspace. Based on the result, it can be determined that the body dimensions Bali calves were as follows; in quadrant II was at a slow growth rate, in quadrant I was at a medium growth rate, and in quadrant IV was at a rapid growth rate
Keywords- Simulation. exponential function, biplot, eigen vector, quadrant, Bali calves, body dimensions and the growth rate
I. INTRODUCTION
The growth of the animal's body dimensions during their rapid growth usually follows an exponential function with growth rate varies between one to another body dimension. The differences in growth rate are due to differences in physiology, functional demands and the components of bodies. The dimensions of the animal's body that functions early, will grow earlier than its growth rate and is therefore greater than the dimensions of the animal's body that function later. For instance, the dimensions of the body composed mainly of bones will develop earlier than those composed of muscle or fat (Swatlan, 1984) , Sampurna and Suata, 2008).
Growth of organs, tissues and other parts of animals’ bodies at the time of their rapid growth usually follows exponential function with growth rates vary from one to another body dimensions.
Differences in growth rate is caused by the differences in the functional demands of different organs, tissues, or body parts of animals and those which grow up first will then have the growth rate greater than the organ, tissue, or body parts of animals that grow up later.
The differences in the growth rates among various animal's body dimensions from birth until a certain age can be determined using the regression line equation Y= a ekx , where Y is the value of the animal's body dimensions, a is the size at birth, k is the growth rate, X is the age of the animals and e is the natural logarithm 2.71828 ... Based on
the regression line equation, the value of k varies among various body dimensions
In many studies, however, researchers are often faced with too many body dimensions, so the presentation in the form of an exponential function is less attractive, or can not be presented in one image simultaneously. Therefore, the presentation of growth rate differences among various body dimensions will be demonstrated using a cross axis eigenvectors in two-dimensional space
In the multipariate analysis of multiple variables, the eigen value structure of data matrix is crucially important. Eigen structure is expressed in the root of eigen values and eigen vectors. Euklidian associated with an equation: Where is a scalar and X is a non-zero vector scalar called Eigen values of the matrix A. Eigen values are the characteristic values of a square matrix.
AϵRnxn matrix is symmetrical, if the AʹA, and is orthogonal matrix AϵRnxn if AAʹ = AʹA = I. It is clear that A is nonsingular with A-1 = Aʹ
AϵRnxn matrix, A =(aij) is a diagonal matrix if aij= 0, i ≠ j. A diagonal matrix can also be written as A = diag (a1, a2,…….., an ), with a1, a2,…….., an are the elements of the main diagonal.
A symmetrical matrix can be decomposed into A = VDVʹ, with V as an orthogonal matrix and then the distance between vectors u and v are:
Biplot is an exploratory analysis of multiple variable data that can be illustrated in a graphic picture of the closeness among observed objects,
the diversity of variables, the correlation among the variables, and the relationship between the variables and the object. In addition, biplot analysis
is used to describe the relationship between variables and objects that are at a high-dimensional
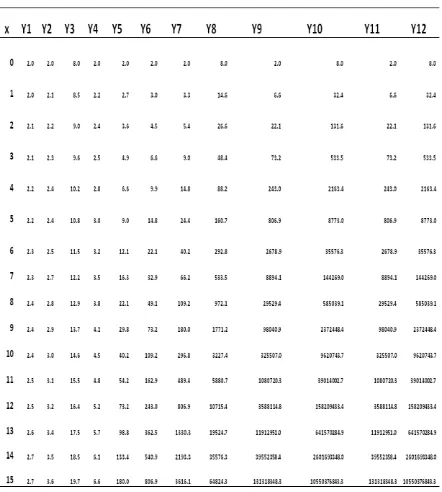
88 Table 1: Data from Exponential Function
Three approaches of matrix associated with the data, variables, and objects, can be obtained from biplot. Size suitability of the three matrices was presented by Gabriel in 2002.
In the interpretation of the relevant factors, the first selection step is generally followed by a rotation of maintained factor which serves to make the output more understandable. The rotation can be orthogonal or oblique rotation (which allows correlated factors), Promax rotation is an alternative non-orthogonal (oblique) rotation method which can compute faster than direct oblimin method and it is, therefore sometimes used to compute a very large dataset. In practice rotation of factor analysis, it is therefore advisable to try several sizes to subspaces of retained factors to assess the robustness of interpretation rotation (Abdi, 2003).
Information which can be obtained from the biplot in two-dimensional space of the exponential function is to describe the close relationship on the basis of its rates. Two exponential functions with almost the same rate are described as two adjacent point position, whereas those with a great different rate are described as a two distant point position. This information will then be used to determine the differences in the growth rates of Bali cattle body dimensions, whether the growth of a particular body dimension is slow, medium or fas
II. METHODS
Data were generated from the 12 pieces of the exponential functions of Yi= a ekx, at many different rates (k) and the values, but with the same X of 0, 1, 2, 3. 4. 5. 6. 7, 8, 9, 10, 11, 12, 13, 14,
Data were analyzed by factor analysis based on the correlation between variables, in order to obtain the correlation matrix and their significant differences. Eigen vectors are determined by the relationship Rxo =
xo, so that f(x) = │R -
I│ = 0. So f(
) = 0 is called R matrix eigen value equation, the roots of this equation is called the root of the matrix R eigen values, and root vectors compatible with eigen values is called eigenvectors.Prior to analysis, the data obtained from the exponential function were divided by their average, so that all data on each exponential function have different rates, all averages are 1.0, and differ only in their standard deviation.
Demonstration biplot graphs drown from two eigenvectors corresponding to the largest eigen value roots as X-axis and the second largest eigen roots as Y-axis , with Promax Rotation (90).
The coordinate position of each exponential function on X and Y determines the close relationship between the exponential functions. Exponential functions with almost the same rates will be at close position, whereas those with difference rate will be at a distant position. Promax Rotation (90) is used to divide the location of the exponential function in the cross-axis two-dimensional eigenspace (biplot) into 3 points (quadrant). Exponential functions located in quadrant II is an exponential function of slow rate, those in quadrant I is an exponential function of the medium rate, and those quadrant IV is an exponential function of fast rates.
89 eigenspace, and Scree Plot (Figure 1) shows that a sharp decline in values was observed on the root of eigen values at their first and second principal components. The use of two main components are therefore considered to be able to explain the diversity of the exponential function data with many different rates.
Table 2: Total Variance Explained Exponential Function
Figure 1: Sree Plot Exponential Function at a Different Rate
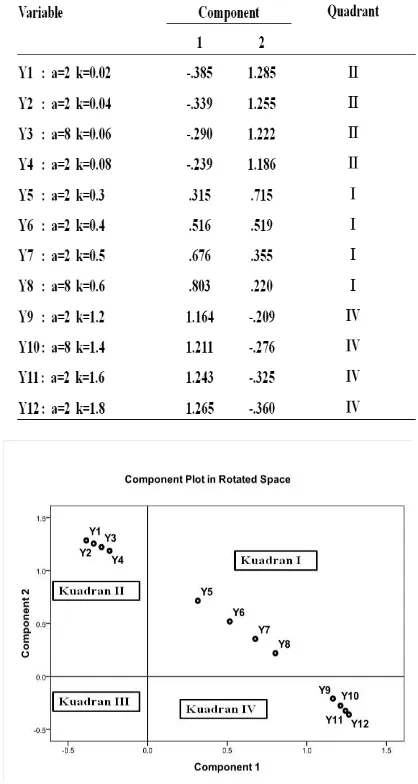
Table 3 and Figure 2, shows that the exponential function with a rate (k = 0:02 to 0:08) has a negative abscissa and a positive ordinate which fall into quadrant II, an exponential function classified as slow pace. Functions that have exponential rate (k = 0.3 to 0.6 has a positive abscissa and a positive ordinate which fall into quadrant I, an exponential function classified as medium pace. Functions that have exponential rate (k = 1.2 to1.8) has a positive abscissa and negative ordinate which fall into quadrant IV, the exponential function classified into a fast rate.
Table 3: Pattern Matrix Exponential Function
Figure 2: Eigen Vectors Exponential Function at a Different Rate
90 Table 4: Total Variance Explained Body Dimension Calf
Bali Males
Figure 3: Sree Plot Body Dimension Calf Bali Males
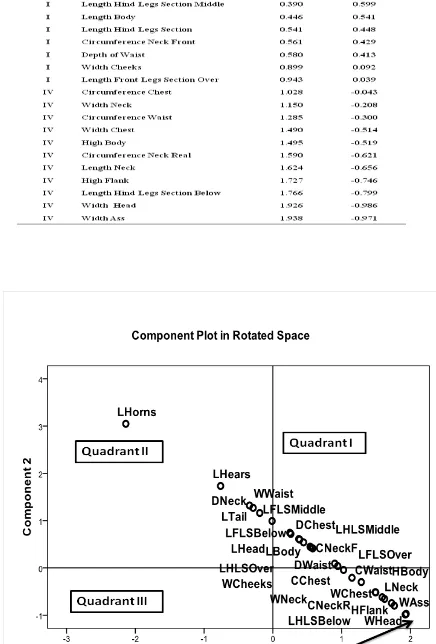
It appears from Table 5. and Figure 4 that the body dimensions of slow growth rates was in quadrant II, consisting of the length of horns and ear, and the depth of the chest respectively from the slowest and the fastest growth on this quadrant. The body dimensions with medium growth rate which was in quadrant I consisting of the width neck, the length of the body and the last is the length of the neck respectively from the slowest to the fastest on this quadrant. The body dimensions with fast growth rate which was in quadrant IV, consisted of high flank, the middle front legs and lower front legs respectively from the s the fastest and the slowest growth rates in this quadrant
Table 5: Pattern Matrix Body Dimension Calf Bali Males
Figure 4: Eigen Vectors Body Dimension Calf Bali Males
91 Table 6: Total Variance Explained Body Dimension Calf
Bali Females
Figure 5: Sree Plot Body Dimension Calf Bali Females
It appears from Table 7. and Figure 6. that the body dimensions of slow growth rate was in quadrant II consisting of the length of horns, the length of ear, and the length of middle front legs respectively from the slowest to the fastest growth in this quadrant. The body dimensions of medium growth rate were in quadrant I consisting of the length of head, the length lower front legs, and the length upper front legs respectively from the slowest to the fastest. The body dimensions with fast growth rate was in quadrant IV, consisting of width of ass, the width of the head, and circumference of the chest respectively from the fastest to the slowest.
Table 7: Pattern Matrix Body Dimension Calf Bali Females
Figure 6: Eigen Vectors Body Dimension Calf Bali Females
The simulation of biplot exponential functions showed that exponential functions which have a slow rate (k = 0:02 to 0:08), was in quadrant II, those which have medium rate (k = 0.3 to 0.6) was in quadrant I, and those which have fast rate rapid (k = 1.2 to1.8) was in quadrant IV. Biplot analysis on body dimensions of male and female bali calves, also located in quadrant II, quadrant I and quadrant IV. Based on the simulation of biplot exponential function, it can be concluded that body dimensions of bali calf barrel-chested in quadrant II were those with slow growth rate, barrel-chested in quadrant I were those with medium growth rate, ande barrel-chested in quadrant IV were those with a fast growth rate.
ACKNOWLEDGEMENTS
92 Getasan village headman, subdistrict Petang, Badung regency, Bali Propensi the facilities and services provided
REFERENCES
1) Abdi, H (2003) Factor Rotations in Factor Analyses. Program in Cognitionand Neurosciences, MS: Gr.4.1, The University of Texas at Dallas, Richardson, TX 75083– 0688, USA
yttp://www.utdallas.edu/~herve/Abdi-rotations-pretty.pdf
2) Aldrich, John (2006), "Eigenvalue, eigenfunction, eigenvector, and related terms", in Jeff Miller (Editor), Earliest Known Uses of Some of the Words of Mathematics, retrieved 2006-08-22
3) Aldrich, John (2006), "Eigenvalue, eigenfunction, eigenvector, and related terms", in Jeff Miller (Editor), Earliest Known Uses of Some of the Words of Mathematics, retrieved 2006-08-22
4) Maharani, Holy, D and Suyoto. , 2009. Value and Eigen vector matrix algebra Iinterval the Max-Pus.Journal of Mathematics and Computer. ISSN 1410-8518
5) Sampurna, I P. Of 1999. Allometric rowth of body parts of Bali Ducks. Journal iological Studies, Department of Biology. Database Journal ISJD-LIPI ndonesia
6) Sampurna, P and Suata. K.2008. Alometri Growth Dimensions Length and
Circumference Bali male cattle. Veterinary Journal 9: \ 1, March. 2008, ISSN: 1411-8327, Accreditation No. of Higher Education. 55/DIKTI/Kep/2005. Page: 41-44
7) Swatland HJ. 1984. Structure and Development of Meat Animals. Prentice-HallInc., Englewood Cliff, New Jersey 8) Shores, Thomas S. (2007), Applied linear
algebra and matrix analysis, Springer Science+Business Media, LLC, ISBN 0-387-33194-8
9) Stephen Andrilli and David Hecker 2009. Elementary Linear Algebra. Fourth Edition ISBN : 978-0-12-374751-8.
http://books.google.co.id/books
10) Roman, Steven (2008), Advanced linear algebra (3rd ed.), New York, NY: Springer Science + Business Media, LLC, ISBN978-0-387-72828-5
BIOGRAPHIES
Putu Sampurna got
Engineering degree in Faculty Husbandry, University of Udayana 1983, Bridging Programe Mathematics ITB 1988, Master of Science in Applied Statistics IPB 1992, Students doctoral program Animal Husbandry at the university Udayana. He is a lecturer at the Laboratory of Biostatistics, Faculty of Veterinary Medicine, Udayana University.
Ketut Saka, lecturer Doctoral Program of Animal Husbandry, University of Udayana, as a promoter of my dissertation .
Gst. Oka lecturer Doctoral Program of Animal Husbandry, University of Udayana, as a kopromoter of my dissertation