Volume 4, Issue 8(1), August 2015
I
n t er n at io nal
J
o ur nal o f
M
ul t idis cipl in ar y
E
ducat io nal
R
es ear ch
Published by
SucharithaPublications
8-21-4,Saraswathi Nivas,Chinna Waltair Visakhapatnam – 530 017
Andhra Pradesh – India
Editorial Board
Editor-in-Chief
Dr.K. Victor Babu
Faculty, Department of Philosophy
Andhra University – Visakhapatnam - 530 003 Andhra Pradesh – India
Institute of Constitutional and Parliamentary Studies, New Delhi &
Formerly Vice Chancellor of
Benaras Hindu University, Andhra University Nagarjuna University, Patna University Ex. Member of the Austrian Parliament Austria
The Member of The Russian Philosophical Society
The Russian Humanist Society and Expert of The UNESCO, Moscow, Russia
Dr. Zoran Vujisiæ
Rector
St. Gregory Nazianzen Orthodox Institute Universidad Rural de Guatemala, GT, U.S.A
Sri. Venkateswara College, Delhi University, Delhi
I Ketut Donder
N.Suryanarayana (Dhanam)
Department of Journalism & Mass Comm Central University of Kashmir, Kashmir
Dr.Ton Quang Cuong
Dean of Faculty of Teacher Education University of Education, VNU, Hanoi
Off- Al- Ameen Medical College, Bijapur
Prof.Joseph R.Jayakar University of Sapienza, Rome
Prof.Mehsin Jabel Atteya
University of Eastern Philippines, Philippines
Dr.Senthur Velmurugan .V
C O N T E N T S
1. Impacts of Community Participation in Village Tourism Management: A Comparative Studies in Bali and Yogyakarta, Indonesia
I Ketut Putra Suarthana & I Nyoman Madiun
1
2. Study of Land use Change on Tourism area Using High Spatial Resolution of Remote Sensing Imagery
I Nyoman Sunarta, Made Sudiana Mahendra, A A. Suryawan Wiranatha
& Syamsul Alam Paturusi
17
3. Examining the Online Destination Image of Rural Areas in Bali: Case Study Pemuteran Village
Made Sandhi Yuliarsa & Putu Sucita Yanthy
32
4. The Effect of Service Quality in International Airport I Gusti Ngurah Rai on Satisfaction, Image, Tourists
7. Effectiveness of E-Learning Modules in Mathematics at the Higher Secondary Level
S. Leo Stanly
97
8. Exit Interviews and the Global Scenario
Vasaka Sridevikiran
9. Relationship Between Hotel Companies and Travel
10. Promoting Health Education among Lactating Mother through Social Case Work Intervention
G.Malleswaramma
134
11. The Impact of Learning Management System (LMS) on EFL Student Performance in the Sultanate of Oman
Joshi Thomas
16. Diversity of Termite Fauna in Urban Systems
Syeda Qaseem Fatima, M.Rajashekhar & K.Vijaykumar
195
17. Dual-Redundancy Anti-Skid Braking System with Passage Organization Technique in Aircraft
Ganesh Mohanrao Dhonde
201
18. A Study on Executive Training with Reference to Airport Authority of India (AAI) and Electronic Corporation of India (ECIL)
Nagaraju Battu & Ch.Yadagiri
19. Workforce Diversity Dimensions and Its Impact on Pharmaceutical Companies
P.Jayasudha & G.Manchala
224
20. Management of Executive Stress
K. John & N Jayalakshmi
241
21. Babasaheb Dr.B.R.Ambedkar and Institutional Establishment for Social, Political and Economic Rights
Surya Raju Mattimalla
Dr. K. VICTOR BABU
M.A.,M.A.,M.Phil.,Ph.D.,PDF, (D.Lit) Faculty of Philosophy and Religious Studies & Editor-in-ChiefInternational Journal of Multidisciplinary Educational Research (IJMER) & Sucharitha: A Journal of Philosophy and Religion
Andhra University, Visakhapatnam Pin - 530 003 , Andhra Pradesh – India
ISSN : 2277 – 7881
Impact Factor :2.972(2015)
Index Copernicus Value: 5.16
Editorial……
You will be happy to know that we have entered the fourth year of publication of IJMER, since its inception in April 2012. Focusing on many interdisciplinary subjects, the published papers are spreading the knowledge with fervent hope of upholding the holistic approach. With all my heart, I reiterate to echo my sincere feelings and express my profound thanks to each and every valued contributor. This journal continues to nurture and enhance the capabilities of one and all associated with it.
We as a team with relentless efforts are committed to inspire the readers and achieve further progress. Aim is to sustain the tempo and improve. We acknowledge with pleasure that our readers are enjoying the publications of Sucharita Publishers. We solicit to receive ideas and comments for future improvements in its content and quality. Editor – in-Chief explicitly conveys his gratitude to all the Editorial Board members. Your support is our motivation. Best wishes to everyone.
Dr.K.Victor Babu Editor-in-Chief
SOCIAL SCIENCES, HUM ANITIES, COM M ERCE & M ANAGEM ENT, ENGINEERING & TECHNOLOGY, M EDICINE, SCIENCES, ART & DEVELOPM ENT STUDIES, LAW
INTERNATIO NAL JO URNAL O FMULTIDISC IPLINARYEDUC ATIO NALRESEA RC H
ISSN: 2277- 7881; IMPAC T FAC TO R - 2.972; IC VALUE:5.16; ISI VALUE:2.286
VO LUME 4, ISSUE 8(1), AUG UST 2015
STUDY OF LAND USE CHANGE ON TOURISM AREA USING HIGH SPATIAL RESOLUTION OF REMOTE SENSING
IMAGERY
I Nyoman Sunarta Doctoral Program of Tourism Studies
Udayana University, Bali, Indonesia
Made Sudiana Mahendra Doctoral Program of Tourism Studies
Udayana University, Bali, Indonesia
A A. Suryawan Wiranatha Doctoral Program of Tourism Studies
Udayana University, Bali, Indonesia
Syamsul Alam Paturusi Doctoral Program of Tourism Studies
Udayana University, Bali, Indonesia
Introduction
Understanding determinants of land use in developing countries has
become a priority for researchers and policy makers with a wide range
of interests [1]. In the other hand, accurate and timely information
about land cover in urban areas is crucial for urban land management
decision-making, ecosystem monitoring and urban planning [2]. Remote
sensing technology has great potential for acquisition of detailed and
accurate land-use information for management and planning of urban
regions for various purposes [3].
High spatial resolution satellite images offer a great potential for the
extraction of land use and land cover related information for urban
areas [4]. Although high-resolution imagery in the form of aerial
photography has been available for many years, the launch of the
IKONOS-2 by Space Imaging in September 1999 has signaled a new era
in satellite remote sensing [5]. Utilization of high-resolution imagery
data on tourism areas is important to understand causes and their effect
Basically, changes in land use are closely related to the availability of
land and water. The availability of land and water resources determines
INTERNATIO NAL JO URNAL O FMULTIDISC IPLINARYEDUC ATIO NALRESEA RC H
ISSN: 2277- 7881; IMPAC T FAC TO R - 2.972; IC VALUE:5.16; ISI VALUE:2.286
VO LUME 4, ISSUE 8(1), AUG UST 2015
the productivity of the resources and provides information about the
potential of production. In general, land use is the result of continuous
interaction, balance and dynamic conditions between people’ s activities
in a certain area and the environmental constraints where they live in.
Knowing the land-use distribution and its changes is not only useful for
the sustainable management of natural resources, but it can also be
used as information for a spatial planning in the future. Theoretically,
land-use change is the process in which there is an increase in one type
of land use followed by a decrease in another type of land use within
different periods of time [6]. Land use change is driven by the
interaction in space and time between biophysical and human
dimensions [7].
Bali Province, one of the Indonesian tourism destinations, has major
changes in land use annually, especially in the coastal area of South Bali
[8,9]. In this area, coastal resources and tourism industry have been
experiencing a tremendous coastal change due to the tourism
development and associated commercial and residential growth.
There was also an alarming increase in land-use change in North
Kuta District. North Kuta, located in South Bali area, was originally a
rice-field area has now become a tourist area. Accommodations
especially villas have developed rapidly in this area. Land-use change
from paddy fields into settlements happens the most in the South and
East namely the areas that are parts of Kerobokan Kelod Village
Kerobokan Kaja Village, Dalung Village and Canggu Village [10]. The
Land-Use Map shows that there were more conversions of paddy fields
into settlements during the period of 1992 to 2003 in the northern
region, such as Kerobokan Kaja and Dalung. However, during the next
period (2003 to 2008) there was a change in the trend in which land-use
change from paddy fields into settlements was more concentrated in the
INTERNATIO NAL JO URNAL O FMULTIDISC IPLINARYEDUC ATIO NALRESEA RC H
ISSN: 2277- 7881; IMPAC T FAC TO R - 2.972; IC VALUE:5.16; ISI VALUE:2.286
VO LUME 4, ISSUE 8(1), AUG UST 2015
southern part, such as Kerobokan Kelod and Canggu Village.
This condition was driven by the development of the tourism sector
which was in fact concentrated in the South and East, as a result of the
impact of regional growth in Kuta District which is the generator and
the center of tourism growth in South Badung. Various tourist
accommodation facilities such as villas and restaurants as well as
various supporting facilities seemed to flourish in the South and East
parts. Based on the district land-use map of 1992, 2003 and 2008 [10],
the southern areas, which mainly comprised of paddy fields in 1992
were gradually converted into settlement areas in 2003, and the change
happened more rapidly close to the year of 2008. The development of
settlements generally followed the pattern of the road network that
existed in that era, especially the roads with the status of the provincial
and state roads. This fact is strengthened by the data of land-use change
in the level of Kerobokan Kelod Village where the total land-use change
from paddy fields into settlements was 21.25 hectares in a span of 3
years (7.8 hectares/year).
The purpose of this research is to classify and calculate land-use
change from 2006 to 2009 using high spatial resolution remote sensing
data in two tourist areas namely Canggu Village and Kerobokan Kelod
Village. Both villages are located in North Kuta District and have a
quite rapid development in tourism.
Data and Methods
Research Location
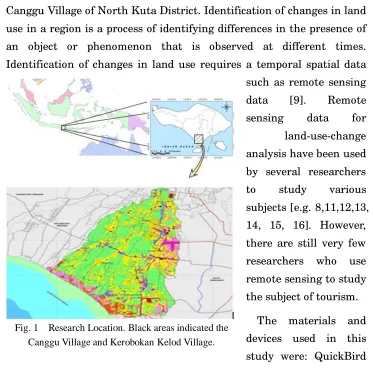
The research was conducted in Kerobokan Kelod and Canggu Village,
part of North Kuta District in South Bali areas. Fig. 1 indicated the
research location. Spatial analysis of remote sensing data was used to
analyze the changes in land use in Kerobokan Kelod Sub-district and
INTERNATIO NAL JO URNAL O FMULTIDISC IPLINARYEDUC ATIO NALRESEA RC H
ISSN: 2277- 7881; IMPAC T FAC TO R - 2.972; IC VALUE:5.16; ISI VALUE:2.286
VO LUME 4, ISSUE 8(1), AUG UST 2015
Fig. 1 Research Location. Black areas indicated the Canggu Village and Kerobokan Kelod Village.
Canggu Village of North Kuta District. Identification of changes in land
use in a region is a process of identifying differences in the presence of
an object or phenomenon that is observed at different times.
Identification of changes in land use requires a temporal spatial data
such as remote sensing
data [9]. Remote
sensing data for
land-use-change
analysis have been used
by several researchers
to study various
subjects [e.g. 8,11,12,13,
14, 15, 16]. However,
there are still very few
researchers who use
remote sensing to study
the subject of tourism.
The materials and
devices used in this
study were: QuickBird
satellite images
recorded on May 16, 2006, which were used to map the types of land use
in 2006; QuickBird satellite images recorded on October 15, 2009, which
were used in determining the type of land use in 2009; a digital map of
the earth of Indonesia in the scale of 1:25,000 obtained from the
Geospatial Information Agency (BIG, previously named Bakosurtanal)
which was used as a base map in the satellite image interpretation,
Global Positioning System (GPS) to determine the coordinates of the
research sites, as well as a computer for data analysis of remote sensed
INTERNATIO NAL JO URNAL O FMULTIDISC IPLINARYEDUC ATIO NALRESEA RC H
ISSN: 2277- 7881; IMPAC T FAC TO R - 2.972; IC VALUE:5.16; ISI VALUE:2.286
VO LUME 4, ISSUE 8(1), AUG UST 2015
images.
Remote sensing satellite image data, QuickBird year 2006 and 2009
were visually interpreted using the approach of interpretation [17].
On-screen digitizing method through computer screens was applied for
the visual interpretation process. On-screen digitizing method has been
applied for land-use mapping from satellite images carried out
independently [9,18,19,20] as well as by organizations in the United
States [21]. The results of the analysis with the on-screen interpretation
method were evaluated by field observations (to find out the ground
truth) to check the correctness level of analysis results that include
observations of the types of land use in the areas under the study and
their surrounding [22]. The geographical position of the observed
location was determined by measuring the coordinates of the observed
location using GPS. The data providing information from field
observations in the location where the coordinate samples were taken
were processed and matched with the data analysis of QuickBird images
as the primary resources in refining the analysis and classification of
land use.
The primary analysis in this study is the analysis of changes in land
use for all locations in Kerobokan Kelod Sub-district and Canggu Village
of North Kuta District. The total land-use change between the year of
2006 and 2009 was obtained by comparing the areas of types of land in
both spatial data. Meanwhile, the total area of land-use types in the two
villages/sub districts was obtained by cutting the spatial data of land use
in each year of observation with the administrative boundaries of
Kerobokan Kelod Sub-district and Canggu Village. ArcGIS 10 software
was used in the process of interpretation of land use and spatial analysis
of the land use data with the help of Image Analysis extensions while
the Microsoft Office Excel 2007 software was used to analyze attribute
INTERNATIO NAL JO URNAL O FMULTIDISC IPLINARYEDUC ATIO NALRESEA RC H
ISSN: 2277- 7881; IMPAC T FAC TO R - 2.972; IC VALUE:5.16; ISI VALUE:2.286
VO LUME 4, ISSUE 8(1), AUG UST 2015
data.
Based on the analysis results of land use change, detailed verification
was performed using Google Earth and field observations. This was
done to find out the facts on the ground about the changes and the
trends in the use of resources, especially the exploited land and water.
By knowing the changes in land use, the type and characteristics of the
changes as well as the exploited natural resources, the impacts that will
arise can be predicted and the solution to deal with such impacts on
natural resources can be anticipated.
Results and Discussion
The trend of changes in land-use in two sub districts representing two
different characters of area, namely Kerobokan Kelod Sub-district that
has become an urban area and Canggu Sub-district that is still
relatively agrarian, showed interesting dynamics over a span of three
years (2006-2009). Kerobokan Kelod as a sub district that is located
closer to the epicenter of the tourism development of Kuta (Seminyak
and Legian) was noticeably affected more strongly and thus experienced
rapid dynamics of land-use change. On the other side, Canggu
Sub-district experienced slower dynamics which were apparent in the
rice fields that still survived, at least during the period of three years
(2006-2009).
The dynamic change of land-use in Kerobokan Kelod is indicated for
example by the process of land conversion from a rice field area into a
non-rice field one over about 21 hectares and also by the shrinking
amount of vacant land by 12.6 hectares. Therefore, in total there are
about 33 hectares of land that have gone through a change of function
into an area of buildings and settlements in Kerobokan Kelod for 3
years (an average of 11 hectares/year). Similarly, the ratio of building
INTERNATIO NAL JO URNAL O FMULTIDISC IPLINARYEDUC ATIO NALRESEA RC H
ISSN: 2277- 7881; IMPAC T FAC TO R - 2.972; IC VALUE:5.16; ISI VALUE:2.286
VO LUME 4, ISSUE 8(1), AUG UST 2015
area and green area in Kerobokan Kelod in 2009 already showed an
alarming rate, which reached 68.9%. It means the area of constructed
land has grown by more than half of the total green/open area (Table 1).
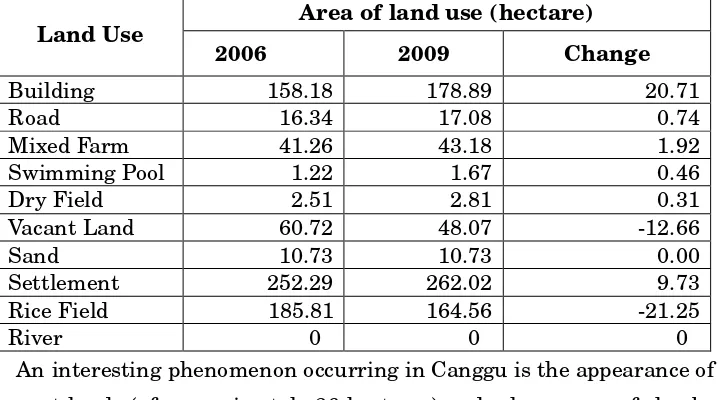
From the map in Fig. 2 it is noticeable that the areas experiencing
the highest functional changes in Kerobokan Kelod are located on the
eastern and southern parts, and are generally positioned close to
highways. This phenomenon is evidently a result of the great influence
of the development of tourism in Seminyak Sub-district which lies
precisely on the south of Kerobokan Kelod. The area of Kerobokan
Kelod has turned into some kind of a receiver of the massive
development that has already reached its peak in the areas of Seminyak
and Legian. The spread of developments that were taking place and
recorded until the year 2009 will continue to happen and be directed to
the West, which is Canggu Sub-district. This is the area growth
phenomenon of ‘ effects of the South’ which also occurs in other regions
or other villages in South Bali.
The settlements in the sub-district of Canggu form a linear pattern
which follows the paths of the roads and the river. The settlements that
have been formed give an impression that they block or cover the rice
fields that are located behind them. The settlements are spread evenly
in all parts of the area, whether in the upstream, midstream, or
downstream areas. This is in contrast with the pattern of settlement in
Kerobokan Kelod which forms a pattern of checkers that are spread out,
scattered, and disorganized. The linear pattern formed in Canggu
signifies that the village is still agrarian in character. Meanwhile, the
dynamics of land-use change in Canggu occur relatively slower. The rate
of the reduction of rice-field land is recorded to be only 0.94 hectares,
whereas of dry land 0.09 hectares, and of mixed farms 1.34 hectares.
Therefore in total there are approximately 2.37 hectares of rice field
INTERNATIO NAL JO URNAL O FMULTIDISC IPLINARYEDUC ATIO NALRESEA RC H
ISSN: 2277- 7881; IMPAC T FAC TO R - 2.972; IC VALUE:5.16; ISI VALUE:2.286
VO LUME 4, ISSUE 8(1), AUG UST 2015
land, dry field, and farm land whose functions are converted (an average
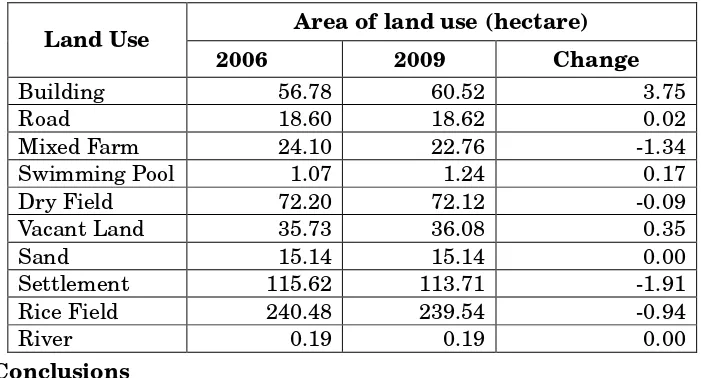
0.79 hectares/year). Similarly, the increase in the area of land that
serves as constructed land is relatively small, that is 3.75 hectares
(Table 2). However, if these data are linked in a rural context it will
become clear that what has happened in Canggu has shown a
considerably dynamic progress of land-use change.
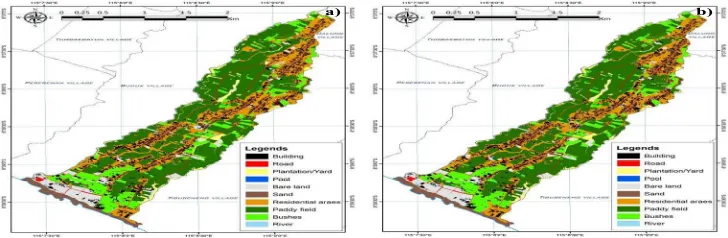
Table 1. Change of Land Use in Kerobokan Kelod Village in
2006 and 2009
Land Use
Area of land use (hectare)
2006 2009 Change
Building 158.18 178.89 20.71
Road 16.34 17.08 0.74
Mixed Farm 41.26 43.18 1.92 Swimming Pool 1.22 1.67 0.46
Dry Field 2.51 2.81 0.31
Vacant Land 60.72 48.07 -12.66
Sand 10.73 10.73 0.00
Settlement 252.29 262.02 9.73 Rice Field 185.81 164.56 -21.25
River 0 0 0
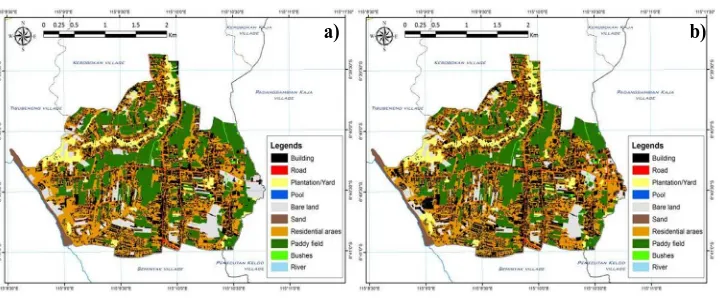
An interesting phenomenon occurring in Canggu is the appearance of
vacant lands (of approximately 36 hectares) and a large area of shrubs
in the border area of the southern beach in Canggu Sub-district (Fig. 3).
All this while those vacant lands and the bush lands have been
functioning in ecological terms to withstand the onslaught of the
abrasion caused by the Southern Beach waves. The vacant lands are
most likely lands that are already owned by foreign investors that on a
momentum one day will be used for tourist accommodations. At this
moment a number of villas have been established along the southern
beach of Canggu.
INTERNATIO NAL JO URNAL O FMULTIDISC IPLINARYEDUC ATIO NALRESEA RC H
ISSN: 2277- 7881; IMPAC T FAC TO R - 2.972; IC VALUE:5.16; ISI VALUE:2.286
VO LUME 4, ISSUE 8(1), AUG UST 2015
There is a possibility of this phenomenon to be followed by the
emergence of other tourist accommodation facilities in the future, along
with the increasingly welcoming attitude of the people of Canggu
towards the development of tourism.
a) b)
Fig. 2 Land use maps of Kerobokan Kelod Village. (a) 16 May 2006, and (b)
15 October 2009
Based on a further observation through Google Earth and field
observations, several propositions can be suggested as follows. The
change of land-use in Kerobokan Kelod Sub-district, particularly judged
by the development of the buildings and vacant lands occurred far more
rapidly than in the village of Canggu. Most of the development with
regard to buildings is related to accommodations or villa buildings
which are generally built on paddy field areas. This suggests that the
declining area of rice fields in Kerobokan Kelod Sub-district (11
hectare/year) is much faster than in the village of Canggu (0.9
hectare/year), and it can be predicted that the development of villa
buildings in the village of Canggu will occur more rapidly in line with
the development in Kerobokan Kelod Sub-district, so that these two
areas will face the problems of shrinking land (rice-field lands) which is
the appeal of the area to tourists in addition to being the source of staple
INTERNATIO NAL JO URNAL O FMULTIDISC IPLINARYEDUC ATIO NALRESEA RC H
ISSN: 2277- 7881; IMPAC T FAC TO R - 2.972; IC VALUE:5.16; ISI VALUE:2.286
VO LUME 4, ISSUE 8(1), AUG UST 2015
food for the local people.
The type of land-use change occurring in both of the
sub-districts/villages is dominated by the change of land-use from
rice-fields into buildings. The type of buildings that are flourishing is in
general accommodations/villa buildings. The construction of villas in
both of these areas are getting interesting to discuss for a reason that
each room or villa unit is generally completed with a swimming pool.
This indicates that in the two areas people will face the problems of
water shortage.
This is carried out to identify the actual facts on the change occurring
and the trend of the natural resources, particularly land and water, that
are being used. By recognizing the change of land-use, the types and
characteristics of change that take place as well as the natural resources
that are used, the consequential effects can be predicted and an
anticipative solution can be determined to protect such natural
resources.
a) b)
Fig. 3 Land use maps of Canggu Village. (a) 16 May 2006, and (b) 15
October 2009
INTERNATIO NAL JO URNAL O FMULTIDISC IPLINARYEDUC ATIO NALRESEA RC H
ISSN: 2277- 7881; IMPAC T FAC TO R - 2.972; IC VALUE:5.16; ISI VALUE:2.286
VO LUME 4, ISSUE 8(1), AUG UST 2015
Table 2. Change of Land Use in Canggu Village in 2006 and 2009
Land Use Area of land use (hectare)
2006 2009 Change
Building 56.78 60.52 3.75
Road 18.60 18.62 0.02
Mixed Farm 24.10 22.76 -1.34 Swimming Pool 1.07 1.24 0.17 Dry Field 72.20 72.12 -0.09 Vacant Land 35.73 36.08 0.35
Sand 15.14 15.14 0.00
Settlement 115.62 113.71 -1.91 Rice Field 240.48 239.54 -0.94
River 0.19 0.19 0.00
Conclusions
The analysis of satellite image data with the geographical information
system to obtain the data on land-use and its changes indicate that
there was a change in the type of land use in the North Kuta District,
especially in Kerobokan Kelod Sub-district and Canggu Village between
2006 and 2009. Kerobokan Kelod Sub-district is the area that undergoes
the largest change of land-use, either with an increase or reduction in
types of land use. The increasing types of land use that are present in
the region are mainly buildings and settlements. Building areas
increased by 20.71 hectares during the period of 3 years, while
settlements only increased by 9.73 hectares in the same period.
Reduction of land-use types that occurred in this region was the
reducing area of paddy fields in the total of 21.25 hectares during the
period of 3 years followed by the reducing area of vacant land by 12.66
hectares in the same period.
Furthermore, Canggu Village had the increasing area of land use in
the forms of buildings by 3.75 hectares and vacant land by 0.35 hectares
only. Meanwhile, the reduction of land use was in the form of 0.94
INTERNATIO NAL JO URNAL O FMULTIDISC IPLINARYEDUC ATIO NALRESEA RC H
ISSN: 2277- 7881; IMPAC T FAC TO R - 2.972; IC VALUE:5.16; ISI VALUE:2.286
VO LUME 4, ISSUE 8(1), AUG UST 2015
hectares of paddy fields and settlements by 1.91 hectares. If changes in
land use that took place in Canggu Village and Kerobokan Kelod
Sub-district are compared, changes in Canggu Village are smaller than
that of Kerobokan Kelod Sub-district. This happened due to the
locations of the two regions, where Kerobokan Kelod Sub-district is
closer to Kuta District which is the center of tourism growth in Badung
and Bali.
Building area developments that occurred in Kerobokan Kelod
Sub-district and Canggu Village are generally dominated by tourism
facilities in the forms of accommodations or villas. The development and
existence of accommodations in this area should receive more attention
because in addition to converting fairly extensive areas of paddy fields
they will also utilize quite a significant amount of water resources. Thus,
the development of tourism in the two regions does not only reduce the
paddy field areas but also leads to lower amount of water supply.
References
1) Nelson, G. C., & Geoghegan, J. (2002). Deforestation and land use
change: sparse data environments. Agricultural Economics, 27(3),
201-216.
2) Zhou, W., Troy, A., & Grove, M. (2008). Object-based land cover
classification and change analysis in the Baltimore metropolitan area
using multitemporal high resolution remote sensing data. Sensors,
8(3), 1613-1636.
3) Herold, M., Scepan, J., & Clarke, K. C. (2002). The use of remote
sensing and landscape metrics to describe structures and changes in
urban land uses. Environment and Planning A, 34(8), 1443-1458.
4) Van de Voorde, T., De Genst, W., Canters, F., Stephenne, N., Wolff, E.,
INTERNATIO NAL JO URNAL O FMULTIDISC IPLINARYEDUC ATIO NALRESEA RC H
ISSN: 2277- 7881; IMPAC T FAC TO R - 2.972; IC VALUE:5.16; ISI VALUE:2.286
VO LUME 4, ISSUE 8(1), AUG UST 2015
& Binard, M. (2004). Extraction of land use/land cover related
information from very high resolution data in urban and suburban
areas. Remote Sensing in Transition, 237-244.
5) Sawaya, K. E., Olmanson, L. G., Heinert, N. J., Brezonik, P. L., &
Bauer, M. E. (2003). Extending satellite remote sensing to local
scales: land and water resource monitoring using high-resolution
imagery. Remote Sensing of Environment, 88(1), 144-156.
6) Wahyunto, M.Z. Abidin, A. Priyono, and Sunaryo. 2001. Studi
Perubahan Penggunaan Lahan Di Sub DAS Citarik, Jawa Barat dan
DAS Kaligarang, Jawa Tengah. Prosiding Seminar Nasional
Multifungsi Lahan Sawah. Balai Penelitian Tanah. Bogor.
7) Veldkamp, A. Verburg, P. H., 2004. Modeling Land Use Changes and
Environmental Impact: Introduction to the Special issues. Journal of
Environmental Management. 72: 1-3.
8) As-syakur, A.R. 2011. Perubahan Penggunaan Lahan Di Provinsi Bali.
Ecotrophic, 6(1). 1-7.
9) As-syakur, A.R., I.W. Suarna, I.W.S. Adnyana, I.W. Rusna, I.A.A.
Laksmiwati, and I.W. Diara. 2010. “ Studi Perubahan Penggunaan
Lahan Di DAS Badung” . Jurnal Bumi Lestari, 10(2). pp. 200-207.
10) Bappeda Badung, 2011. Rencana detil Tata Ruang Kecamatan Kuta
Utara. Laporan Badung Bappeda.
11) Weng, Q. 2002. Land use change analysis in the Zhujiang Delta of
China using satellite remote sensing, GIS and stochastic modelling.
Journal of environmental management, 64(3), 273-284.
12) Herold, M., Scepan, J., Müller, A., and Günther, S. 2002.
Object-oriented mapping and analysis of urban land use/cover using
IKONOS data. In Geoinformation for European-wide Integration:
INTERNATIO NAL JO URNAL O FMULTIDISC IPLINARYEDUC ATIO NALRESEA RC H
ISSN: 2277- 7881; IMPAC T FAC TO R - 2.972; IC VALUE:5.16; ISI VALUE:2.286
VO LUME 4, ISSUE 8(1), AUG UST 2015
Proceedings of the 22nd Earsel Symposium on Remote Sensing,
Prague, Czech Republic, June 4-6, 2002.
13) Wu, Q., Li, H.Q., Wang, R-S., Paulussen, J., He, Y., Wang, M., Wang,
B-H., and Wang, Z. 2006. Monitoring and predicting land use change
in Beijing using remote sensing and GIS. Landscape and Urban
Planning, 78(4), 322-333.
14) Rogan, J., and Chen, D. 2004. Remote sensing technology for
mapping and monitoring land-cover and land-use change. Progress in
planning, 61(4), 301-325.
15) Yuan, F. 2008. Land‐cover change and environmental impact
analysis in the Greater Mankato area of Minnesota using remote
sensing and GIS modelling. International Journal of Remote Sensing,
29(4), 1169-1184.
16) Brown, J. C., Kastens, J. H., Coutinho, A. C., Victoria, D. D. C., and
Bishop, C. R. 2013. Classifying multiyear agricultural land use data
from Mato Grosso using time-series MODIS vegetation index data.
Remote Sensing of Environment, 130, 39-50.
17) Yagoub, M. M. 2004. Monitoring of urban growth of a desert city
through remote sensing: Al-Ain, UAE, between 1976 and 2000.
International Journal of Remote Sensing, 25(6), 1063-1076.
18) Wikantika, K., Sinaga, A., Hadi, F., & Darmawan, S. (2007). Quick
assessment on identification of damaged building and land‐use
changes in the post‐tsunami disaster with a quick‐look image of
IKONOS and Quickbird (a case study in Meulaboh City, Aceh).
International Journal of Remote Sensing, 28(13-14), 3037-3044.
19) Doygun, H., Alphan, H., and Gurun, D. K. (2008). Analysing urban
expansion and land use suitability for the city of Kahramanmaraş,
INTERNATIO NAL JO URNAL O FMULTIDISC IPLINARYEDUC ATIO NALRESEA RC H
ISSN: 2277- 7881; IMPAC T FAC TO R - 2.972; IC VALUE:5.16; ISI VALUE:2.286
VO LUME 4, ISSUE 8(1), AUG UST 2015
Turkey, and its surrounding region. Environmental monitoring and
assessment, 145(1-3), 387-395.
20) Deng, X., and Liu, J. (2012). Mapping Land-Cover and Land-Use
Changes in China. Remote Sensing of Land Use and Land Cover:
Principles and Applications, 8, 339.
21) Lacy, R. 1992. South Carolina finds economical way to update digital
road data. GIS World, 5, 58–60.
22) Murthy, C.S., S. Jonna, and P.V. Raju. (1995). "Paddy Field Prediction
in Bhadra Project Command Area Using Remote Sensing Data".
Asian Pacific Remote Sensing Journal 8(1): 79-84.