AR4-50 MODEL, THE EXTRACTION OF SPECTRAL VALUES INTO REMOTE SENSING
IMAGE DATA-BASED LAND USE CLASS
Akhbar1*), Muhammad Basir2), B. Elim Somba2) and Golar1) 1)Faculty of Forestry University of Tadulako
Jl. Soekarno Hatta km 9 Kampus Bumi Bahari Tadulako, Tondo, Palu, Central Sulawesi 2) Faculty of Agriculture University of Tadulako
Jl. Soekarno Hatta km 9 Kampus Bumi Bahari Tadulako, Tondo, Palu, Central Sulawesi *) Corresponding author Phone: +62-451-422966 E-mail: [email protected]
Received: July 12, 2013/ Accepted: September 30, 2013
ABSTRACT
This study attempted to develop an extraction model of spectral values of land objects into land use/land cover classes on remote sensing image in the provision of land database for planning, evaluation, and monitoring in agriculture and forestry. This study employed an Isodata method and Knowledge-Based Systems (KBS) using the Landsat 7 ETM+ image in the coverage area of 117,799.06 ha, and the SPOT 5 XS image in the coverage area of 113,241.37 ha in Palu, Sigi and Donggala. The study found two image models labelled as AR4-50 and SBP-AR4-50. The separability image AR4-50 model has an average capability for separating land object pixels which are statistically 1811.98 to 1972.08 ( moderate-good), with the class accuracy of land use/land cover using the image homogeneity model of SBP-AR4-50, which is totally (confusion matrix) 72.15% -87.17%, the accuracy level of land map generator for agricultural land/forestry is in good-excellent category on the Landsat 7 ETM+ and SPOT 5 XS images.
Keywords: Image, Class, Land Use, Model, Separability, Homogeneity
INTRODUCTION
Remote sensing image has a great benefit for the development of agriculture and forestry. In the planning, evaluation, and monitoring for the spatial dimension, the remote sensing image is a primary data source for the forest and land resources potency data collection. In addition, it assists in rapid and accurate monitoring for the development of agricultural and forestry land use.
The types of remote sensing images are widely used in agricultural and forestry sectors today, including Landsat 7 ETM+ and SPOT 4 & 5 images. The two types of images have moderate to high resolution (Landsat; 15 m, 30 m and 60 m, and SPOT 5. 2.5 m, 5 m, 10 m and 20 m). These could be used for the forest and land resources mapping, particularly in land use/land cover mapping and vegetation.
Moderate sensing resolution in land use/land cover mapping such as Landsat 7 ETM+ presenting a lot of spectral bands has been widely used. However, it seems to have less optimal capability in extracting the types of natural and crops vegetation, and the types of open area on the dry/wet land on a specific use. This image capability would greatly decrease when it is used in very diverse natural forest vegetation species in the digital classification process, either in guided or unguided classification method. On the other hand, Richards and Jia (2006) point out that SPOT 5 XS image (multispectral) with a 10 meters spatial resolution is often considered less detail at the scale of 1:50,000 in providing land use information.
According to Kamal and Arjasakusuma (2010), the low level of land cover classification accuracy using moderate resolution hyperspectral image is partly due to the coarse image resolution which brings about many mixed-pixels, and to the similarity of spectral of some objects leading to misclassification. In addition, Lu et al. (2011) argues that the problem of mixed-pixels for moderate and coarse resolution image is the challenge in land mapping. A traditional image classification method of pixel per pixel is ineffective in coping with mixed-pixel problems. The sub-pixel-based method is also ineffective in Accredited SK No.: 81/DIKTI/Kep/2011
separating the pixels of one land cover from another one.
Based on the description above, a study on the characteristics recognition and the extraction of spectral values of Landsat 7 ETM+ and SPOT 5 XS images-based land objects is developed. The study was conducted in Palu valley and the surrounding area (Palu city, Sigi and Donggala Regency, Central Sulawesi).
This study aims to develop a model for extracting spectral values of image objects into land use/land cover classes in order to provide land database for the purposes of planning, evaluation, and monitoring in the field of agriculture and forestry. To achieve this objective, the study uses Landsat 7 ETM+ and SPOT 5 XS images.
This research is expected to be useful for the development of science, particularly in preparing alternative method for identifying and classifying remote sensing image-based land use
in the field of agriculture and forestry. In addition, it is also expected to encourage the emergence of new ideas and innovative research that could develop the science of remote sensing in agriculture and forestry.
MATERIALS AND METHODS
Remote sensing images used are Landsat 7 ETM+ image, path/row: 114-61, recorded in May 26, 2003 and SPOT 5 XS SWIR image, path/row: 308/352, recorded in July 23, 2011. This study took place from January to June 2013 in the Computation and CTFM (ex. Storma) Laboratory, Faculty of Forestry, Tadulako University. The study sites involved Palu, Donggala and Sigi, Central Sulawesi. Geographically, the area is situated in the coordinates of 119° 47 '47.68 "E - 120° 2' 8.76" E and 0° 41 '10.41 "S - 1° 5' 1.68" S, as shown in Figure 1.
The study was carried out in three phases of image processing, namely the pre-modeling (geometric and radiometric correction); modeling (soil index analysis, optimum index factor/OIF, Principal component analisys/PCA, the modeling of image bands, and unguided classification (Isodata), knowledge-based classification (KBS); and post-modeling phase (model accuracy testing through ground check). The equipment for image data processing and map, as well as field survey used Geographic Information System (GIS) and Global Positioning System (GPS) programs.
In the pre-modeling phase, geometric and radiometric image corrections were carried out in order to obtain a corrected image of geometric errors and problems in the appearance of objects on the image such as blurring the image, and the likes. In the modeling phase, image processing was carried out as follows: (1) the analysis of a single band of 6 bands (1,2,3,4,5,7) on the Landsat 7 ETM+ and 4 bands (1,2,3,4) on the SPOT 5 XS; (2) the preparation of land indices of the two bands using image algebra operation (arithmetic) by reducing band5 and band3 on the Landsat 7 ETM+ and band4 and band2 on the SPOT 5 XS images; (3) the search for the highest OIF (Optimum Index Factor) value as the result of the combination of three band images, and the correlation between the two bands on the Landsat 7 ETM+ and the SPOT 5 XS image; (4) the preparation of combined band752 image on the Landsat 7 ETM+ and band432 on the SPOT 5 XS image, followed by arithmetic image operation; (5) the turning over of the axis/principal component analysis (PCA) on both types of the images; (6) the modeling of new transformation (AR) on both types of the images in joint operation of the new image, i.e. the land index image, the image of PCA with the highest OIF value, as well as the image of band752 on the Landsat 7 ETM+ image and band432 on the SPOT 5 XS image; (7) the search for the number of the best land object classes of the three group classes (25 classes, 50 classes and 75 classes), followed by the image object separability testing using transformed divergence (TD) integrated with the types of interpretation of land use/land cover; (8) the modeling of land object class into a class of land use/land cover using knowledge-based systems (KBS).
In the post-modeling phase, the accuracy model testing was carried out by trying out a field verification (ground check). In this testing, confusion matrix and kappa method was used. In the accuracy testing, the criteria used were land use/land cover classification results in agriculture and forestry by seting up the limit of success
model of ≥80%.
Accuracy assessment determines the quality of the map extracted from remotely sensed data (Foody (2002); Congalton and Green (2009) in Kindu, et al. (2013). According to Congalton and Green (2009) in Kindu et al. (2013), an error matrix or confusion matrix is a common practice employed for assessment of classification accuracy. The matrix compares information obtained by reference sites to that provided by classified image for a number of sample areas. Accordingly, overall accuracy, producer’s and user’s accuracies, and Kappa statistic were calculated from the error matrix.
RESULTS AND DISCUSSION
Statistical Image of Model Input
The statistical analysis results of land index image (LI53) on the Landsat 7 ETM+ and LI42 on the SPOT 5 XS images show that spectral pixel values of IL53 ranged from -188 to 87, the mean value was 17.99 and the standard deviation was 28.69, while the IL42 ranged from -59 to 153, the mean value was 30.89 and the standard deviation was 28.63.
(0-255), the mean (75.81-86.47), and the stdv (35.34-45.06).
The Principle Component Analysis was undertaken in the composite images. The variance contribution value of PCA1 (axis I) was 81.67%, PCA2 (axis II) was 13.31%, and PCA3 (axis III) was 5.02%. The calculation of vector-eigen values showed the values of variance-covariance of the composite image of band541, i.e. the biggest variance value of band5 in PCA1 compared with band4 in PCA2, and band1 in PCA3, respectively 0.665> 0.518>0.129. It is explained that band5 in this PCA determined the new primary axes direction on the elipsoide pixels. In addition, on the SPOT 5 XS image, band123 composite image was used, followed by the PCA as performed on the Landsat 7 ETM+ image. The SPOT 5 XS image had a spectral value of band123 and band432 composite image, i.e. the minimum-maximum values (0-254), the mean (48.75-63.93), the stdv values were 41.98-53.75.
In relation to the composite image of band752 results on the Landsat 7 ETM+ image and composite image of band432 on the SPOT 5 XS image, an image arithmetic operation to find the absolute value of the spectral image was conducted. The inclusion of band7 (far infrared) combined with band5 (middle infrared) and band2 (green) on the Landsat 7 ETM+ image resulted in a statistical absolute value image which is relatively similar to the original composite image. Results of Modeling AR4-50 Image
There are two models of image analysis:
The first model is the model for the land object characteristic analysis system identification of the image data which has the capability of extracting classes of object land pixels. This is a model of transformation image data of AR-4 labeled as the separability AR4-50 image model.
The second model is the class analysis system model of land use/land cover type which has the capability in combining land object pixel classes into a homogen land use classes. This is a model image data classification labeled as the class homogeneity SBP-AR4-50 image model. Separability AR4-50 Image Model:
On the transformation model of Landsat 7 ETM+ and SPOT 5 XS images, two new transformation models (AR) were produced:
TM of AR-4 (Landsat 7 ETM+ image) = (PCAband145 U Absband752 U band IL53) …..1) Remarks:
TM of AR-4: The transformation model
TM of AR-4 (SPOT 5 XS image) = (PCAband123 U Absband432 U band IL42) ... (2).
Remarks:
TM : The transformation model
On the model of AR4 Landsat 7 ETM+ image, a linear regression model of three layers of image were obtained:
Layer 1:Image of PCA band145: YPCA145 = 1.528 x image, a linear regression model of three layers of image were obtained:
Layer 1:Image of PCA band123: YPCA123 =
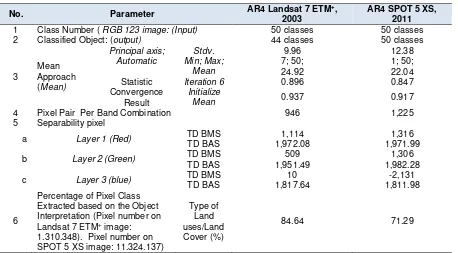
Table 1. Model AR4-50 Test on Landsat 7 ETM+ Image, in 2003 and SPOT 5 XS Image, in 2011
No. Parameter AR4 Landsat 7 ETM+,
2003
AR4 SPOT 5 XS, 2011
1 Class Number ( RGB 123 image: (Input) 50 classes 50 classes 2 Classified Object: (output) 44 classes 50 classes
3 Extracted based on the Object Interpretation (Pixel number on Landsat 7 ETM+ image: 1.310.348). Pixel number on SPOT 5 XS image: 11.324.137)
Type of
TD is measurement technique of separate level between class pixels. Table 1 shows TD BAS Band Reddadn Band Green (well separated), while TD Band Blue (moderately separated). With Criteria:
Homogeneity SBP-AR4-50 Image Model
The SBP-AR4-50 image model is an advanced model of the AR4-50 model, modeled by using a knowledge-based system (KBS) with the purpose of integrating several different spectral classes (it is actually similar land use class) into a specific class by a logical conditioning. The logical conditioning is meant to be appropriate with SBP-AR4-50, i.e. to make a logical statement if ... and... then. According to Danoedoro (2012), the process of merged classes is commonly incorporated into the post-classification module and operated by a logical conditioning. Further explanation is that this method could produce a new classified image or land cover maps with fewer class number, but it is more
informative in describing variations in land cover in the study area.
Image model of SBP-AR4-50 could simplify the number of 50 land classes generated by the Isodata method to be simple, flexible and applicable land use classes. As a simple model, it could shorten up to 14-15 land object classes. As a flexible model, it is easily modified to fix its purposes. As an applicable model, it could be directly utilized by the users. The Image model of SBP-AR4-50 has a merging capability of more class objects into a few number of classes.
Principally, the model of SBP-AR4-50 tries to change the spectral class pixels into a new class of pixels presented as a land use map. The classification results indicate that the pixel land cover classes were not entirely converted into land use classes because the dominance of the land in the study area covered the body of water, bare soils, grasses, shrubs and bushes. In addition, cloud cover and shadows cannot be incorporated into the land use classes. Thus, the model of SBP-AR4-50 presented two groups of class attributes as the output.
The model of SBP-AR4-50 worked with the pixel class groups of the Landsat 7 ETM+, the SPOT TD <=1.600 : not separated
TD 1.601-1699 : poorly separated TD 1.700-1.899 : moderately separated TD 1.900-1.999 : well separated
5 XS images in clusters, the standard deviation with relatively small values (9.96 to 12.38), the homogeneous color composite image, the pixel values separability of moderate-good category, and the various spectral classes number (44-50 classes). The model of 50 spectral classes resulted in some relatively similar spectral class objects, but different spectral values formed more than one class. The model of SBP-AR4-50 summarised the number of spectral classes into less number of land use and land cover classes relevant to the land use type attributes defined in the system.
Results of Accuracy Test Model
Homogeneity SBP-AR4-50 model on the The results achieved by the Landsat 7 ETM+ image-based SBP-AR4-50 data show that the pixels in the sample area had been well classified because its accuracy level (more than 80%) was the limit defined in this study. These accuracy results were relatively similar to those of Abellera’s study (2005) using a knowledge-based systems / KBS) taken from the Landsat 7 ETM+ image in the mapping of the land cover surface, i.e. 86.2% (the result of confusion matrix). He further argues that the accuracy of more than 85% could be considered satisfactory. Furthermore, the accuracy results obtained by using SPOT 5 XS image were smaller than the limit set out in this study. These results are relevant to Richards and Jia (2006) that the image of the SPOT 5 XS (multispectral) with a 10 meter spatial resolution is often considered less detail in providing land use information in a scale of 1:50,000.
Martínez and Mollicone (2012) explain that when analyses were support by high (10-30 m Landsat image data) or very high (<10 m) spatial resolution remote sensing data, good results were provided with overall accuracies above 87% in the identification of key elements where soil characterized land use classes. Furthermore, from the results of the study by Manandhar, et al. (2009), it was explained that applying post-classification correction (post-classification correction/PCC) using ancillary data and knowledge-based logic rules could increase the overall classification accuracy on Landsat-TM imagery of 2005 map from 79% to 87%
of maximum likelihood classification (MLC) results on exraction land use/land cover (woodland, pasture/scrubland, vineyard, built-up, water-body).
Regardless of Richards and Jia (2006), the low results obtained from the SPOT 5 XS image was also due to the large land object covered with clouds and shadows. As a result, there were some spectral pixel values of land which could not be separated from the clouds and shadows, particularly in the application of the SBP-AR4-50 model. In addition, in the case of field sample selection, there were some sample points that were not used because the sample was covered by the clouds and shadows. This condition might be a contributor to the low accuracy.
However, based on the result of the producer’s accuracy and user’s accuracy on the use of agriculture and forestry, it seemed to be relatively effective to be used to produce land use class maps for dryland agriculture such as mixed plantations and coconut plantations. This is because the value of the accuracy test results of the producer’s accuracy was about 100% and the user’s accuracy was about 79.07% - 82.41%. Similarly, wetland agricultures such as rice fields and marine fisheries in the category of the producer’s accuracy ranged from 75% to 100%, and the user’s accuracy ranged from 80.83% to 100%. The result was relatively higher than that of Huang and Jensen’s (1997) study investigating the accuracy of the land classes (water, die vegetation, spikerush, mixed vegetation, broadleave trees and open area) by applying three methods, namely the expert systems, maximum likelihood, and Isodata using the SPOT image with
user’s accuracy results of 74.16%, 65.07% and
61.24%, respectively.
Sutanto (1994) provides the criteria for the class accuracy of test results in the following ranking: >80% (excellent); 60-79% (good), 40-59% (moderate), 20-39% (poor); < 20% (very poor). Referring to the above criteria, the model shows that the results achieved by the SBP-AR4-50 using the data of the Landsat 7 ETM+ image were included in excellent criteria, while those using the SPOT 5 XS image resided in good criteria.
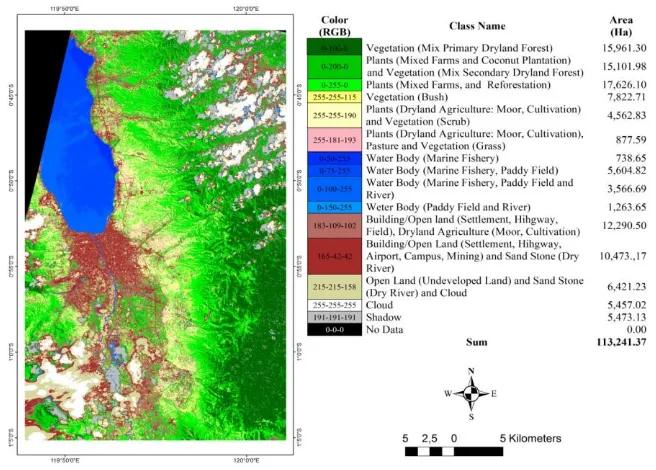
Figure 2. Land Use Class Result of SBP-AR4-50 on the Landsat 7 ETM+ Image, in 2003
CONCLUSION AND RECOMMENDATION
The use of the separability-homogeneity AR4-50 image model on the Landsat 7 ETM+ was included in an excellent category, while that on the SPOT 5 XS image resided in a good category as a model in the classification of land use/land cover in agriculture and forestry.
The separability-homogeneity AR4-50 image model is expected to be one of the development models of many previous models that could be considered in the remote sensing image data processing, particularly in agriculture and forestry.
ACKNOWLEDGEMENTS
Thanks are extended to: Computing and Center for Tropical Forest Margins/CTFM (ex. Storma) Laboratory, Faculty of Forestry, Tadulako University; Forest Area Consolidation Region XVI Palu Office; Titara Marantam Consultant; Central Sulawesi Provincial Forestry Office for the support of data (image, map) and equipments and the intitial preparation for the completion of the study.
REFERENCES
Abellera, L.V. 2005. Application of Knowledge-Based Classification Techniques and Geographic Information Systems (GIS) on Satellite Imagery for Stormwater Management. A dissertation submitted in partial satisfaction of the requirements for the degree Doctor of Philosophy in Civil Engineering. University of California, Los, Angeles
Danoedoro, P. 2012. Intoduction to Digital Remote Sensing (in Indonesian). Andi. Yogyakarta
Dwiyanti, E. 2009. Analisis Data Landsat ETM+
Untuk Kajian Geomorfologi dan Penutup/ Penggunaan Lahan dan Pemanfaatannya Untuk Pemetaan Lahan Kritis di Kota Cilegon. Tesis. Departemen Ilmu Tanah dan Sumberdaya Lahan Fakultas Pertanian Institut Pertanian Bogor. Bogor
Forestry Office, Central Sulawesi Province. 2011. Map of Forest Territory and Waters Central Sulawesi. Palu
Huang, X. and J.R. Jensen. 1997. A Machine-Learning Approach to Automated
Knowledge-Base Building for Remote Sensing Image Analysis with GIS Data. Photogrammetric Engineering & Remote Sensing, “ 63 (10)”, 1185-1194.
Jaya, I. N. S.. 2002. Forestry Satellite Remote Sensing (in Indonesian). Forestry Inventory Laboratory. Department of Forestry Management, Faculty of Forestry IPB. Bogor
Kamal, M. dan S. Arjasakusuma. 2010. Information on Land Cover via Land Spectrometre for Input to Endmember in medium Resolution of Hyperspectrum (in Indonesian). Scientific Journal of Geomathics-National Mapping and Survey Body.“16 (2)”, 12-22.
Kindu, M., T. Schneider, D. Teketay dan T. Knoke. 2013. Land Use/Land Cover Change Analysis Using Object-Based Classification Approach in Munessa-Shashemene Landscape of the Ethiopian Highlands. Remote Sensing. “5 (5)”, 2411-2435.
Lu, D., E. Moran, S. Hetrick, dan G. Li. 2011. Mapping Impervious Surface Distribution with the Integration of Landsat TM and QuickBird Images in a Complex Urban– Rural Frontier in Brazil. In: Advances of Environmental Remote Sensing to Monitor Global Changes. Ni-Bin Chang (ed.), CRC Press/Taylor and Francis, 277-296.
Manandhar, R., I.O.A. Odeh dan T. Ancev. 2009. Improving the Accuracy of Land Use and Land Cover Classification of Landsat Data Using Post-Classification Enhancement. Remote Sensing, “1 (3)”, 330-344.
Martínez, S. and D. Mollicone. 2012. From Land Cover to Land Use: A Methodology to Assess Land Use from Remote Sensing Data. Remote Sensing, “4 (4)”, 1024 -1045.
Richards, J. A., dan Jia, X.P. 2006. Remote Sensing Digital Image Analysis, An Introduction (4th edition). Berlin: Springer-Verlag