Estimating NPP and impacts of climate change on sandy soils in Australia
using a soil carbon model calibrated to measurements of soil carbon, nitrogen
and carbon isotopes
John Carter1,2, Jonathan Wynn 3,2 and Michael Bird 3,2
1
Natural Resource Sciences Centre, Department of Natural Resources, Mines and Energy, Indooroopilly, Qld4068, Australia. Email: [email protected]
2
CRC Greenhouse Accounting, Australia. 3
Research School of Earth Sciences, Australian National University, Canberra, ACT, 0200, Australia; current address: School of Geography and Geosciences, University of St. Andrews, St. Andrews, KY16 9AL, United Kingdom; [email protected], [email protected]
Abstract
The CENTURY model was modified and calibrated to a robust data set from of 31 regions of sandy soils using landscape average measurements of soil carbon, nitrogen and δ13C, δ14C and some remotely sensed data. The 31 regions covered the full range of climate experienced in Australia including temperature extremes from Katherine in the Northern Territory to Cape Grim in Tasmania, and rainfall extremes from desert sand hills in the interior to tropical rainforests of the east coast of Queensland. A genetic algorithm was used to calibrate generic parameters describing ecosystem attributes such as N inputs, N loss after fire, and plant growth sensitivity to temperature. In addition one or two site specific parameters relating to fire frequency were calibrated for each individual site. The model was spun up for a period of at least 5000 years to equilibrate isotope pools. Atmospheric δ13C and δ14C concentrations were varied annually to incorporate the Seuss effect and bomb pulse C. The modified model was able to describe the variation across sites in terms of C, N, δ13C and δ14C reasonably well but with some exceptions. Simulated NPP was close to estimates obtained independently from remotely sensed data. Following model calibration, climate change scenarios were run for 70 years in the future to assess the sensitivity of the tree-grass-soil system to future climate and increasing atmospheric CO2.
Key Words
Isotope, atmosphere, NDVI, transpiration
Introduction
Sandy soils with less than about 10% clay content cover aproximately one third of Australia and a further one third of Australia has soils with less than 20% clay in the surface. Many of these soils occur in arid and semi-arid regions although smaller areas occur in more mesic locations. Sandy soils are not widely used for agriculture and light grazing is the predominant land use. The vegetation on these soils ranges from tropical rainforest with no grassy understorey to arid spinifex (Triodia Spp.) pastures with few trees. Fire regimes range from nearly annual to almost total absence of fire. Understorey species range from almost pure C4 in hot arid regions to pure C3 in cold wet environments. Net primary production (NPP) is
estimated to range from about 50 to 1000 gC/m2/year and soil carbon stocks range from 500 to 10000 gC/m2 to a depth of 30 cm. These carbon stocks both above and below ground are potentially vulnerable to management and climate change because of low nutrient status and low protection of organic matter by clay minerals. Modification of fire regimes may allow N limited systems to gradually accrete or lose carbon in above and below ground pools and change the tree grass balance. The amount of grass or trees in any region is a function of disturbance (frequency and intensity) and the relative competitiveness of trees and grasses at any level of potential growth as determined by water availability and fertility. The balance of trees and grasses is critical when investigating C stocks under global change. Increasing or decreasing tree density in savanna systems can make large changes in above ground carbon stocks in these systems. Our aim is to simulate carbon, carbon isotope and nitrogen stocks and NPP (following the example of Jenkinson et al. 1999) over a range of environments and to develop as far as possible a generalised set of parameters that has applicability over the sandy soils of Australia.
Methods
Field Sampling Methodology
away from trees ("tree" and "grass" samples). The average percentage canopy cover, measured at each sampling location, was used to apportion the representation of tree and grass samples. At each of the 31 regions, a total of 200 soil cores were collected according to the following protocol. Five transects were established at least 1 kilometre apart within a region of a given soil type and narrow climatic variability. Along each of the 5 transects, a total of 5 locations were sampled, each at least 100 m apart. At each of these locations, a total of 8 soil cores were taken at two depth intervals (5 and 30 cm) from 4 types of sampling position. One 30 cm deep core was taken from both a tree and a grass position and 5 cm deep cores were also taken from three tree and grass positions. Each group of three cores was bulked to make two 0–5 cm samples. This sampling regime produces two 0-30 cm and two 0-5 cm samples from each location, totalling 20 samples from each transect and 125 samples from each region. Sand content (<63 µm) in the samples ranged from 80% to 99%. Rainfall across these regions ranged from 133 to 1850 mm/year and annual average temperature from 12.2 to 27.9 °C. While the data set covers a range of climates it is biased towards wetter locations. The average annual rainfall for the set is 876 mm while the continental average is about 450 mm. As sites were not representative of the average for sandy soils a weighting value was determined for each site based on its representativeness of sandy soils in rainfall and temperature space.
Sample Preparation and Analytical Methodology
A series of 24 bulked samples from each region was used in the analyses. Four “bulk-bulk” (-BB)
samples were prepared for each sample type: 0-5 cm tree (5T), 0-5 cm grass (5G), 0-30 cm tree (30T) and 0-30 cm grass (30G). Each of these samples contains 1/25th of the specified sample type from the 25 locations of that type within the region. Twenty “single-bulk” (-B) samples represent the averages of the four sample types (5T-B, 5G-B, 30T-B, 30G-B) over 5 transects, each containing 1/5th of the sample from the 5 locations within each transect. Measurements of any soil property in the -BB samples were considered to represent the mean value for the region, while an estimate of the spatial variability of the property can be determined from the variability evident in the 5 -B samples from each transect. Mass concentration of solids (or “dry bulk density”) for each of the 4 -BB samples, and 20 -B samples from each region was determined based on the average of all individual samples of that type. Organic carbon concentration of the -BB samples was measured manometrically after combustion to CO2 and cryogenic
purification. The stable carbon isotope ratio of CO2 produced by combustion was measured by dual-inlet
mass spectrometry. All stable isotope measurements are reported in standard δ-notation with respect to the VPDB scale. Carbon concentrations and stable carbon isotope ratios of -B samples were measured using elemental analysis-continuous flow mass spectrometry at the Australian National University. For each of the 31 sand soil regions, -BB samples of tree and grass samples from the 0-30 cm depth interval were mixed in proportion to the canopy cover (a “bulk-bulk-bulk” -BBB sample) and analysed for C-14 activity by conventional radiocarbon methods. Radiocarbon measurements are reported in δ-notation with respect to Oxalic Acid standard.
Carbon model and Optimisation
A version of Century version 4.0 (Parton et al. 1992), was customised in the following ways: vegetation δ13C and δ14C was modified by changes in atmospheric concentrations; radioactive 14C decay was added
to the model, charcoal from grass and litter burning was moved directly into the slow pool; isotopic fractionation of charcoal from C4 grasses was simulated (Krull et al. 2003); N mineralisation was
δ13
C of woody vegetation was estimated from the relationship demonstrated by Miller et al. (2001) but constrained at high rainfall to a minimum value of –29.0. The isotope ratio for the ground layer was based on the measured δ13C ratios with the proportion of C4 contributing to the δ13C ratio based on
modifications of the relationships devised by Hattersley (1983) and from other published sources e.g. Bowman & Cook (2002). Atmospheric CO2 was set to 280 ppm before 1890 and transitioned in a linear
manner to 370ppm in 2004, or 586 ppm in 2070 SRES92a (IPCC 1996). Atmospheric δ13C concentration was estimated from an equation fitted to data from Cape Grim (Francey & Allison 1998) and the Sipple ice core (Neftel et al. 1994). Annual atmospheric δ14C data for the southern hemisphere was taken from the INTCAL98 radiocarbon age calibration data set (Stuiver et al. 1998) and the high-precision
radiocarbon age calibration for terrestrial and marine samples data set (Stuiver et al. 1998).
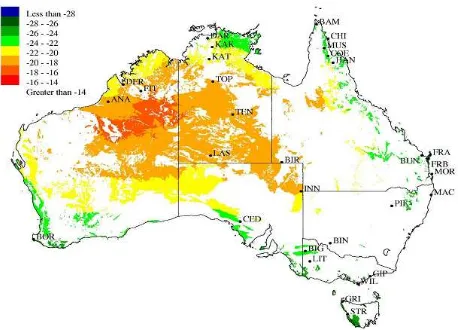
Figure 1: Sampling site locations and map of sandy soils showing estimated δ13C interpolated as a function of average vapour pressure deficit (VPD).
For three sites (LAS, INN and BIR) it was necessary to include an estimate of wind erosion, and drainage was constrained in several sites (GRI, GIP, DAR) as no sensible combination of parameters could
reproduce carbon stocks at these sites. Field notes and photographs supported the assumptions made. Accurate estimates of parameters, such as degree of saturation, could conceivably be obtained from remote sensing but are not yet available at the continental scale. As a result model estimates are somewhat better than could be expected from a simulation for areas without detailed site descriptions.
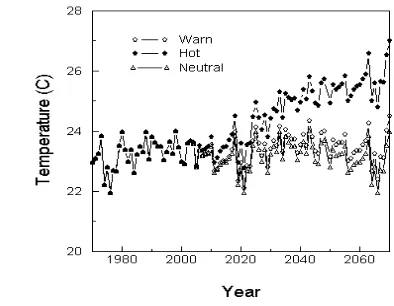
The weighting values, determined by representativness in temperature-rainfall space, were used in climate change studies to estimate average changes over all sandy soils in Australia. Daily rainfall climate from SILO (Jeffrey et al. 2001) was used to construct monthly climate data sets and calculate statistics for the generation of stochastic rainfall for use in the spin up period. Climate change scenarios (CSIRO, 2001) were generated for the period 2004–2070 using high and low estimates of rainfall and temperature for each region. The changes in temperature and rainfall were applied in a linearly increasing manner to a rolling sequence of measured 1970-2003 climate variables for each site for rainfall (Figure 2) and
temperature (Figure 3). Temperature changes were assumed to increase minimum temperatures more than maximum temperature (66% and 34% of increase respectively).
Figure 2: Average rainfall trends for climate change scenarios.
Figure 3: Average temperature trends for climate change scenarios.
Parameter optimisation
Total C, N, C:N ratio, NPP, δ13C and δ14C were estimated for each model run for each site and absolute errors were accumulated into a fitness score. Specific evaluations were made of the correlation of NPP to estimated annual average transpiration and long term mean NDVI. Multiple linear correlations were run for each site between leaf mass (grass and tree) and time series NDVI data from the Pathfinder series were added to the objective function. For C, N, δ13C and δ14C in global parameterisation, errors were weighted by the variance in the observed data where available. Because the dynamic range of errors was greater than 3 orders of magnitude (e.g. C vs. δ13C errors), scores were treated such as to give them approximately equal weighting to avoid undue weight being placed on parameters controlling estimation of total soil carbon stocks. Cross validation approaches are yet to be evaluated.
In total there were 124 soil chemistry observations, 31 estimates of tree canopy cover and 31 time-series of NDVI (of varying length due to cloud cover) used to automatically estimate 45 parameters, 14 of which are global (i.e. apply to all sites) and 31 of which apply a fire frequency at each site. Parameters optimised (identified by sensitivity analysis) included: maximum decay rate and maximum C:N ratio for material entering the passive pool; slope and intercept for N input as a function of rainfall; slope and intercept for optimum growth temperature for trees and grasses; tree temperature response when temperature was less than optimum; slope and intercept for site potential for grass production as a function of VPD; ratio of rain/potential evaporation below which there is maximum negative impact of soil anaerobic conditions on decomposition; the minimum ratio of available water to potential
Some parameters were not solved directly as model inputs but were estimated indirectly from external variables that were available spatially. Temperatures for optimum growth for trees and grasses were determined from regressions on temperature of the wettest quarter where slopes and intercepts were determined by optimisation. In addition to the automatically optimised parameters, a range of about 20 other parameters were manually adjusted. These parameters were associated with soil erosion, drainage and plant partitioning. Additionally model NPP was compared to NPP estimates derived from an empirical function of NDVI (Prince 1991).
Results
Model Calibration
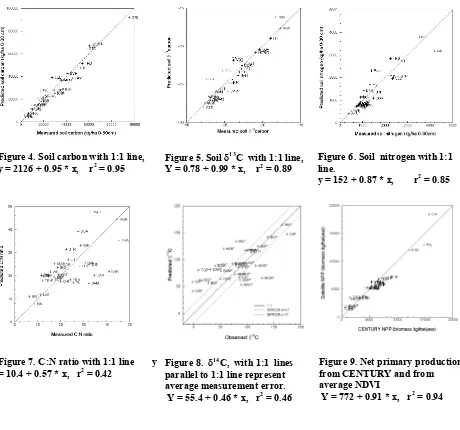
The model calibration results show that the global set of parameters could be found which explained a high proportion of the variation between sites in soil carbon (Figure 4), N, δ13C, estimated NPP and to a lesser extent C:N ratio and δ14C.
Carbon 13 isotope and tree-grass competition.
The model simulates δ13C adequately (Figure 5) at most sites indicating that the ratio of inputs from trees and grasses for northern Australia is correct. Several sites (KAK, COE) are apparently less grassy (with C4 species) than indicated by the model and it is difficult to obtain a set of parameters to explain these
data. In these cases trees may be accessing significant deep soil water that is not available to the grasses.
Nitrogen stocks and C:N ratios
Nitrogen is moderately well simulated. The modelled mean for all sites is close to the simulated mean and overall there is a 1:1 relationship between observed and predicted values (Figure 6). However there are considerable discrepancies at individual sites. Inputs from legumes, pH, and losses from leaching and fire may account for some of these anomalies. The sand islands (FRA, MOR) on the coast of Queensland showed the highest C:N ratios (~45) and desert sand dunes (BIR, INN) showed the lowest C:N ratios (~6). The sites WIL and STR have lower simulated N than measured N for reasons that are not readily apparent. The range of C:N values (Figure 7) matches the observed range. However, in general C:N ratios are poorly simulated. Input of N from atmospheric sources (wet and dry deposition) is a key model input and control on NPP. Using optimised parameters and Australian average rainfall the mean continental atmospheric N input is estimated at 3 kg/ha/year.
Carbon 14 Bomb Pulse
The model significantly underestimated 14C at a number of sites with GRI and GIP being the worst outliers (Figure 8). At these sites there is almost no incorporation of bomb pulse carbon into the top 30 cm of the soil profile. To account for this both C input and decay rates of biomass would need to be much lower than suggested by the model, or alternatively, the proportion of vegetation decaying directly to CO2
rather than passing through the soil needs to be much higher.
NPP Estimates
Figure 4. Soil carbon with 1:1 line, y = 2126 + 0.95 * x, r2 = 0.95
Figure 5. Soil δ13C with 1:1 line, Y = 0.78 + 0.99 * x, r2 = 0.89
Figure 6. Soil nitrogen with 1:1 line.
y = 152 + 0.87 * x, r2 = 0.85
Figure 7. C:N ratio with 1:1 line y = 10.4 + 0.57 * x, r2 = 0.42
Figure 8. δ14C, with 1:1 lines parallel to 1:1 line represent average measurement error. Y = 55.4 + 0.46 * x, r2 = 0.46
Figure 9.Net primary production from CENTURY and from average NDVI
Y = 772 + 0.91 * x, r2 = 0.94
Discussion
Demonstrating that a model can be calibrated to a number of different variables simultaneously with a largely generic parameter set is a strong test of model functionality. Stable parameter sets were usually obtained in 300-500 model iterations. However one set of stable parameters does not preclude other sets of parameters (or model formulations) that are nearly as effective in reducing error but that are more realistic. C and N at all sites are not likely to be easily explained without a priori knowledge of local conditions and other nutritional limitations. Sites on sand islands off the coast of Queensland are an example (FRA, FRB, and MOR). C stocks are likely to be determined by age and leaching of nutrients such as P. While the CENTURY model caters for both leaching and phosphorus it is not easy to calibrate the model and invoke model runs of several hundred thousand years. Instead parameters such as fire regime are modified by the optimisation procedure to explain the properties of these locations.
Fire Frequency
The mean pre-European fire interval for our sites (with the exception of rainforest sites CHI and FRB) was 9.9 years between fires compared to a mean fire interval of 8.4 years estimated by Walker et al. (1981) for the same locations. There is accumulating evidence that in many parts of Australia fire frequency is declining due to fragmentation of fuel resulting from land development, and a reduction of fuel due to grazing.
Climate change impacts
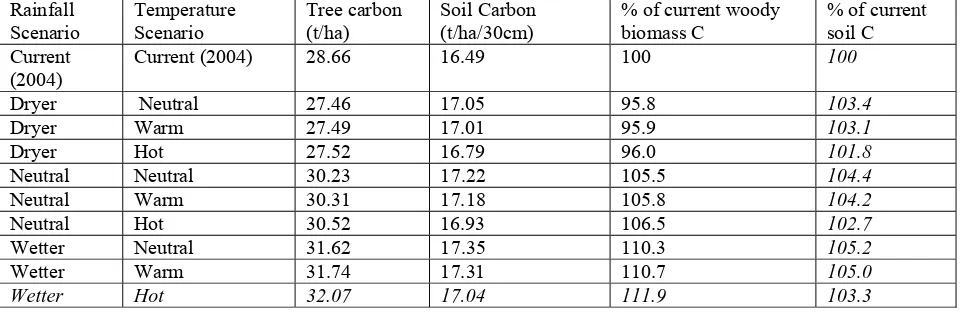
The change in carbon stocks (derived from the weighted change from each individual site) from the present day to 2070 over a range of climate scenarios (Table 1) suggests small increases in soil C stocks (~4%) and small losses in woody biomass carbon under drier conditions but accretion under wetter or neutral conditions with the assumption of no change in fire frequency or severity. It is possible that CO2
fertilisation is providing some gains in vegetation and soil carbon as the model predicts increases in C stocks of about 5% with no climate change (neutral) conditions. Nitrogen availability may well be limiting response to increased CO2. While the changes are small, the areas are large (one third of the
continent) and a 1 tonne per hectare change in carbon stocks on sandy soils translates roughly to a change of 250 Mt in C stocks over the next 67 years. Simulations of δ14C values suggest that C stocks have longer turnover times and are probably more stable than model simulations of δ14C values would suggest.
Table (2) Projected changes in woody biomass carbon and soil carbon in Australian sandy soils (0-30cm) under a range of climate change scenarios and CO2 fertilisation.
Rainfall
The great diversity of sandy soils, vegetation and climate is a significant modelling challenge. Parameterisation under multiple constraints increases the likelihood that parameters on average are correct and the model is robust over a diverse range of conditions. Simulations of climate change
scenarios and the impact of CO2 suggest that soil C stocks in sandy soils are relatively stable but there is a
risk of loss of vegetation carbon under drying scenarios.
Acknowledgments
Cooperative Centre for Greenhouse Accounting for support, Staff of the Research School of Earth Sciences, Australian National University for elemental and isotopic analyses, Lins Vellen for sample collection and preparation.
References
Agbu PA, James ME (1994) The NOAA/NASA Pathfinder AVHRR Land Data Set User’s Manual. Goddard Distributed Archive Center, NASA, Goddard Space Flight Centre, Greenbelt
Bowman DMJS, Cook GD (2002) Can stable isotopes (δ13C) in soil carbon be used to describe the dynamics of Eucalyptus savanna-rainforest boundaries in the Australian monsoon tropics? Austral Ecology27, pp.94-102.
Carroll D L (1996) Chemical Laser Modeling with Genetic Algorithms, American Institute of Aeronautics and Astronautics Journal., Vol. 34/2, pp. 338-346.
Francey RJ, Allison CE (1998) In situ 13 CO2 from Cape Grim, Tasmania, Australia: 1982-1993. In
‘Trends: A Compendium of Data on Global Change’. Carbon Dioxide Information Analysis Center, Oak Ridge National Laboratory, U.S. Department of Energy, Oak Ridge, Tenn., U.S.A.
Graetz RD, Skjemstad JO (2003) The charcoal sink of biomass burning on the Australian continent. CSIRO Atmospheric Research, Technical Paper No. 61.
Jeffrey SJ, Carter JO, Moodie KB, Beswick AR (2001) Using spatial interpolation to construct a comprehensive archive of Australian climate data. Environmental Modelling and Software16/4, pp. 309-330.
Jenkinson DS, Meredith J, Kinyamaro JI, Warren GP, Wong MTF, Harkness DD, Bol R, Coleman K (1999) Estimating net primary production from measurements made on soil organic matter. Ecology, 80(8), pp. 2762-2773.
Hattersley PW (1983) The distribution of C3 and C4 grasses in Australia in relation to climate. Oecologia, 57, pp. 113-128.
IPCC (2001) Climate Change 2001: The Scientific Basis. Contribution of working group 1 to the Third Assessment Report of the Intergovermental Panel on Climate Change. (Eds.) Houghton, J.T., Y. Ding, D.J. Griggs, N. Noguer, P.J. van der Linden, X. Dai, K. Maskell, and C.A. Johnson. Cambridge University Press, Cambridge, United Kingdom and NewYork, NY, USA.
Krull ES, Skjemstad JO, Graetz D, Grice K, Dunning W, Cook G, Parr JF (2003) 13C-depleted charcoal from C4 grasses and the role of occluded carbon in phytoliths, Organic Geochemistry, 34, pp. 1337-1352.
McVicar TR., Walker J, Jupp DLB, Pierce LL, Byrne GT, Dallwitz R. (1996) Relating AVHRR vegetation indices to in situ leaf area index. CSIRO, Division of Water Resources, Technical Memorandum, 96.5, Canberra, Australia, pp. 54.
Miller JM, Williams RJ, Farquhar GD (2001) Carbon isotope discrimination by a sequence of Eucalyptus
species along a subcontinental rainfall gradient in Australia. Functional Ecology15, pp.222-232. Neftel A, H. Friedle H, Moor E, Lotscher H, Oeschger H, Siegenthaler U, Stauffer B (1994) Historical
CO2 record from the Siple Station ice core. In: ‘Trends 93A: Compendium of Data on Global Change’.
(Eds.) Boden TA, Kaiser DP, Sepanski RJ, Stoss FW. ORNL/CDIAC-65 Carbon Dioxide Information Analysis Center, Oak Ridge National Laboratory, Oak Ridge, Tenn., U.S.A. pp. 11-14
Parton WJ, McKeown R, Kirchner V, Ojima D (1992) CENTURY Users' Manual, Natural Resource Ecology Laboratory, Colorado State University, Ft. Collins.
Prince SD (1991) Satellite remote sensing of primary production: comparison of results for sahelian grasslands 1981-1988. International Journal of Remote Sensing, 12(6), pp. 1301-1311.
Schimel DS, Braswell BH, Mckeown R, Ojima DS, Parton WJ, Pulliam W (1996) Climate and nitrogen controls on the geography and time scales of terrestrial biogeochemical cycling. Global
Biogeochemical Cycles, 10, pp. 677-692.
Stuiver M, Reimer PJ, Bard E, Beck JW, Burr GS, Hughen KA, Kromer B, McCormac FG, Plicht Jvd, Spurk M (1998) INTCAL98 Radiocarbon age calibration, 24,000-0 cal BP. Radiocarbon 40, pp. 1041-1083.
Stuiver M, Reimer PJ, Braziunas TF (1998) High-precision radiocarbon age calibration for terrestrial and marine samples. Radiocarbon40, pp. 1127-1151.