Published online in Wiley InterScience
(www.interscience.wiley.com) DOI: 10.1002/eco.15
Impacts of disturbance on soil properties in a dry tropical
forest in Southern India
Vishal K. Mehta,
1* Patrick J. Sullivan,
2M. Todd Walter,
3Jagdish Krishnaswamy
4and Stephen D. DeGloria
11Department of Crop and Soil Sciences, Cornell University, Ithaca NY 14853, USA 2Department of Natural Resources, Cornell University, Ithaca NY 14853, USA
3Department of Biological and Environmental Engineering, Cornell University, Ithaca NY 14853, USA 4Ashoka Trust for Research in Ecology and the Environment (ATREE), Bangalore 560 024, India
ABSTRACT
Grazing, fuelwood extraction and burning are common human activities in Indian forests. These activities can represent forest disturbances that drive the degradation of natural deciduous forest cover to scrub forest, with concurrent impacts on soils. The effects of human forest use on ecosystem functions were investigated inBandipur National Park (BNP)in Peninsular India. This paper reports the impacts on surface soils. Soils were sampled from 200 locations covering four watersheds within the Park. These samples spanned a degradation gradient measured by a field disturbance index (FDI). Soil physical, nutrient and hydraulic properties were measured. Cation exchange capacity (CEC) and saturated hydraulic conductivity (Ks) were analyzed as key response variables describing nutrient availability and infiltration respectively. Effects of cattle and jeep trails on infiltration and bulk density were evaluated by sampling on-and-off trails. Trail density in research watersheds was estimated with satellite imagery. Soil nutrient availability is negatively impacted by disturbance, resulting from negative impacts on soil organic carbon (SOC) and clay content. Available water capacity (AWC) and saturated moisture content (SMC) were significantly higher in protected watersheds, attributed to reduced clay content in degraded watersheds. Off trails, high spatial variability in infiltration overwhelmed any meaningful trends with disturbance. However, infiltration was substantially reduced on trails as a result of significant increase in bulk density. The density of trails was considerably higher in degraded watersheds compared to protected watersheds. These results provide ground-based and remotely sensed evidence that forest disturbance within the Park has negative impacts on soil organic matter, nutrient availability and hydraulic characteristics. These have consequences for related ecological, nutrient cycling and hydrological processes, and the continuation of the services currently enjoyed by local human populations. Copyright2008 John Wiley & Sons, Ltd.
KEY WORDS anthropogenic disturbance; ecosystem impacts; tropical dry forest; soils; India
Received 7 December 2007; Accepted 6 April 2008
INTRODUCTION
Indian forests in the Eastern Himalayan and Western Ghats regions are among the world biodiversity hotspots (Myers et al., 2000), in recognition of their high degree of biodiversity, endemism, and threats to the same. Much of India’s biodiversity is protected within a country-wide network of 593 wildlife reserves and national parks (Madhusudan, 2005). There are enormous anthropogenic pressures on these reserves from communities resid-ing both within and on the frresid-inges of these reserves. Over five million people have been estimated to reside within these reserves (Kothariet al., 1995). Indian forests have been used by communities over millennia for a variety of uses and activities (Lele and Hegde, 1997; Shankar et al., 1998a). Of these, livestock grazing, fuel-wood/fodder extraction, and burning represent historic and continuing uses of the forest (Banerjee, 1995; Bhat
et al., 2001; FAO, 2006b). At the same time, these activ-ities represent substantial pressures on the forest resource
* Correspondence to: Dr Vishal K. Mehta, 133D St. Suite F, Davis, CA 95616, USA. E-mail: [email protected]
base. Grazing livestock are quickly followed by fuelwood extraction. Once livestock graze and open up the vegeta-tion in an area, fuelwood collectors follow and cut down the standing woody vegetation. Annual low-intensity fires represent burning practices that continue today, usually to promote grasses that are used locally as fodder or house-hold articles (Saha, 2002; Kodandapaniet al., 2004). As a result, livestock grazing, fuelwood/fodder extraction and burning are recognized as ‘chronic disturbance’ (Singh, 1998) that can have substantial impacts on the entire for-est ecosystem— including impacts on vegetation (Tilman and Lehman, 2001), fauna (Bawa and Seidler, 1998; Ter-brogh, 1998), soils (Bruijnzeel, 2004) and hydrologic pro-cesses (Giambelluca, 2002; Bonell and Molicova, 2003). At regional scales there are possible links to climate change primarily through changes in radiative properties of replacement land cover (National Research Council, 2005).
et al., 2003; Kumar and Shahabuddin, 2005). Research is scarce on the impacts of degradation on soils (e.g. Sahani and Behera, 2001), or on soils as well as vegetation (e.g. Pandey and Singh, 1991). Existing research on the impacts on soils confirms the negative impacts of disturbance on clay content, organic matter and soil moisture (Pandey and Singh, 1991; Sahani and Behera, 2001). With the opening of the forest canopy, increased throughfall can increase the vulnerability of soils to erosion. Along with the actual removal of biomass, increased erosion also results in a net loss of nutrients and organic matter. Compaction due to trampling can increase the bulk density and reduce infiltration, causing an increase in surface runoff and increased soil aridity. Impacts of disturbance on watershed-scale hydrology have not been investigated, being limited to controlled deforestation/afforestation experiments in small, humid headwater watersheds (e.g. Sikkaet al., 2003). Similarly the Indian literature is scarce on the impacts of trails, another land use to be commonly found in forests. Trails inside forest areas, both those maintained and used by Forest Departments as well as those created by livestock, can substantially alter soils and hydrologic processes. Field experiments on unpaved roads in tropical forests of southeast Asia have demonstrated that they effect stream flow by generating Hortonian overland flow on the road surface (Ziegler et al., 2000), with
varying effects on watershed stream flows (Cuo et al., 2006).
There are virtually no investigations on the impacts of disturbance on soils, vegetation and hydrology together. This research addresses this knowledge gap in a decidu-ous forest in the Bandipur National Park (BNP), India. Two companion studies report the impacts on vege-tation (Mehta et al., 2008, this issue), and watershed scale hydrology (Krishnaswamy, personal communica-tion). This paper reports the impacts of forest disturbance on surface soil properties (physical, hydraulic and nutri-ent) in BNP, India. The objectives of the present study were:
1. To investigate key soil characteristics (physical, hydraulic, nutrient) along a degradation gradient: How are these characteristics related to degradation? 2. To compare key soil characteristics (physical,
hydraulic) on and off trails, and estimate trail densi-ties within research areas: How do trails impact these characteristics?
STUDY AREA
Location and biogeographic region
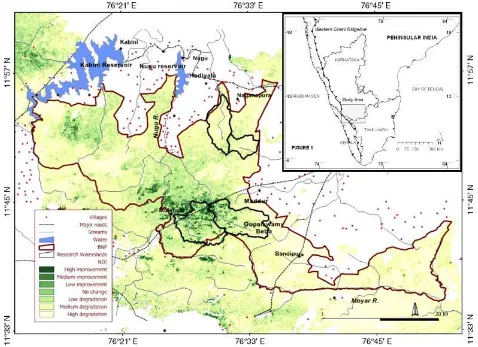
The study area is located in dry tropical forests within four research watersheds in BNP (Figure 1). The BNP
(Longitudes 76°120
E– 76°530
E, Latitudes 11°350
N– 11°580
N) is in the state of Karnataka in Peninsular India. The Park, approximately 874 km2 in area, is located lee-ward of the Western Ghats mountain range and is a biodiversity hotspot (Figure 1, inset). It is home to 17 critically endangered, endangered and vulnerable plant and animal species (2001 International Union for Con-servation of Nature (IUCN) Red List, www.redlist.org), and is one of the Project Tiger conservation areas in the country. The Park supports high densities of large herbivores including the gaur (Bos gaurus), the Asian elephant (Elephas maximus), and large carnivores such as the tiger (Panthera tigris),leopard (Panthera pardus) and dhole (Cuon alpinus). BNP lies in the sub-humid transitional zone between the humid high elevation back-slopes of the Western Ghats and the semi-arid Deccan plateau interiors (Bourgeon, 1989 p 37– 56). Elevations in BNP range from a low of 700 m on the western bor-der, to a maximum of 1450 m at Gopalswamy Betta in the central portion of the park. The topography is gen-tly undulating except for the Moyar river gorge on the south-east border. Drainage is predominantly northward and eastward. The only perennial rivers are the Kabini
andMoyar rivers.
Climate
The average annual rainfall ranges from 900 to 1200 mm within the Park (Pascal, 1982). The climate is tropical savanna, hot and seasonally dry (IMD, 1984). Mean min-imum and maxmin-imum daily temperatures are 15°C and
35°C respectively. The dry season extends from the end
of December to the end of March (Pascal, 1982; Devi-das and Puyravaud, 1995). Rainfall is trimodal, occurring as convectional pre-monsoon storms (March–May), the south-west monsoon (June – September) and the north-east monsoon (October–December), with most rainfall in October (Devidas and Puyravaud, 1995). Relative humidity is generally high during the south-west mon-soon (70%), and low (30%) from January to April in the
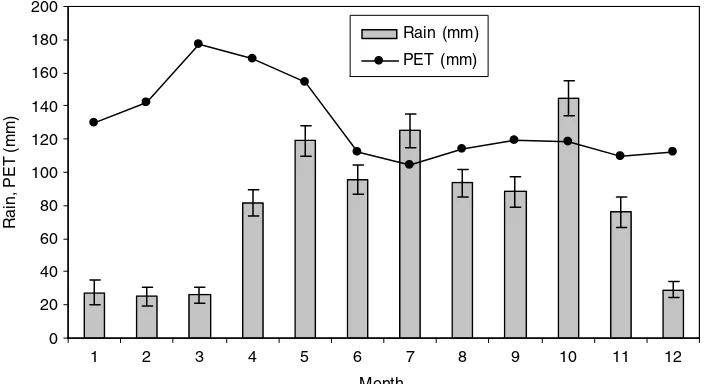
afternoons. Figure 2 shows the monthly rainfall for the
Bandipur station over 67 years, with annual average of 905š284 mm (meanš1 s.e). Annual potential evapo-transpiration (PET) is approximately 1550 mm. Rainfall frequency analysis was conducted using the 67-year daily rainfall record and the intensity-duration-frequency rela-tionship derived for southern India, listed in Kothyari and Garde (1992).
Geology and soils
Soils data were assembled from a variety of published sources to establish the best understanding possible of the baseline soil properties and their spatial distribution in the study region. The BNP falls in the granite-gneiss complex of the Archaean (Peninsular gneiss) group, the chief rocks being gneisses, granites and charnockites. On the basis of coarse scale soil maps of the region (Bourgeon, 1989; Shiva Prasad et al., 1998), soils in the research watersheds are alfisols (U.S. Department of Agriculture (USDA) classification) between 1 and 1Ð4 m deep with ustic soil moisture regime, with minimum horizonation (haplic), and are well drained. Published data on several soil profiles that fall within or in close proximity to our research watersheds (Ferry, 1994 p 190– 193) reveal that surface soils are generally sandy clay loam with underlying argilic horizons of high to medium base saturation (BS) and coloured deep red with iron oxides. Soils are moderately acidic (pHKCl ¾5Ð3), with a cation exchange capacity (CEC) of approximately 20 cmol/kg, BS above 70% and minimal Al, Mn acidity.
Vegetation
On the basis of extensive ground surveys, satellite data and bioclimatic maps of the Western Ghats, veg-etation in BNP has been classified as dry deciduous woodland to savanna woodland forests of the Anogeis-sus latifolia-Tectona grandis-Terminalia tomentosa type (Pascal, 1982). Most researchers in the area believe that the current vegetation represents degraded stages of
0
succession, varying from a savanna-woodland to low-discontinuous thickets. Intense overgrazing and lopping of branches has been theorized to convert the tree savanna into ‘clump thickets’, with the selection of thorny and unpalatable species (Pascal, 1988 p 291– 293). These ‘clump thickets’ and stunted scrub forests can be found extensively along the northern and eastern boundaries of BNP. Grasses belong predominantly to theCymbopogon
and Taeremides sp. Grass heights and cover are notice-ably low and sparse in the degraded northern borders of the Park. The Park falls within a region of the Western Ghats, which recent studies have shown are undergoing rapid forest cover losses.
Community and land use
Unlike many other protected areas in the country, there are no human settlements within the boundaries of BNP (Madhusudan, 2005) and all anthropogenic pressures—primarily livestock grazing and fuelwood removal—on the park originate from the villages along its northern flank. Over 100 000 cattle from nearly 180 villages graze in the buffer zone of BNP’s north-ern fringes (Lal et al., 1994). The current density of livestock along the northern boundary is estimated as 236 animals/km2 (Madhusudan, 2005). The immediate communities on the park boundary closest to the (north-ern) research watersheds include six villages and tribal hamlets. Of the 758 households, 455 own landholdings averaging less than 2 hectares per household (data cour-tesy of Dr S. Lele,Centre for Interdisciplinary Studies in Environment and Development (CISED)). Cattle grazing and fuelwood collection occurs within protected forest areas, while small scale farming is practiced just out-side park boundaries. Until recently, this use of the forest could be qualified as subsistence use with local village communities as the consumers. However, Madhusudan (2005), in a study on the impact of grazing on vegetation in BNP, has documented the intensification of grazing practices since the 1990s, linked to the export of cattle dung as manure to the neighbouring coffee growing dis-trict. This demand for dung from a non-local source, in turn driven by global coffee markets has converted cat-tle dung from a local subsistence agriculture resource to a commercial export to neighbouring coffee estates. As a result, the pressure on the northern boundaries of the Park has substantially increased in the last decade.
MATERIALS AND METHODS
Sampling framework
Sample locations were nested within four watersheds in BNP that had been previously identified and instru-mented for a study on the impacts of forest degradation on rainfall-stream flow response (Krishnaswamy et al., 2006). A degradation index based on satellite imagery derived vegetation indices— the change in Normalized Difference Vegetation Index (NDVI) between 1973 and 1999— served as the basis of watershed selection in pro-tected and degraded parts of BNP. See Krishnaswamy
et al. (2006) for details. Figure 1 shows the NDVI-based change classification map for BNP and the research watersheds within which samples were collected. Table I summarizes the characteristics of the four watersheds.
A 1 kmð1 km grid was laid over the entire park and five grids were randomly selected for each of the four watersheds. Surface soil sampling, infiltration tests and vegetation sampling were conducted at 10 locations within each grid for a total of 200 samples. Using a topo-graphical sheet (Survey of India (SOI); 1:50 000 scale) of the area and a GPS unit, we used a four-wheel-drive jeep to travel to each grid on cattle or jeep trails. Each sample location was selected at random distances on either side of the trails that intersected any part of the selected grid subject to considerations of safety. Among other wildlife, elephants or signs of elephants were encountered at 150 of the 200 locations, and a tiger was spotted on two occa-sions. These considerations prevented us from venturing more than 500 m away from the access trails within the forest. Samples were collected in the post-monsoon sea-son, between November 2005 and March 2006.
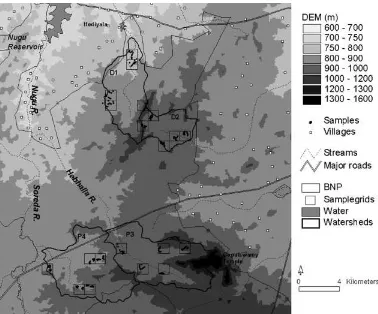
For the trails campaign, 20 locations on either jeep or cattle trails were chosen, for each of which off-trail measurements were made approximately 50 m away inside the forest. These 40 locations spanned the gen-eral region of the study watersheds. The impacts of jeep and cattle trails were not separately quantified primarily because jeep trails, especially in northern watersheds, are frequently used by cattle and herders. Figure 3 shows the Digital Elevation Model (DEM) of the research watersheds with the selected grids and sam-ple locations overlaid. The DEM (90 m resolution) source for this dataset was the Global Land Cover Facility (http://www.landcover.org). Also marked are the loca-tions of villages digitized from SOI topographic sheets showing their high density along the BNP boundary.
Table I. Characteristics of research watersheds.
Watershed Elevation (m) Slope (degrees) Topographic indexa
(area, km2)
Mean Median Range Mean Median Range Mean Median Range
Hebhalla (41Ð8) 1029 991 892–1450 8Ð8 6Ð1 0–45 8Ð0 7Ð7 5Ð0–16Ð7 Hediyala (27Ð7) 872 824 757–1124 5Ð5 3Ð7 0–40 8Ð6 8Ð1 4Ð9–17Ð6 Muntipur (14Ð2) 954 950 901–1042 4Ð7 4Ð3 0–25 8Ð4 7Ð9 5Ð7–16Ð8 Soreda (41Ð4) 918 911 840–1107 5Ð1 4Ð3 0–33 8Ð4 8Ð0 5Ð6–16Ð7
Figure 3. Research watersheds and sample locations. Watersheds are: (D1)Hediyala; (D2)Muntipur; (P3)Hebhalla; (P4)Soreda.
Sampling methods and laboratory analysis
Undisturbed soil samples were collected from the surface using steel soil cores of 2 cm diameter and 2 cm height. These samples were used to calculate bulk density and volumetric moisture content. In addition, a composite dis-turbed sample was taken from the surface soil using a Hoffer soil sampler (Ben Meadows Co., Janesville WI) from five locations within 1 m radius of the undisturbed sample. These samples were air-dried and analyzed for texture, CEC, exchangeable bases, soil organic carbon (SOC) and pH. Infiltration tests at each of the 200 loca-tions were conductedin situ using a constant head mini-disk infiltrometer (Zhang, 1997) to measure the hydraulic conductivity at 0Ð5 cm suction (Decagon Devices Inc., Pullman WA). Johnsonet al. (2006) used this device in a similar fashion in headwater basins in the Brazilian Ama-zon, interpreting the measurements as saturated hydraulic conductivity since a suction of 0Ð5 cm (0Ð05 kPa) is indis-tinguishable from saturation on a soil water character-istic curve. A suction of 0Ð5 cm corresponds to matrix flow in pore sizes less than approximately 6 mm. In this study, the mini-disk infiltrometer measurements at 0Ð5 cm suction are considered to correspond to near-saturated hydraulic conductivity accounting for all but the largest macropores, and are reported as KS.
Observations of the field disturbance in the plot were recorded and combined into a Field Disturbance index (FDI). The FDI comprised of presence/absence (1/0) observations of five indicator variables: (i) T - trails (cattle or jeep); (ii) C cut and/or broken stems; (iii) D
-cattle dung; (iv) P - people; and (v) F- fire. For each plot, FDI was calculated as FDIDTCCCDCPCF. The choice of indicator variables was informed by literature concerning anthropogenic impacts on vegetation ecology in Indian forests (Shankar et al., 1998b; Kumar and Shahabuddin, 2005).
For the trails campaign, undisturbed surface soil samples were taken at the 20 on-trail and 20 off-trail samples using steel cores of 2 cm diameter and 2 cm height. These samples were used for calcu-lating bulk density. Infiltration was measured using two instruments. Five measurements of Ks using the
mini-disc infiltrometer were taken at each location and averaged. One measurement at each location was also taken with the CSIRO Disc Permeameter (Com-monwealth Scientific and Industrial Research Organi-zation, Australia)— these are reported as Kcsiro. The
CSIRO Disc Permeameter measurements (Kcsiro)
incor-porate the influence of soil matrix as well as macro-pores, whereas the mini-disc infiltrometer measured
Ks is mainly influenced by the soil matrix. Given
The density of trails in research watersheds was esti-mated using a 5 m resolution Indian Remote Sens-ing Satellite (IRS-P6) LISS 4 satellite image (dated 6 May 2005) of the study area. The trails in research watersheds, visible on the satellite image, were mapped by on-screen digitizing after georeferencing the image using IDRISI Kilimanjaro Geographic Information Sys-tem (GIS). Where obscured by cloud cover, or in some cases not as clearly visible due to canopy cover, GPS readings, SOI maps and a 24 m resolution IRS LISS3 image from 27 February 2006, were used to complete the trails mapping. Trail widths, especially for jeep trails, are fairly uniform. Fifteen measurements of trail widths were taken in different parts of BNP to estimate an aver-age trail width.
Laboratory analysis
Soil analyses were performed by Mamatha Analytical Laboratory in Bangalore, India. Soils were air-dried and sieved through a 2 mm sieve before analysis. Soil sam-ples were analyzed for pH (1 : 1 in water and 0Ð01 M
KCl), 1 M KCl-exchangeable acidity and Al using NaF
titration (Thomas, 1982). CEC was measured using pH 7 buffered ammonium acetate (Chapman, 1965). Cations (Na, K, Ca, and Mg) were extracted using the buffered solution and analyzed by atomic absorption spectropho-tometry. CEC determination at buffered pH can be an overestimate due to pH dependent charges especially in soils high in organic matter and low in pH (Skinneret al., 2001). At low pH (<5Ð5), Al can also be exchange-able. The measured soil pH (1 : 1 water) was only mildly acidic (Table II). The pH of 183 of the 200 soil samples was above 5Ð5. The measured KCl-acidity was also very low (mean of 0Ð07 cmol/kg). Hence CEC is reported as analyzed using buffered pH. BS is the sum of exchange-able base cations divided by CEC. SOC was analyzed using the modified Walkley– Black method (Walkley and Black, 1934; Allison, 1960). Texture was determined using the pipette-gravimetric method. Bulk density was measured using the intact soil cores. Wet weights were measured before drying the soils at 105°C until the dry
weight stabilized in 2 to 3 days. Bulk density and volu-metric moisture contents were calculated. The soil-water characteristic curve for 58 of the 200 surface soils was determined using pressure-plate apparatus (Soilmoisture Equipment Corp., Goleta, CA, USA) at the National Insti-tute of Hydrology in Belgaum, India.
Data analysis
All analyses were conducted using R statistical software (R Development Core Team, 2006). CEC and infiltration were analyzed as key response variables. CEC was chosen as it is an important soil property describing nutrient availability for plant growth. The saturated hydraulic conductivityKS, as measured by the mini-disk
infiltrometer, was chosen to represent infiltration capacity of the soil matrix. The analytical approach consisted of building several general linear models (GLM) with a suite of soil covariates that could explain the variability in the response variable. Covariates included for model selection included those properties known from basic soil sciences to impact the response variable (Brady and Weil, 1999). For CEC, model covariates that were tested were pH, clay content and SOC. For Ks, bulk
density and clay content were tested. In both cases, terrain variables (elevation, slope and topographic index) were also included for model selection. The best model was chosen after step-wise addition of covariates with and without interaction. The relationship of significant covariates with FDI was then assessed. Hence any direct relationship between disturbance and the key response variables is interpreted through relationships of significant soil covariates with disturbance.
Spatial autocorrelation in the response variables was tested using Moran’s I statistic (Cliff and Ord, 1981). Two approaches were tested for handling spatial autocor-relation. First, a resampling procedure was used, wherein 1000 iterations of the linear models (LMs) were carried out, with only one sample randomly chosen from each grid for each iteration. With 20 data points per itera-tion, the different LMs were fit and diagnostics recorded for each iteration. The best model and corresponding
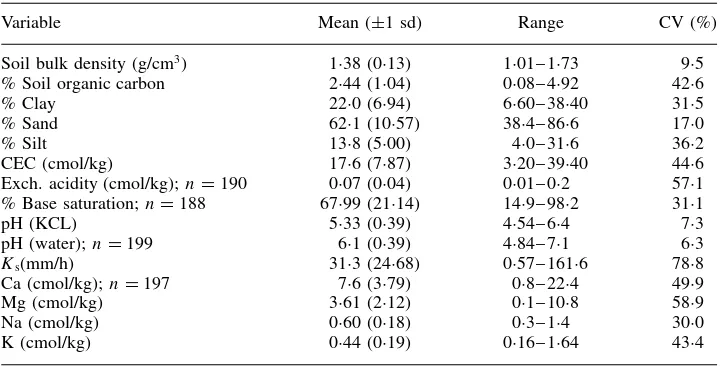
Table II. Surface soil characteristics.
significant covariates were selected on the basis of the mean performance of each model over the 1000 tests, using p-values of parameter estimates, Akaike Informa-tion Criteria (AIC) and AIC weights criteria (Akaike, 1973; Hobbs and Hilborn, 2006). The second approach was to explicitly model the spatial autocorrelation in the residuals using a weighted least squares (WLS) regression model, with the weight matrix taking on the structure of the covariance matrix of residuals (Kutner et al., 2004 p 421– 431). An omnidirectional, spherical variogram was used to model the covariance with sill and nugget param-eters of 20 and 0⊲cmol/kg⊳2 respectively and a range of 2000 m. Parameters from the WLS model were compared with a LM based on all 200 samples without accounting for autocorrelation, to determine the impact of autocor-relation. The best model selected from each approach, and respective model parameters were compared before a final model was adopted.
Soil properties were compared with FDI by treating FDI as a continuous variable, except when sample size was small, as was the case with available water capacity (AWC) and saturated moisture content (SMC). AWC and SMC, calculated from the soil moisture characteristics on 58 samples, were compared with disturbance by categorizing the 58 samples into two groups. This binary classification was based on K-means clustering of all 200 samples using the FDI indicator variables into two groups (‘degraded’ and ‘protected’). K-means clustering is a non-hierarchical method that produces a single partition optimizing within group homogeneity (Legendre and Legendre, 1998). Significant differences in AWC and SMC between samples from these two groups were determined using t-tests.
RESULTS
Field disturbance index
Cut and/or broken stems(C) were most frequently observed, in 55% of the plots. Jeep or cattle trails (T) were encountered in 40% of the plots. Signs of fire (F) were observed in 20Ð5% of the plots, cattle or cat-tle dung (D) in 15Ð5% and people sighted (P) in only four of the plots. The combined disturbance variable FDI itself ranged from 0 to 4, with no disturbance indica-tor observed in 29% of the plots, one indicaindica-tor observed in 27Ð5% of the plots, two indicators observed in 26%, three indicators in 16Ð5% of the plots and four indica-tors in only two of the plots. There were no plots in which all five indicators were observed. The livestock indicator (D) was probably under-counted, because the dung deposited by livestock inside the forest bound-aries is removed by herders and sold to coffee estates in the neighbouring district (Madhusudan, 2005). Simi-larly, people sightings (indicator P) were also probably under-counted because of the evasive behaviour of peo-ple who are illegally within the Park. The results were not affected by exclusion of this variable from the combined FDI disturbance index.
The distribution of FDI from the 50 samples in each of the four watersheds indicates that the two northern watersheds (D1 and D2, mean FDI of 2Ð26 and 1Ð98 respectively) are more degraded than the two southern watersheds (P3 and P4, mean FDI of 0Ð42 and 0Ð66 respectively). This was confirmed with K-means clustering performed on FDI. Cluster 1 (total samplesD113) contained 91 out of the 100 sites sampled in the two northern watersheds (D1 and D2). Cluster 2 (total samplesD87) contained 78 of the 100 sites sampled in the two southern watersheds (P3 and P4). As a result, the two northern watersheds were grouped together as ‘degraded’, and the two southern watersheds as ‘protected’.
Soil characteristics
Soils were mostly sandy clay loam (57% of the samples) with a mean clay content of 22%. According to USDA classification 29Ð5% of the soils were sandy loams. Soil colour was predominantly black or very dark grey. More than 50% of the samples were of yellow– red hue (10YR). Soil colour was more variable (lighter in value) in the more degraded northern watersheds. Surface soils in the more degraded watersheds were mostly of weak, fine granular structure, while in the more protected south-ern watersheds they were largely of moderate, coarse granular structure. Soil bulk density averaged 1Ð38 g/cm3.
The average SOC was 2Ð44% with a high coefficient of variation of nearly 43%. CEC averaged 16Ð64 cmol/kg, also with high variability. BS was moderately high at 67Ð99 cmol/kg. Soils were moderately acidic with an average pHKCl of 5Ð33 and low variability. The aver-age infiltration, as measured by Ks, was 31Ð3 mm/h.
Hydraulic conductivity was the most variable among the soil characteristics measured, with a coefficient of varia-tion of nearly 79%. See Table II for a summary of the soil characteristics. Unless otherwise mentioned in the table, the summary is for all 200 samples.
Soil nutrient availability
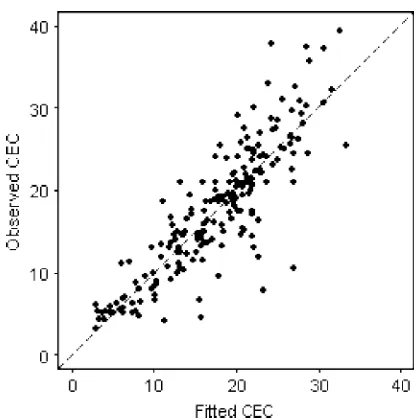
The effect of disturbance on nutrient availability was investigated with CEC as the key response variable. Figure 4(a) shows that CEC is negatively correlated with FDI (Pearson’s rD 0Ð58, p <0Ð05). CEC decreases with increasing disturbance levels. An explanation for this relationship can be found through the impacts of disturbance on soil covariates that directly impact CEC. In all three modeling procedures (resampling, WLS and LM), the final model that best captured CEC variation was an additive model with SOC and clay. Despite the data being spatially autocorrelated (based on Moran’s I statistic), there was no significant difference between model parameters determined by the WLS and LM procedures. Model coefficients (b0, b1, b2 respectively) were 2Ð73, 3Ð85 and 0Ð50 in the WLS model; and
Figure 4. Scatterplots of soil properties versus FDI. (a) CEC and FDI (b) Clay and FDI (c) SOC and FDI (d) SOC and Clay. Dotted lines are linear fits. Each point in a–d is the grid-averaged value (nD10). Error bars are 1SE.
effects of spatial autocorrelation on model results were not substantial and adopt the LM model below:
CECD 2Ð75C4Ð35ðSOCC0Ð43ðClay
The model was statistically significant (p <0Ð0001) and accounted for 75% of the variability in CEC over all 200 samples. Figure 4(b) and (c) shows that the significant covariates explaining CEC, i.e. SOC and Clay, are individually negatively correlated with FDI. Figure 4(d) also shows that SOC and Clay are positively correlated. Figure 5 shows the modeled and observed CEC. None of the modeling approaches included the terrain variables in the final set of significant covariates. We conclude that soil nutrient availability for plant growth is negatively impacted by disturbance, through the negative impact of disturbance on soil organic matter
D1 D2 P3 P4
Figure 6. Boxplots of hydraulic conductivity by watershed.
Influence on soil hydraulics: infiltration
The average hydraulic conductivity Ks was 31Ð3 (š
24Ð7 sd) mm/h, with the highest variability of nearly 79% (Table II). As is reported in the literature, hydraulic con-ductivity observations are usually positively skewed, and exhibit high spatial variability. Even discounting spa-tial autocorrelation, no soil covariates could adequately describe the variability in Ks. An additive model with bulk density and texture was significant at the 5% level but could account for less than 9% of the variability in
Ks. Bulk density was not significantly related to FDI either, the overall variability in bulk density being the lowest. Further, using an ANOVA model, no significant differences in Ks among the four watersheds could be
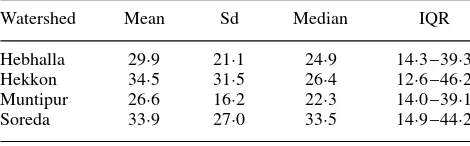
discerned. Figure 6 and Table III summarize theKs data
for each watershed. The data could not provide any sig-nificant evidence that surface infiltration is impacted by disturbance.
Influence on hydraulics: AWC and SMC
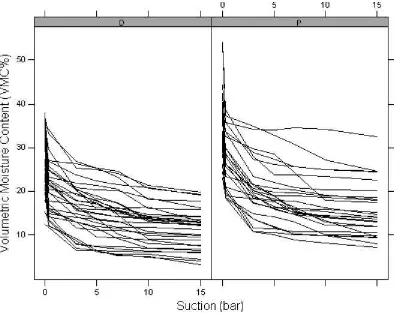
Fifty-eight of the samples were analyzed to determine soil moisture characteristics. Thirty-two samples were from the northern (relatively) degraded watersheds D1 and D2, and 26 samples were from the southern (relatively) protected watersheds. SMC, and AWC (computed as the difference between field capacity (0Ð3 bar) and wilting point (15 bar) moisture contents), were compared between the degraded and protected watersheds with a pooled variance two-samplet-test. AWC in the degraded
Table III. Summary of hydraulic conductivity by watershed.
Watershed Mean Sd Median IQR
Hebhalla 29Ð9 21Ð1 24Ð9 14Ð3–39Ð3 Hekkon 34Ð5 31Ð5 26Ð4 12Ð6–46Ð2 Muntipur 26Ð6 16Ð2 22Ð3 14Ð0–39Ð1 Soreda 33Ð9 27Ð0 33Ð5 14Ð9–44Ð2
Sd, standard deviation; IQR, Interquartile range. All values in mm/h. Sample sizeD50 per watershed.
watersheds (9Ð2% š 2Ð8% sd) was significantly less than AWC in the protected watersheds (11Ð1% š 3Ð3% sd) (p <0Ð001, tD 2Ð42, dfD56). SMC was also significantly less in the degraded watersheds (29Ð1%
š 6Ð9% sd) than the protected watersheds (35Ð3 š
7Ð5% sd) (p <0Ð009,tD 3Ð27, dfD56). Soil moisture characteristics, grouped by degraded (D) and protected (P) watersheds, are displayed in Figure 7.
Impacts of trails
Infiltration and bulk density.Table IV and Figure 8 sum-marize the results of trail measurements. A two-sample
t-test with unequal variances was conducted on the log transformed Ks data, which were slightly skewed. Log
transformedKs measured on trails was significantly less
than that off the trails (tD5Ð4, dfD37Ð62,p <0Ð0001). The Kcsiro data were more positively skewed. A two-sample t-test with unequal variances was performed on the log-transformedKcsiro data. Kcsiro measured on trails
was also significantly less than Kcsiro off the trails (tD
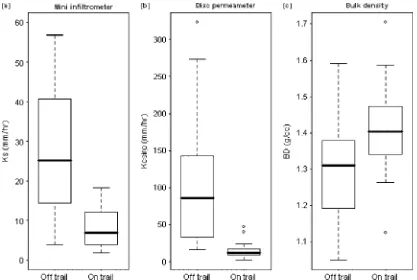
7Ð03, dfD35Ð7, p <0Ð0001). Reduction of infiltration on trails can be attributed to compaction. This hypoth-esis was tested by using bulk density as a measure of compaction. Figure 8 shows the boxplots of soil bulk densities on and off trails. A two-sample pooled vari-ance t-test was performed between the bulk densities of on-trail and off-trail samples. The bulk density of soils off the trails (1Ð29š0Ð13 sd) was significantly less than the bulk density of soils on the trails (1Ð42 š 0Ð13 sd), at the 1% significance level.
Together, the two instruments— the mini-infiltrometer and disc permeameter—capture both matrix and macro-capillarity related infiltration, respectively. Our results show that infiltration capacity at both scales is negatively impacted by trails, which are compacted. This observed difference in infiltration capacity will likely result in a pronounced difference in Hortonian overland flow gen-eration. For example, on-trail infiltration capacities are approximately equal to the 1-year, 7-h rainfall intensity (¾8 mm/h) whereas the same duration storm corresponds to >100-year return period (¾30 mm/h) before the off-trail infiltration capacity is exceeded (Figure 9). In other words, 7-h rainfall events will cause the trails to gener-ate Hortonian runoff just about every year but will rarely result in Hortonian flow from the off-trail areas. We show below that trail density is also higher in degraded water-sheds, thereby increasing the chances and contribution of Hortonian flow in storm runoff events.
Figure 7. Soil moisture characteristics for 58 samples DDdegraded⊲nD32⊳; PDprotected⊲nD26⊳. Table IV. Infiltration measurements on and off trails.
mm/h On trails (nD20) Off trails (nD20)
Mean (sd) Skew Median IQR Mean (sd) Skew Median IQR
KS 8Ð1 (5Ð1) 0Ð75 6Ð9 3Ð9–11Ð5 27Ð9 (15Ð9) 0Ð15 25Ð3 15Ð3–39Ð3
Kcsiro 15Ð3 (10Ð9) 1Ð8 12Ð2 8Ð9–16Ð7 101Ð6 (84Ð9) 1Ð3 86Ð1 33Ð6–138Ð0
watershed P4, cattle trails were practically non-existent. The northern watersheds taken together had a greater pro-portion as well as greater length of cattle trails by far, compared to the southern watersheds. The average trail width was 4Ð51 m (š0Ð57 m sd). Assuming an average width of trail of 4Ð5 m, the maximum density of trails (in D1 watershed) is estimated as 1Ð8% of watershed area. The density of trails was highest in the northern water-sheds.
DISCUSSION
In BNP, forest disturbance, quantified as a combined impact of grazing, fuelwood/fodder extraction and fire, has a negative effect on soil nutrient availability through reduction of clay content and soil organic matter of surface soils. No significant effect was discerned on hydraulic conductivity and bulk density within forest areas off the trails. Disturbance also significantly reduced SMCs and AWC. Compaction on trails significantly increases bulk density, thereby strongly and significantly
reducing infiltration through both micro and macropores. The density and total lengths of trails were much higher in the northern, more degraded watersheds. In Hediyala
watershed, they covered nearly 109 km, approximately 1Ð8% of total watershed area.
Figure 8. Boxplots of measurements on and off trails (a)Ks; (b)Kcsiro; (c) Bulk density.
(1 : 50 000 scale). However, we ensured that our sampling strategy and data analysis accounted for terrain differ-ences. Research watersheds spanned the elevation and slope ranges typical of the entire Park, and within each watershed, selected grids spanned low and high eleva-tions (Figure 3 and Table I). Also, terrain variables were included as covariates in model building, but were not found significant.
No attempts were made to elucidate the contributions of individual disturbance indicators to our overall dis-turbance index FDI. Our goal was to define a collective index that accounted for multiple anthropogenic forest uses efficiently within reasonable constraints of time, budget and personal safety in the forest, while simul-taneously allowing the description of degradation as a continuous variable. Moreover, (i) the individual indices are not independent— once livestock graze and open up trails within the forest, fuelwood collectors quickly fol-low; and (ii) cattle dung is removed from the forest and is an economic resource —hence the indicator D alone would be compromisedrelativeto the others. Our results indicate that the indicator ‘P’ had little value in this study, given the evasive behaviour of non-authorized people in the forest. This variable may be useful in other protected forests where local people do have restricted access. The collective index FDI as formulated here seems to be a robust index in the context of the objectives of this study and specific region.
Implications for large scale impacts
Dry tropical forests account for approximately 60% of the Indian forest cover (WRI, 1996). The disturbance
described in this paper is representative of the pressures in dry tropical forests across India. Over two-thirds of India’s wildlife reserves are grazed by local livestock (Kothari et al., 1995), with the Forest Survey of India (FSI) estimating that about 77Ð6% of forest area of the country is affected by grazing of varying intensity (FAO, 2006a,b). Existing studies in other National parks in India have shown similar results as documented here. For example, forest disturbance has been related to decreases in CEC and SOC by Saikh et al. (1998a,b); clay con-tent (Pandey and Singh, 1991; Sahani and Behera, 2001) and soil moisture (Pandey and Singh, 1991). Placed in the larger context of widespread forest use, the find-ings of this local study and similar findfind-ings from other forested areas point towards potentially substantial and wide-spread impacts on several aspects of ecosystem processes—nutrient/biogeochemical cycling and hydrol-ogy in particular. The reduction in soil organic matter and nutrient availability documented in this study are evi-dence that biogeochemical cycling and soil carbon stocks are directly impacted by forest disturbance. Further evi-dence is provided by Madhusudan (2005) who details the impacts of the dung economy wherein cattle grazing inside the forest produce dung that is exported out of the forest resulting in continual removal of biomass from the ecosystem.
Figure 9. Rainfall IDF curves with infiltration capacity on and off trails. Off-trail data includes samples from both grid sampling and trail campaigns.
Sandstrom, 1995; Bonell and Molicova, 2003; Karambiri
et al., 2003). The resulting impacts on watershed scale water yields are challenging to quantify for a number of reasons (see Bruijnzeel (2004) for a relevant review, albeit more focused with controlled experiments on small watersheds in humid tropical forests). Not least of these reasons is the seasonal nature of stream flow as in the research watersheds characterized by zero dry season flow with stream flows events limited to a few during the wet season (Krishnaswamy et al., 2006). The great-est hydraulic impact documented in this study was due to trails. Whereas the mean hydraulic conductivity in the forests was documented as 31 mm/h, Ks on trails averaged only 8Ð1 mm/h; presenting clear evidence that the chances of overland flow due to infiltration-excess (Hortonian) flows are increased on trails. The 20Kcsiro
measurements off-trails also indicate that macroporos-ity is probably a major influence on forest soils infil-tration off the trails— mean Kcsiro is more than three
times mean mini-disc infiltrometer (Ks) measurements
(Table IV). Limited Kcsiro sample size prevents
gener-alization of macroporosity effects over the entire forest area. However, the Ks and Kcsiro results together
indi-cate that dramatically reduced infiltration and increased presence of trails in the more degraded watersheds can be expected to manifest themselves in storm-flow events in the form of greater proportion of quick flow caused by rapid, infiltration-excess overland flow (Bonell and
Molicova, 2003; Bruijnzeel, 2004) as has been docu-mented in south-east Asia (Ziegler et al., 2000; Cuo
et al., 2006). This hypothesis is borne out from the anal-ysis of several event hydrographs over 2 years in the research watersheds—stream flow events are ‘flashier’, i.e. contributions of quick flow are greater in the northern degraded watersheds compared to the southern, more pro-tected watersheds (Krishnaswamy, personal communica-tion). Increased event runoff accompanied by increased surface erosion are expected to be the most direct and locally relevant watershed scale impacts of forest distur-bance in the study area. Immediate local impacts on water resources are likely to be felt in the cultivated land on the northern boundaries of BNP, where an extensive network of surface irrigation schemes called ‘tanks’ supply irri-gation water for local agriculture. It is plausible that an increased sediment yield from the degraded watersheds would amount to a net negative impact on these water bodies, since runoff and sediment contributions from rel-atively small proportion of compacted trails and roads are often disproportionately high (Bruijnzeel, 2004).
Figure 10. Trails in (a) northern and (b) southern watersheds. Table V. Density of trails.
Watershed Length (km) Density (km1) % Cattle trail
D1 109 3Ð9 84
D2 44 3Ð1 68
P3 35 1Ð1 30
P4 45 0Ð9 <1
Ghats form the major watershed of Peninsular India. This is a region that has encountered substantial forest
cover loss and fragmentation (Menon and Bawa, 1998; Jhaet al., 2000; Amarnathet al., 2003). Interdisciplinary research on ecosystem functioning in the region, which includes energy, water and nutrient cycling, is neces-sary for a more comprehensive picture on local and regional ecosystem impacts of widespread forest distur-bance of the nature investigated in this paper. This paper describes the impacts on surface soils. Companion stud-ies describe the impact on vegetation ecology (Mehta
(Krishnaswamyet al., in preparation). These investiga-tions help set the stage for comprehensive research on the ecosystem impacts of forest disturbance in the Indian subcontinent.
ACKNOWLEDGEMENTS
This research was financially supported by grants from the International Foundation for Science (IFS, Sweden); Ford Foundation and UNESCO; and Cornell University’s Center for the Environment and the Bradfield Award. We thank The Karnataka Forest Department for research per-missions, and theAshoka Trust for Research in Ecology and the Environment (ATREE, Bangalore) for research and logistics support. The National Institute of Hydrol-ogy provided rainfall data and assisted with soil testing. Partial travel support was provided by Cornell Univer-sity’s Einaudi Center for International Studies, and the South Asia Program. We are grateful for assistance in field logistics from N. Samba Kumar and the Centre for Wildlife Studies, Bangalore. Our special thanks to the local field assistant, Mr Dasappa, driver Mr Umesh, and for research assistance from Kiran Yadav, Rakesh K.N. and Dr Pradeep Joshi.
REFERENCES
Akaike H. 1973. Information theory as an extension of the maximum likelihood principle.Second International Symposium on Information Theory. Akademiai Kiado: Budapest.
Allison LE. 1960. Wet-combustion apparatus and procedure for organic and inorganic carbon in soil. Soil Science Society of America Proceedings24: 36– 40.
Amarnath G, Murthy MSR, Britto SJ, Rajashekar G, Dutt CBS. 2003. Diagnostic analysis of conservation zones using remote sensing and GIS techniques in wet evergreen forests of the Western Ghats —an ecological hotspot, Tamil Nadu, India.Biodiversity and Conservation 12: 2331– 2359.
Banerjee AK. 1995.Rehabilitation of Degraded Forests in Asia,World Bank Technical Paper No. 270. The World Bank: Washington, DC. Bawa KS, Seidler R. 1998. Natural forest management and conservation
of biodiversity in tropical forests.Conservation Biology12(1): 46– 55. Bhat DM, Murali KS, Ravindranath NH. 2001. Formation and recovery of secondary forests in India: a particular reference to Western Ghats in South India.Journal of Tropical Forest Science13(4): 601– 620. Bonell M, Molicova H. 2003. A hydrological approach to tropical
forestation: controversial issues and possible applications of topographic-wetness models.Journal of Tropical Forest Science15(3): 411– 431.
Bourgeon G. 1989. Explanatory Booklet on the Reconnaissance Soil Map of Forest Area: Karnataka and Goa. Institut Francais de Pondicherry— India: Pondicherry; 96.
Brady NC, Weil RR. 1999.The Nature and Properties of Soils, 12th edn. Prentice-Hall, Inc.: Upper Saddle River, New Jersey; 881.
Bruijnzeel LA. 2004. Hydrological functions of tropical forests : not seeing the soil for the trees?Agriculture Ecosystems & Environment 104: 185– 228.
Chapman HD. 1965. Methods of soil analysis — chemical and microbiological properties. InAgronomy, Black CA (ed.) American Society of Agronomy: Madison WI, USA; 891– 901.
Cliff AD, Ord JK. 1981. Spatial Processes: Models and Applications. Pion Ltd.: London; 260.
Cuo L, Giambelluca TW, Ziegler AD, Nullet MA. 2006. Use of the distributed hydrology soil vegetation model to study road effects on hydrological processes in Pang Khum Experimental Watershed, northern Thailand.Forest Ecology and Management224(1– 2): 81– 94. Devidas S, Puyravaud JP. 1995. Primary productivity of the herbaceous layer in a grazed savanna woodland, Bandipur National Park,
southern India. Acta Oecologica-International Journal of Ecology 16(4): 491– 505.
FAO. 2006a.Global Forest Resources Assessment 2005 India Country Report #001. Food and Agriculture Organization of the United Nations: Rome.
FAO. 2006b. Global Forest Resources Assessment 2005. Progress Towards Sustainable Forest Management, FAO Forestry Paper 147 2006. Food and Agriculture Organization of the United Nations: Rome. Ferry B. 1994.Les Humus Forestiers des Ghats Occidentaux en Inde du
Sud. Institut francais de Pondichery: Pondicherry; 260.
Giambelluca TW. 2002. Hydrology of altered tropical forest. Hydrologi-cal Processes16(8): 1665– 1669.
Hobbs NT, Hilborn R. 2006. Alternatives to statistical hypothesis testing in Ecology: a guide to self teaching.Ecological Applications 16(1): 5–19.
IMD. 1984. Climate of Karnataka State. India Meteorological Department, Govt. of India: Bangalore; xxivC143.
Jha CS, Dutt CBS, Bawa KS. 2000. Deforestation and land use changes in Western Ghats, India.Current Science 79(2): 231– 238.
Johnson MS, Lehmann J, Couto EG, Novaes JP, Riha SJ. 2006. DOC and DIC in flowpaths of Amazonian headwater catchments with hydrologically contrasting soils.Biogeochemistry81(1): 45– 57. Karambiri H, Ribolzi O, Delhoume JP, Ducloux J, Coudrain-Ribstein A,
Casenave A. 2003. Importance of soil surface characteristics on water erosion in a small grazed Sahelian catchment.Hydrological Processes 17(8): 1495– 1507.
Kodandapani N, Cochrane MA, Sukumar R. 2004. Conservation threat of increasing fire frequencies in the Western Ghats, India.Conservation Biology18(6): 1553– 1561.
Kothyari UC, Garde RJ. 1992. Rainfall intensity-duration-frequency formula for India. Journal of Hydraulic Engineering-ASCE 118(2): 323– 336.
Kothari A, Suri S, Singh N. 1995. Conservation in India: a new direction.
Economic and Political Weekly30: 2755– 2766.
Krishnaswamy J, Richter DD. 2002. Properties of advanced weathering-stage soils in tropical forests and pastures. Soil Science Society of America Journal66(1): 244– 253.
Krishnaswamy J, Mehta VK, Joshi P, Rakesh KN, Suparsh PN. 2006. Comparative hydrology in forested South India: methodological approaches to unique challenges. InHydrology and Watershed Services in the Western Ghats of India. Effects of Land Use and Land Cover Change, Krishnaswamy J, Lele S, Jayakumar R (eds). Tata McGraw-Hill: New Delhi; 265– 295.
Kumar R, Shahabuddin G. 2005. Effects of biomass extraction on vegetation structure, diversity and composition of forests in Sariska Tiger Reserve, India.Environmental Conservation32(3): 1– 12. Kutner MH, Nachsteim CJ, Neter J. 2004. Applied Linear Regression
Models. McGraw-Hill/Irwin: New York; 701.
Lal R, Kothari A, Pande P, Singh S. 1994.Directory of National Parks and Sanctuaries in Karnataka: Management Status and Profiles: Indian Institute of Public Administration: New Delhi.
Legendre P, Legendre L. 1998. Numerical ecology. Developments in Environmental Modeling. Elsevier Science B.V.: Amsterdam; 853. Lele S, Hegde GT. 1997. Potential herblayer production and grazing
effects in anthropogenic savannahs in the moist tropical forests of the Western Ghats of India.Tropical Grasslands31(6): 574– 587. Madhusudan MD. 2000. Sacred cows and the Protected Forest: a study of
livestock presence in Indian wildlife reserves. CERC Technical Report 5, Center for Ecological Research and Conservation: Mysore. Madhusudan MD. 2005. The global village: linkages between
international coffee markets and grazing by livestock in a south Indian wildlife reserve.Conservation Biology 19(2): 411– 420.
Mehta VK. 2007. Forest disturbance assessment and evapotranspiration modeling for water management in India. PhD dissertation. Crop and Soil Sciences, Cornell University, 133.
Mehta VK, Sullivan PJ, Walter MT, Krishnaswamy J, DeGloria SD. 2008. Ecosystem impacts of disturbance in a dry tropical forest in southern India.Ecohydrology1149– 160, DOI:10.1002/eco.14. Menon S, Bawa KS. 1998. Deforestation in the tropics : Reconciling
disparities for estimates in India.Ambio27(7): 576– 577.
Myers N, Mittermeier RA, Mittermeier CG, da Fonseca GAB, Kent J. 2000. Biodiversity hotspots for conservation priorities. Nature 403(6772): 853– 858.
National Research Council. 2005.Radiative Forcing of Climate Change: Expanding the Concept and Addressing Uncertainties. National Academies Press: Washington, DC; 225.
Pascal JP. 1982. Bioclimates of the Western Ghats. Institut Francais de Pondichery: Pondicherry, 1 : 500000.
Pascal JP. 1988. Wet Evergreen Forests of the Western Ghats of India Ecology, Structure, Floristic Composition and Succession. Institut Francais de Pondichery: Pondicherry; 345.
Perrolf K, Sandstrom K. 1995. Correlating landscape characteristics and infiltration— a study of surface sealing and subsoil conditions in semi-arid Botswana and Tanzania. Geografiska Annaler Series A-Physical Geography77A(3): 119– 133.
R Development Core Team. 2006. R: A language and environment for statistical computing. R Foundation for Statistical Computing, http://www.R-project.org.
Sagar R, Raghubanshi AS, Singh JS. 2003. Tree species composition, dispersion and diversity along a disturbance gradient in a dry tropical forest region of India.Forest Ecology and Management186: 61– 71. Saha S. 2002. Anthropogenic fire regime in a deciduous forest of central
India.Current Science82(9): 1144– 1147.
Sahani U, Behera N. 2001. Impact of deforestation on soil physicochemi-cal characteristics, microbial biomass and microbial activity of tropiphysicochemi-cal soil.Land Degradation & Development12(2): 93– 105.
Saikh H, Varadachari C, Ghosh K. 1998a. Changes in carbon, nitrogen and phosphorus levels due to deforestation and cultivation: a case study in Simlipal National Park, India.Plant and Soil198(2): 137– 145. Saikh H, Varadachari C, Ghosh K. 1998b. Effects of deforestation and
cultivation on soil CEC and contents of exchangeable bases: a case study in Simlipal National Park, India.Plant and Soil204(2): 175– 181. Sandstrom K. 1995.Forests and Water: Friends or Foes? Hydrological Implications of Deforestation and Land Degradation in Semi-arid Tanzania. Linkoping University: Sweden; 69.
Shahabuddin G, Prasad S. 2004. Assessing ecological sustainability of non-timber forest produce extraction: the Indian scenario.Conservation and Society2(2): 235– 250.
Shankar U, Hegde R, Bawa KS. 1998a. Extraction of non-timber forest products in the forests of Biligiri Rangan Hills, India. 6. Fuelwood pressure and management options.Economic Botany52(3): 320– 336. Shankar U, Murali KS, Shaanker RU, Ganeshaiah KN, Bawa KS. 1998b. Extraction of non-timber forest products in the forests of Biligiri
Rangan Hills, India. 4. Impact on floristic diversity and population structure in a thorn scrub forest.Economic Botany52(3): 302– 315. Shiva Prasad CR, Reddy RS, Sehgal J, Velayutham M. 1998. Soils of
Karnataka for Optimizing Land use Publ. 47b Executive Summary. NBSS (ICAR), State Soil Survey, Department of Agriculture, Govt. of Karnataka: Nagpur; 88.
Sikka AK, Samra JS, Sharda VN, Samraj P, Lakshmanan V. 2003. Low flow and high flow responses to converting natural grassland into bluegum (Eucalyptus globulus) in Nilgiris watersheds of South India.
Journal of Hydrology 270: 12– 26.
Singh SP. 1998. Chronic disturbance, a principal cause of environmental degradation in developing countries. Environmental Conservation 25(1): 1– 2.
Skinner MF, Zabowski D, Harrison R, Lowe A, Xue D. 2001. Measuring the cation exchange capacity of forest soils.Communications in Soil Science and Plant Analysis32(11– 12): 1751– 1764.
Terbrogh J. 1998. Wildlife in managed tropical forests: a neotropical perspective. InTropical Forests: Management and Ecology, Lugo AE, Lowe C (eds). Springer-Verlag: New York.
Thomas GW. 1982. Exchangeable cations.Methods of Soil Analysis, Part 2. ASA and SSSA: Madison, WI; 159– 165.
Tilman D, Lehman C. 2001. Human-caused environmental change: impacts on plant diversity and evolution.Proceedings of the National Academy of Sciences of the United States of America 98(10): 5433– 5440.
Walkley A, Black IA. 1934. An examination of Degtjareff method for determining soil organic matter, and a proposed modification of the chromic soil titration method.Soil Science37: 29– 38.
WRI. 1996. World Resources Report 1996; World Resources Institute: Washington, DC.
Zhang RD. 1997. Infiltration models for the disk infiltrometer. Soil Science Society of America Journal 61(6): 1597– 1603.