22/1/2018 Scientific Committee | icbess
Home Important Dates Poster Conference Registration Committees Past Conference
1. Professor Shahzad Uddin
Director, Essex Accounting Centre PhD Director, Essex Business School (UK) 2. Professor Mathew Tsamenyi
Professor of Management Practice in Accounting
China Europe International Business School (CEIBS) (China)
Co-Founding Editor of the Journal of Accounting in Emerging Economies Co-Editor of the Research in Accounting in Emerging Economies Series Editorial Boards of the Accounting, Auditing and Accountability Journal (AAAJ) Editorial Boards of the Journal of Accounting and Organizational Change
Rreviewer for Management Accounting Research, Critical Perspectives on Accounting, Journal of Accounting Education, and International Business Review.
3. Dr. Andrew Delios
National University of Singapore 4. Professor Guochang Zhang
Professor Accounting
Hong Kong University of Science and Technology (Hong Kong) Professor Bridget Welsh
Professor of Political Science Ipek University (Turkey) 5. Professor Bridget Welsh
Ipek University, Turkey 6. Nikos Kartalis, PhD
Techological Educational Institute (University of Applied Sciences) of Western Macedonia at Kozani, Greece 7. Prof. Dr. Mohd Fuad
Professor of Management Dean of Faculty of Business Universiti Selangor – Malaysia 8. Jiri Strouhal, PhD
Associate Professor of accounting and corporate finance university of Economics Prague – Czehc
9. Phan Thi Hong Xuan, PHD.
Assoc Prof and Vice Dean
Faculty of Anthropology, HCMUSSH, VNU (Vietnam) 10. Prof. Vo Van Sen
HCMUSSH, VNU, Vietnam 11. Prof. Riaz Hassan
International Centre for Muslim & non-Muslim Understanding, University of South Australia, Australia 12. Dr. Susan Busby Aberystwyth
University Business School 13. Dr. Ovidi Carbonell-Cortés
Hamad Bin Khalifa University, Qatar 14. Dr. Khaled. A. Elnakhat
22/1/2018 Scientific Committee | icbess
http://icbess.stei.ac.id/scientific-committee/ 2/2
ﺭﺗﻧﺳ ﺩﻭﻠﭘﺁ
tes t t t t
The 4th ICBESS 2017 - PROCEEDING
Tentrem Hotel - Yogyakarta, August 09 – 10, 2017
574 | P a g e The 4th ICBESS 2017
INTERDEPENDENCY BETWEEN
INTERNATIONALIZATION AND
FIRMS’
PERFORMANCE
Della Meilody1 & Deddy Marciano2 1,2
Universitas Surabaya
Jl. Raya Kalirungkut, Surabaya, Indonesia
[email protected]; [email protected]
ABSTRACT
This research analyzes whether there is an interdependency between internationalization (IS) and firms’ performance in manufacturing industry. This study includes 57 companies that are listed in the Indonesian Stock Exchange (IDX) from 2011 to 2015. In order to know which explanatory variables that significantly lead to the Relative Performance based on Historical Target (RPH) and Relative Performance based on Industrial Target (RPI), this research exercises two-stage of least squares regression analysis. The result reveals that IS has a significant positive effect on RPHat0 and RPH itself has a positive effect on IS. It can be said that whenever the number of companies that internationalize themselves increase by a certain degree will have a positive impact on RPH and conversely. Other result shows that IS has significantly negative effect on RPI, however, RPI has an insignificant effect on IS. This means that the more companies internationalize themselves the more negative will be visible on their performance and conversely. Nevertheless, undertaking further research on the same topic with larger sampling population is necessary so that the puzzle whether or not IS and firm’s performance involving RPI and RPH remains interconnected can be explained more comprehensively.
The 4th ICBESS 2017 - PROCEEDING
Tentrem Hotel - Yogyakarta, August 09 – 10, 2017
575 | P a g e The 4th ICBESS 2017
1. Introduction
Internationalization (IS) can provide companies with the following benefits, for instance, it can elevate (1) the economies of scale, (2) economies of scope, (3) information and innovation, (4) give access to obtain resources, (5) lower the risks and (6) increase the bargaining power. However, the drawback of IS is that the cost that is due to an uncertainty. IS can also increase the cost of transaction and other cost which occurs when the firms want to obtain information. These costs can lead to deflate the firms’ performance.
Based on the respective benefits and costs from the process of IS, it can be said that the process of IS will affect the firms’ performance. But, the question is that “Is the internationalization able to improve the firms’ performance?”. This research topic had previously been studied by researchers to reveal the correlation between IS and the firms’ performance. The results of their studies remain contrast from one to another. Some researchers like Rugman (1979), Delios and Beamish (1999), Pangarkar (2008) remarked that the correlations were positive and creating linear patterns. However, some researchers such as Brewer (1981), Collins (1990), Colpan (2008), Qian (1997), Kistruck, Qureshi and Beamish (2013) with the U-shaped model, Hit et al., (1997), Driffield, Du and Girma (2008) with the inverted U-shaped model, and Contractor et al., (2003), Lu and Beamish (2004), Sung, Bell and Park (2008), Fisch (2012) with the S-Shaped model revealed the negative correlation and linear patterns.
Contractor et al.(2007) studied the correlation between IS and firms’ performance in India. They used return on assets (ROA) as a dependent variable. Meanwhile, the IS, age and size exercised as independent variables. The result showed that IS and firms’ performance were not correlated and it manifested the U-Shape pattern. Nevertheless, the age has significant correlation with ROA, likewise for the firm’s size. Rugman and Oh (2010) conducted their research on the same topic using ROA as a dependent variable, and then IS as independent variable along with the controlled variables such as size, advertising intensity, research and development (R&D). Their empirical studies revealed a positive correlation between IS and firms’ performance and it showed an inverted S-Curve pattern. The firm’s size has significantly correlated with ROA, meanwhile advertising intensity and R&D intensity were insignificant towards ROA.
Osorio et al. (2016) analyzed whether the size of company affected the correlation between IS and firms’ performance. They applied ROA to indicate the firms’ performance as a dependent variable and they opted for IS as an independent variable and the controlled variables were comprised of sales growth, age, size, advertising intensity, R&D intensity, productivity, debt and share price. The result showed that negative correlation occurred to large companies followed by the U-Shape pattern to medium size firms, and negative linear happened to small firms. Nonetheless, other controlled variables; sales growth, age, size, advertising intensity, R&D intensity, productivity and share price were significantly correlated to ROA and debt did not correlate with ROA.
Earlier researches documented that IS can have an effect on the firms’ performance and conversely because they were interdependent. Companies with better performance than their rivalries can
internationalize their firms more easily. Fiegenbaum et al. (1997), Grant et al. (1988) cited in Jung
The 4th ICBESS 2017 - PROCEEDING
Tentrem Hotel - Yogyakarta, August 09 – 10, 2017
576 | P a g e The 4th ICBESS 2017
growth, Jung and Bansal (2009) documented the research findings where the firms’ performance positively correlated to IS and an inverted U-Shape was depicted for RPH and a positive linear for RPI. Other result showed that under the variables such as available slack, the number of Japanese subsidiaries worldwide and firm size were strongly correlated with IS, RPH and RPI. Simultaneously, variable such as exporting intensity has negative correlation with IS, RPH and RPI. Likewise, group membership, firm age, and wage change have negative correlations with IS, RPH and RPI. Nevertheless, absorbed slack, potential slack, R&D intensity, exchange rate, and industry growth were positively linked to IS, RPH and RPI.
2. Theoretical Review
In the early research, Osorio et al. (2016) and Contractor et al. (2007) demonstrated that IS has
negative influence on firms’ performance. This negative affect was triggered by the cost of internationalization process, which was greater than the benefit that the firms should have attained. And the location where the firms were initially operating their businesses were not well-recognized so firms’ performance were considerably low. In contrast to Osorio et al, Rugman and Oh (2010) opined that by internationalizing, companies will expand their target market and improve their sales so that the firms have better performance.
Hypothesis 1: Internationalization has an effect on firms’ performance
The hypothesis is formulated based upon the previous studies showing that firms’ performance has positively correlated with IS (Jung and Bansal, 2009). Opposite to them, Sun and Lee (2013) revealed
that firms’ performance did not have positive correlation with IS. Further, based on the research
findings of Fiegenbaum et al. (1997) and Grant et al. (1988) that were cited in Jung and Bangsal
(2009) research, they remarked that companies with good performance possess the intangible and tangible resources that can be exercised to actualize the process of their internationalization.
Hypothesis 2: Firms’ performance has an effect on Internationalization
Sun and Lee (2013) analyzed the factors that determine the degree of IS for companies in the restaurant industry. Their research exercised the financial performance, level of franchising and type of restaurant as factors that affect the business expansion in international markets. They used IS as a dependent variable, determined the independent variables such as RPH, RPI, tobin’s q based on historical target, tobin’s q based on industrial target and franchising. Furthermore, the controlled variables used in their study were size, debt, market excess return, industry growth rate, exchange rate and dummy variable for type of restaurants. The result manifested that there was no significant correlation between IS and firms’ performance. The performance of individual company was measured by looking at their historical target and industrial target. Debt, market excess return, industry growth rate and exchange rate were not strongly correlated with the IS. Nonetheless, only the firm size that was positively correlated with IS.
3. Research Method
The 4th ICBESS 2017 - PROCEEDING
Tentrem Hotel - Yogyakarta, August 09 – 10, 2017
577 | P a g e The 4th ICBESS 2017
Table 1. Research Variables
Where;
ROAt = Return on Asset of a firm at year t
TPHt = Target performance based on firm’s historical performance at year t RPHt = Relative performance based on historical targetat year t
IAROAt = Average ROA of industry at year t
TPIt = Target performance based on industry performance at year t RPIt = Relative performance based on industrial targetat year t
Furthermore, this research opts for two-stage least squares regression analysis to reveal the influential independent variable towards the dependent variable. The dependent and independent variable are IS, RPH and RPI. The controlled variables are comprised of age of the firm (AGE), size of the firm (SIZE), absorbed slack (ARS), available slack (AVS), potential slack (PTS), and exchange rate (EX_RATE).
This study has two research models, the first research model is to document the simultaneous relationship between IS and firms’ performance where performance of the companies is weighted using RPH. And, the second research model is also meant to demonstrate the simultaneous relationship between IS and firms’ performance. The performance of companies is weighted by means of using RPI.
Research Model 1 (Internationalization – RPH)
ܴܲܪݐ ൌߚͳߚʹܫܵߚ͵ܣܩܧߚͶܵܫܼܧߝ (1)
ܫܵݐൌߚͷߚܴܲܪߚܣܩܧߚͺܵܫܼܧߚͻܣܴܵߚͳͲܣܸܵߚͳͳܲܶܵߚͳʹܧܴܺܣܶܧߝ (2)
Names of Variables Formulas
Internationalization (IS) ൌ
Relative Performance Based on Historical Target (RPH)
ൌ
ൌ൬െͳ ͵െʹെ͵൰
ൌ െ
Relative Performance Based on Industrial Target (RPI)
ൌ൬െͳ͵ െʹെ͵൰
ൌ Ȃ
Age of the firm (AGE) ൌ
Size of the firm (SIZE) ൌ ሺሻ
Absorbed Slack (ABS) ൌ
Available Slack (AVS) ൌ െ
Potential Slack (PTS) ൌ
Exchange Rate (EX_RATE) ̴ ൌ̴െ̴െͳ
The 4th ICBESS 2017 - PROCEEDING
Tentrem Hotel - Yogyakarta, August 09 – 10, 2017
578 | P a g e The 4th ICBESS 2017
Research Model 2 (Internationalization – RPI)
ܴܲܫݐ ൌߚͳߚʹܫܵߚ͵ܣܩܧߚͶܵܫܼܧߝ (3)
ܫܵݐൌߚͷߚܴܲܫߚܣܩܧߚͺܵܫܼܧߚͻܣܴܵߚͳͲܣܸܵߚͳͳܲܶܵߚͳʹܧܴܺܣܶܧ ߝ (4)
3. Analysis
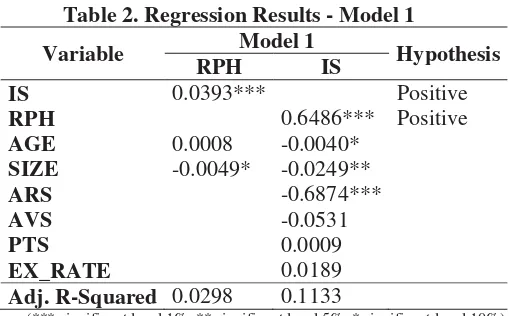
According to table 5.1, it can be said that H1a and H2a are acceptable under the research model 1. This means that dependent variable IS has positive correlation with RPH and on the way around. Having seen this experimental outcome, it becomes clear that the simultaneous relationship between IS and firms’ performance in the manufacturing industry that are listed in the IDX for the period of 2011 – 2015 are computable by means of exercising model 1.
Table 2. Regression Results - Model 1
Variable Model 1 Hypothesis
RPH IS
IS 0.0393*** Positive
RPH 0.6486*** Positive
AGE 0.0008 -0.0040*
SIZE -0.0049* -0.0249**
ARS -0.6874***
AVS -0.0531
PTS 0.0009
EX_RATE 0.0189
Adj. R-Squared 0.0298 0.1133
(*** significant level 1%, ** significant level 5%, * significant level 10%)
As it is depicted in model 1 (table 2), dependent variable IS has coefficient correlation 0.039372 with the level of significant below 1% or 0.0078. This means that variable IS has an effect on firms’ performance so that it will reveal a positive linear pattern. The result of this research is in line with the previous studies conducted by Rugman and Oh (2010) and supported by Rugman (1979), Errunza and Senbet (1981), Grant (1987), Kim and Lyn (1986), Delios and Beamish (1999), and Pangarkar (2008) that IS has positive correlation with firms’ performance which eventually leads to possess positive linear pattern.
The positive correlation happens for reason which is the benefit that companies have gained from internationalization is greater than the cost that they paid out to improve the firms’ performance. The benefits that they have obtained from the positive correlation are associated to greater market access, where companies will generate inputs (e.g. capital or human capital) that are less expensive (Contractor, 2007; Hennart, 1982; Lu and Beamish, 2004; Vernon, 1966). Companies can strengthen their market towards suppliers, distributors and consumers (Hymer, 1976), opportunity to obtain the knowledge and innovation through learning and development (Contractor et al., 2003; Ghoshal & Bartlett, 1990; Kogut & Zander, 1993; Zahra, Ireland, & Hitt, 2000), economies of scale and scope(Caves, 1996; Porter, 1986), and risks diversification in the case of unstable politics or fluctuation of exchange rates (Contractor, Kumar, & Kundu, 2007; Kim, Hwang, & Burgers, 1993). More importantly, this positive correlation shows the growth of internationalization has an impact on the RPH.
The 4th ICBESS 2017 - PROCEEDING
Tentrem Hotel - Yogyakarta, August 09 – 10, 2017
579 | P a g e The 4th ICBESS 2017
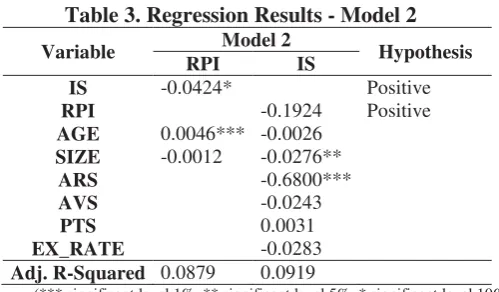
Table 3. Regression Results - Model 2
Variable Model 2 Hypothesis RPI IS
IS -0.0424* Positive
RPI -0.1924 Positive
AGE 0.0046*** -0.0026
(*** significant level 1%, ** significant level 5%, * significant level 10%)
Based on the result depicted in the table 3 where it can be said that hypothesis (H1b) and (H2b) are rejected by model 2, which means that variable IS does not have significantly positive correlation with RPI and RPI does not have an effect on IS. Having seen this experimental outcome, it becomes clear that the simultaneous relationship between IS and firms’ performance in the manufacturing industry that are listed in the IDX for the period of 2011 – 2015 cannot be computed through using model 2.
In model 2 (table 5), variable IS has coefficient towards RPI -0.042460 with the level of significant below 10% or 0.0502. This means that variable IS has negative correlation with firms’ performance and it leads to show negative linear pattern. H1b is rejected because it does not fit the initial hypothesis where it was believed that IS would have a positive effect on RPI. Nevertheless, this study
discovers an error, where the error happens when the experimental result stated H0was to be rejected
but apparently H0 was correct.
The result of this study is in line with the former research, Osorio et al. (2016) and Contractor et al.(2007) which then underpinned by Brewer (1981), Collins (1990), and Colpan (2008) where the result manifested that IS was negatively correlated with firms’ performance and leading to a negative linear pattern. This insignificant correlation happened for some reasons such as cost of internationalization is greater than benefits that the companies should have gained. The costs of IS that companies paid out like cultural adaptation and institutional norms costs. These factors therefore weakened the firms’ performance (Ghoshal & Bartlett, 1990). Other costs are like coordination and management costs that appeared due to the differential environments, high transactional and transportation costs (Contractor et al., 2007). Apart from that, cost of capital investment for acquiring or leasing the premises, where the firm will commence its operations, machineries and other necessary assets. These tangible assets inflate the amount of companies’ fixed assets. The higher value of tangible assets the firms have there will be more depreciation and amortization costs. As a result, the costs reduce the revenues or firms’ performance. Warsono (2003) findings were cited by Hermawan (2016) where he viewed that companies with more fixed assets will have more depreciation and amortization costs to bear. Consequently, the revenues of the companies will decrease.
Variable RPI has a coefficient correlation with RPI -0.192478 with level of significant above 10% or 0.2290. This means that RPI has negative influence on the IS. The result of this study is in accordance with previous findings documented by Lee and Sun (2013) where they opined that RPI has an insignificant effect on IS. The negative correlation indicates that companies with good performance has low intention to proceed its internationalization. This occurs because the companies are sufficiently sustainable in their domestic markets. Hence, they are neither interested in entering international markets nor proceeding their internationalization. The internationalization will increase their costs, will make the firms face the risks that somewhat can reduce their firms’ performance.
The 4th ICBESS 2017 - PROCEEDING
Tentrem Hotel - Yogyakarta, August 09 – 10, 2017
580 | P a g e The 4th ICBESS 2017
research variables. Variable RPI is weighted by looking at the targeted industry meanwhile the sampling population that is exercised in this study consists of 57 listed companies in IDX for a particular manufacturing industry. Therefore, RPI is not sufficiently attractive to be used as a determinant factor to gauge the firms’ performance. This means that the utilization of variable RPI cannot be claimed as a successful variable to demonstrate the correlation between IS and firms’ performance or else the RPI is incapable of providing a considerable influence on the augmentation and decrement of internationalizing companies.
4. Conclusion
The objective of this research is to study whether or not the interdependency between IS and firms’ performance is in existence. Under the t-test, the result of model 1 shows that variables in the IS are significantly correlated with the firms’ performance, and therefore it creates positive linear. Likewise, variable RPH demonstrates its positive correlation with IS and it creates positive linear pattern. The result shown in the model 1 can be then concluded that the existence of interdependency between IS and firms’ performance in the manufacturing industry is verifiable. Under the same t-test, the result of model 2 manifests that variables in the IS are insignificantly correlated with firms’ performance and therefore it creates negative linear pattern. In addition, variable RPI has a negative influence on IS. Hence, it is possible to clinch the model 2 that there is no empirical evidence that documents the IS and firms’ performance is interdependent.
One of the critical reasons for documenting the insignificant correlation occurred in this research is that the numbers of population sampling are probably insufficient, either way it requires more research variables. Nevertheless, undertaking further research on the same topic with larger sampling population is necessary so that the puzzle whether or not IS and firm’s performance involving RPI and RPH remains interconnected can be explained more comprehensively.
References
[1] Hennart, J. F., 1982, A theory of multinational enterprise. Ann Arbor: The University of
Michigan Press.
[2] Hymer, S. H., 1976, The international operations of national firms: A study of direct foreign
investment. Cambridge, MA: MIT Press.
[3] Porter, M. E., 1986, Competition In Global Industries: A Conceptual Framework. In
Competition In Global Industries, 15–60. Boston, MA: Harvard Business School Press.
[4] Rugman, A. M., 1979, International Diversification And The Multinational Enterprise.
Lexington, MA: Heath Lexington.
[5] Hermawan, C., 2016, Pengaruh Leverage, Tangibility, Liquidity, Size dan Growth Terhadap
Kinerja Badan Usaha Sektor Argiculture yang Terdaftar di Bursa Efek ASEAN Periode 2011-2015, Skripsi, Universitas Surabaya.
[6] Brewer, H. L., 1981, Investor Benefits From Corporate International Diversification, Journal of
Financial and Quantitative Analysis, Vol. 16(1): 113–126.
[7] Caves, R., 1996, Multinational Enterprise And Economic Analysis, 2nd Edition, Cambridge,
MA: Harvard University Press.
[8] Collins, J., 1990, A Market Performance Comparison Of U.S. Firms Active In Domestic,
Developed And Developing Countries, Journal of International Business Studies, Vol. 21(2): 271–287.
[9] Colpan, A. M., 2008, Are Strategy-Performance Relationships Contingent On Macroeconomic
Environments? Evidence From Japan’s Textile Industry, Asia Pacific Journal of Management, Vol. 25(4): 635–665.
[10] Contractor, F. J., Kundu, S., dan Hsu, C., 2003, A Three-Stage Theory Of International
Expansion: The Link Between Multinationality And Performance In The Service Sector, Journal of International Business Studies, Vol. 34(1): 5–19.
[11] Contractor, F. J., Kumar, V., dan Kundu, S. K., 2007, Nature Of The Relationship Between
The 4th ICBESS 2017 - PROCEEDING
Tentrem Hotel - Yogyakarta, August 09 – 10, 2017
581 | P a g e The 4th ICBESS 2017
[12] Delios, A., dan Beamish, P. W., 1999, Geographic Scope, Product Diversification, And The
Corporate Performance Of Japanese Firms, Strategic Management Journal, Vol. 20(8): 711– 727.
[13] Driffield, N., Du, J., dan Girma, S., 2008, Optimal Geographic Diversification And Firm
Performance: Evidence From The U.K, Journal of Productivity Analysis, Vol. 30(2): 145–154.
[14] Errunza, V., & Senbet, L., 1981, The Effect Of International Operations On The Market Value
Of The Firm: Theory And Evidence, Journal of Finance, Vol. 36(2): 401–417.
[15] Fiegenbaum, A., Shaver, J. M., dan Yeung, B., 1997, Which Firms Expand To The Middle
East: The Experience Of US Multinationals, Strategic Management Journal, Vol. 18(2): 141– 148.
[16] Fisch, J. H., 2012, Information Costs And Internationalization Performance, Global Strategy
Journal, Vol. 2(4): 296–312.
[17] Ghoshal, S., dan Bartlett, C., 1990, The Multinational Corporation As An Interorganizational
Network, Academy of Management Review, Vol. 15(4): 603–625.
[18] Grant, R. M., 1987, Multinationality And Performance Among British Manufacturing
Companies, Journal of International Business Studies, Vol.18(3): 79–89
[19] Grant, R. M., Jammine, A. P., dan Thomas, H., 1988, Diversity, Diversification And
Profitability In British Manufacturing Companies 1972–84, Academy of Management Journal, Vol. 31(4): 771–801.
[20] Hitt, M. A., Hoskisson, R. E., dan Kim, H., 1997, International Diversification: Effects on
Innovation and Firm Performance in Product-Diversified Firms, Academy of Management Journal, Vol. 40(4): 767–798.
[21] Jung, J.C., dan Bansal, P., 2009, How Firm Performance Affects Internationalization,
Management International Review, Vol. 49: 709-732.
[22] Kim, W. C., Hwang, P., dan Burgers, W. P., 1993, Multinationals’ Diversification And The
Risk-Return Trade-Off, Strategic Management Journal, Vol. 14(4): 275–286.
[23] Kim, W. S., & Lyn, E. O., 1986, Excess Market Value, The Multinational Corporation, And
Tobin’s Q-Ratio, Journal of International Business Studies, Vol. 17(1): 119–125.
[24] Kistruck, G. M., Qureshi, I., dan Beamish, P. W., 2013, Geographic And Product
Diversification In Charitable Organizations, Journal of Management, Vol. 39(2): 496–530.
[25] Kogut, B., dan Zander, U., 1993, Knowledge Of The Firm And The Evolutionary Theory Of
The Multinational Corporation, Journal of International Business Studies, Vol. 24(4): 625–645.
[26] Lu, J. W., dan Beamish, P. W., 2004, International Diversification And Firm Performance: The
S-Curve Hypothesis, Academy of Management Journal, Vol. 47(4): 598–609.
[27] Osorio, D.B., Colino, A., Martin, L.A.G., dan Vincente, J.A.Z., 2016, The International
Diversification-Performance Link In Spain: Does Firm Size Really Matter?, International Business Review, Vol. 25: 548-558.
[28] Pangarkar, N., 2008, Internationalization And Performance Of Small-And Medium-Sized
Enterprises, Journal of World Business, Vol. 43(4): 475–485.
[29] Qian, G., 1997, Assessing Product-Market Diversification Of US Firms, Management
International Review, Vol. 37(2): 127–149.
[30] Rugman, A.M, dan Oh, C.H., 2010, Does The Regional Nature Of Multinationals Affect The
Multinationality And Performance Relationship?, International Business Review, Vol. 19: 479-488.
[31] Sun, K. A., dan Lee, S., 2013, Determinants of Degree on Internationalization for U.S.
Restaurant Firms, International Journal of Hospitality Management, Vol. 33: 465-474.
[32] Sung, C. B., Bell, J. C., dan Park, X. W., 2008, Multinationality, R&D Intensity, And Firm
Performance: Evidence From U.S. Manufacturing Firms, Multinational Business Review, Vol. 16(1): 53–78.
[33] Vernon, R., 1966, International Investment And International Trade In The Product Cycle,
Quarterly Journal of Economics, Vol. 80(2): 190–207.
[34] Warsono. 2003. Manajemen Keuangan Perusahaan. Jilid I. Banyumedia. Malang.
[35] Zahra, S. A., Ireland, R. D., dan Hitt, M. A., 2000, International Expansion By New Venture
The 4th ICBESS 2017 - PROCEEDING
Tentrem Hotel Yogyakarta, August 9 – 10, 2017
The 3rdICBESS 2016
Full Paper Title in 18pt
1stAutor name1, 2ndAutor name2, 3rdAutor name3
1,2
Institution/Company Address, City, Country
[email protected]; [email protected] 3Institution/Company
Address, City, Country [email protected]
Abstract-In this paper, the formatting requirements for the International ASET Conference Proceedings are described. Some
recommendations on writing for a worldwide readership are offered. Please review this document to learn about the formatting of text, table captions, references, and the method to include the indexing information. The conference proceedings will be published in an electronic format. The full paper in MS Word file shall be written in compliance with these instructions. At a later stage, it will be converted into Portable Document Format (PDF). An abstract not exceeding 300 words, in one paragraph, and with no references, should appear on the top of the first page, after the title of the paper and the names of the authors in a section titled “Abstract” (without section number).The word “Abstract” must be Arial, Bold, Italic, and 10 pt. The abstract itself must be Times New Roman and 10 pt. The title of the paper must be Arial, Bold, and 16 pt. Names and affiliations must be Times New Roman. Names must be Bold and 12 pt while affiliations must be 11 pt. The title, names, and affiliations must all be centralized.
Keywords:4 - 8 keywords
1. Introduction
It is expected that authors will submit carefully written and proofread material. Careful checking for spelling and grammatical errors should be performed. The number of pages of the paper should be from 4 to 8.
Papers should clearly describe the background of the subject, the authors work, including the methods used, results and concluding discussion on the importance of the work. Papers are to be prepared in English and SI units must be used. Technical terms should be explained unless they may be considered to be known to the conference community.
2. Paper Format
The uniform appearance will assist the reader to read paper of the proceedings. It is therefore suggested to authors to use the example of this file to construct their papers. This particular example uses an American letter format with 25 mm margins left, right, top and bottom.
All text paragraphs should be single spaced, with first line intended by 7 mm. Double spacing should NOT be used anywhere in the manuscript. Position and style of headings and subheadings should follow this example. One empty line (11 pt) should be left between every two consecutive sections. Two empty lines should be left before and after the abstract.
All headings and subheadings should be bold and Arial font. Major headings must be 12 pt and subheadings should be 11 pt. No empty lines are required between the heading/subheading and the text.
2.1. Header, Footer, Page Numbering
Authors are asked to replace the “XXX” number (with the paper code that was assigned when the paper was accepted) on the header of the first page and on the footer of other pages in order to set a unique page number in the Proceedings.
The 3rdICBESS 2016
Papers should use 11-point Times New Roman font. The styles available are bold, italic and underlined. It is recommended that any text in the “figures” should not be smaller than 10-point font size.
2.3. Tables and Figures
Tables and figures should be placed close to their first citation in the text. All figures and tables should be numbered. Table headings should be centred above the tables. Figure captions should be centred below the figures. Refer to the figure below for a sample.
Fig. 1: Caption for figure goes at the bottom.
Figure captions and table headings should be sufficient to explain the figure or table without needing to refer to the text. Figures and tables not cited in the text should not be presented. Refer to the tale below for a sample.
Table 1: Caption for table goes at the top.
2.4. Equations
Each equation should be presented on a separate line from the text with a blank space above and below. Equations should be clear and expressions used should be explained in the text. The equations should be numbered consecutively at the outer right margin, as shown in Eqs. (1) - (2) below. Here is one example.
In this case, the governing system of equations can be written as follows:
= (1)
+ = + + 1 × (2)
+ = + + (3)
3. Submitting the Paper
The full paper has to be submitted electronically via the website of the conference (http://icnfa.com/OpenConf/) by the deadline (see website for details).
The 3rdICBESS 2016 4. Conclusion
Conclusions should state concisely the most important propositions of the paper as well as the author’s views of the practical implications of the results.
Acknowledgements
A short acknowledgement section can be written between the conclusion and the references. Sponsorship and financial support acknowledgments should be included here. Acknowledging the contributions of other colleagues who are not included in the authorship of this paper is also added in this section. If no acknowledgement is necessary, this section should not appear in the paper.
References
The IEEE citation format is used. Books and book chapters should be referenced as [1] and [2] respectively. Patents are referenced based on [3] and a thesis can be referenced as [4]. Finally, conference presentations/papers and journal papers need to be reference based on [5] and [6] respectively.
With the increasing availability of useful information that can be found on the internet, website references must also be reported based on [7]. Meanwhile, due to the dynamic nature of web pages and the fact that in most cases the information is not peer-reviewed, the use of published resources are very much preferred and advised over online references.
The reference section at the end of the paper should be edited based on the following:
[1] B. Klaus and P. Horn, Robot Vision. Cambridge, MA: MIT Press, 1986.
[2] L. Stein, “Random patterns,” in Computers and You, J. S. Brake, Ed. New York: Wiley, 1994, pp. 55-70. [3] J. P. Wilkinson, “Nonlinear resonant circuit devices,” U.S. Patent 3 624 125, July 16, 1990.
[4] J. O. Williams, “Narrow-band analyzer,” Ph.D. dissertation, Dept. Elect. Eng., Harvard Univ., Cambridge, MA. [5] U. V. Koc and K. R. Liu, “Discrete-cosine/sine-transform based motion estimation,” in Proceedings of the IEEE
International Conference on Image Processing, Austin, TX, 1994, vol. 3, pp. 771-775.
[6] R. E. Kalman, “New results in linear filtering and prediction theory,” J. Basic Eng., vol. 83, no. 4, pp. 95-108, 1961. [7] K. Author. (2015, May 10). Facility Greenhouse Gas Reporting (2nd ed.) [Online]. Available: