FUZZY MODELING APPROACH AND GLOBAL
OPTIMIZATION FOR DUAL RESPONSE SURFACE
Muhammad Sjahid Akbar, Bambang Widjanorko Otok Faculty of Mathematics and Natural Sciences
Sepuluh Nopember Institute of Technology (ITS), Surabaya E-mail: [email protected], [email protected]
Dedy Dwi Prastyo International Management Department
Institute of Business Management and Technology, Surabaya Master Student at Statistical Department ITS, Surabaya
E-mail: [email protected]
ABSTRACT
Dual Response Surface (DRS) with Lagrange multiplier is one of the most familiar classical multi response surface methods. Classical DRS optimization doesn’t concern about the quality characteristic of responses. In this paper, fuzzy approach is proposed for modeling DRS and quality characteristic of response simultaneously. The proposed method represented the object’s quality characteristic physically. The proposed method is applied to composite carbon drilling process and resulting nonlinear function that to be determined its optimal point. Many optimization methods fail to reach global optimum point because the non linear function is multimodal. Therefore, we used genetic algorithm for finding the global optimum point.
Keywords: dual responses surface, quality characteristics, fuzzy, global optimum, genetic algorithms.
1. INTRODUCTION
Response Surface Methodology (RSM) is able to find the optimal setting for input variables that maximizes (or minimizes) the responses (Khuri and Cornell, 1996). RSM consists of roughly three stages, they are, data collection (design of experiment), model building and optimization. A complete and detail explanation about design experiment for the first and second order model are referred to Khuri and Cornell (1996) and Myers and Montgomery (2002).
Dual Response Surfaces requires an overall optimization because interrelationships may exist among the responses and separate optimization will give meaningless result (Khuri and Cornell, 1996). DRS was firstly introduced by Myers and Carter in 1973. They used Lagrange multiplier approach. This classical DRS doesn’t concern about the quality characteristic of responses. Some researchers have modified DRS to accommodate quality characteristic of response in the optimization. Del Castillo and Montgomery (1993) optimized DRS using advanced computational algorithm to avoid dimensionality problem. Lin and Tu (1995) pointed out that the optimization scheme based on Lagrange multiplier can be misleading due to the unrealistic restriction of forcing the estimated prime response to specific value. Consequently, they proposed a new objective function to be minimized, square of estimated secondary response was added by square of distance of the estimated prime response to its target (similar with loss function). Copeland and Nelson (1996) optimized DRS via direct function minimization.
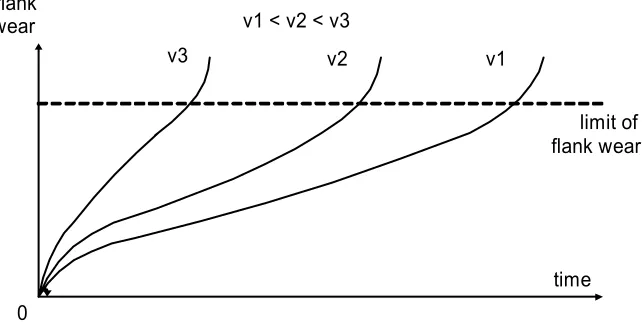
2000). There are two responses (drill wear and hole’s roundness deviation) and three control factors (x1, x2, x3). Drill wear is primary response and hole’s roundness deviation is secondary response. Both responses have quality characteristic Smaller the Better (STB), it means that the values of the response are expected to be as small as possible.
0 flank wear
time limit of flank wear v1
v2 v3
v1 < v2 < v3
Figure 1. The Growth of Flank Wear at Some Speeds of Cutting (vi )
In fact, the growth of the drill wear is not linear (Figure 1). The growth of drill wear is fast immediately after the drill is used. Several times after the drill is used, the growth of the drill wear is linier. After the limit of the flank wear, the growth of the drill wear is faster than before. The growth of the drill wear after the limit of the flank wear is the same as the growth of the drill wear immediately after it is used (Rochim, 1993). Different speeds of cutting result in the same behavior of growth with different time consuming to reach limit of the flank wear.
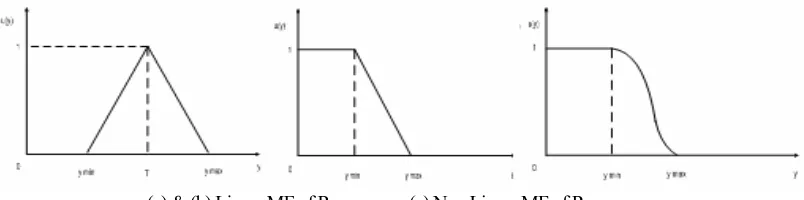
Classical RSM gives the linear change of the degree of satisfaction. If it is not practically valid (nonlinear or even non symmetric) classical RSM can be misleading (Kim and Lin, 1998). In this work, we propose a fuzzy approach to tackle this problem. The primary response, drill wear, affected the secondary response, hole’s roundness deviation. We assume secondary response’s behavior is same as the primary response. Based on this real condition, classical RSM can not tackle the drilling process problem. The membership function (MF, as in fuzzy set theory) of a response is interpreted as the degree to which a response satisfies its target. MF is between 0 and 1 (0 being the worst and 1 being the best).
2. DUAL RESPONSE SURFACE
3. FUZZY SET AND MEMBERSHIP FUNCTION ASSESSMENT
If X is a collection of objects denoted generically by x, then a fuzzy set A is defined as a set of ordered pairs A = {(( , x µA( )) | x x ∈ )}X , where µA( )x is called membership function (or MF
for short) for the fuzzy set A. The MF maps each elements of X to a membership grade (or membership value) between 0 and 1. For simplicity of notation, we introduced an alternative way of denoting a fuzzy set. A fuzzy set A can be denoted as follows:
( )
, if is a collection of discrete objects
( )
, if is a continuous space (usually real)
i detail explanation of the shape and formulae about MF are referred to Jang, Sun, and Mizutani (1997) and Zimmermann (2000).
(a) & (b) Linear MF of Response ; (c) Non Linear MF of Response
Figure 2. Membership Function of Response
If the degree of satisfaction doesn’t change linearly, in other word a non linear MF is desired, then the process of selecting an admissible functional form is difficult and time consuming. However, it can be simplified by employing a general functional form which can generate a rich variety of shape by adjustment of its parameters. Kim and Lin (1998) built a general non linear MF that is called an exponential function. This function has been proven to provide a reasonable and flexible representation of human perception (Kirkwood and Sarin (1980) in Kim and Lin (1998)). The exponential function is defined as:
max min
A STB case, response is expected as small as possible (ymin) as it can be seen in Figure 2(b) which is stated as
min
A LTB case is the reverse of STB. For an asymmetric case, a NTB case as in equation (3) can be easily modified to be an asymmetric function, i.e. function f y
(
imax−Ti)
and(
min)
i i
f T − y had different shape.
The union, intersection, and complement are the most basic operations on classical sets. Corresponding to the classical set operation, fuzzy sets have similar operations (Jang, Sun, Mizutani, 1997) and (Zimmermann, 2000). Sometimes, it is advantageous or necessary to use MF with two inputs, each in a different universe of discourse. MFs of this kind are generally referred to as two-dimensional MF. Ordinary MF (MF with one input) is referred to as one dimensional MF. One natural way to extend one-dimensional MF to two-dimensional ones is via cylindrical extension (Jang, Sun, Mizutani, 1997).
4. GENETIC ALGORITHM
Genetics Algorithms (GA) is one of the derivative-free stochastic optimization methods based loosely on the concepts of natural selection and evolutionary process (Jang, Sun, and Mizutani, 1997). GA encodes each point in parameter (or solution) space into a binary bit strings called a chromosome. Each point is associated with a fitness value that, for maximization, is usually equal to the objective function evaluated at the point. Instead of single point, GA usually keep a set of points as a population (or gene pool), which is then evolved repeatedly toward a better overall fitness value. In each generation, the GA constructs a new population using genetic operators such as crossover and mutation.
GA differs from conventional optimization and search procedures in several fundamental ways. These are the summaries (Gen and Cheng, 1997):
1. GA work with a coding of solution set, not the solutions themselves. 2. GA search from a population of solution, not a single solution.
3. GA use payoff information (fitness function), not derivatives or other auxiliary knowledge. 4. GA use probabilistic transition rules, not deterministic rules.
5. MODELING AND ANALYSIS
5.1 Fitting Second Order Model
The plots of primary response (y1) spread symmetrically and there is no indication of outlier. However, the plots of secondary response (y2) don’t spread symmetrically. There is an extreme point that indicates the presence of an outlier (y2 = 33). We tested the outlier using DFFITS, DFBETAS, and Cook’s distance (Rousseeuw and Leroy, 1987). They showed that y2=33 is an outlier. The second order model for both y1 and y2 were fitted as follows:
2 2
1 1 2 3 1 2
2
3 1 2 1 3 2 3
0.23624 0.030274 0.027951 0.22875 0.073398 0.073229
0.052822 0.00525 0.02562 0.03625
Model in equation (5) was estimated by using OLS in coded value. We substituted these variables below into equation (5), so we got equation (6).
' 1
Hole’s roundness deviation (y2), which is influenced by an outlier, was fitted by using Least Median Square (LMS) regression (7).
2 2
2 1 2 3 1 2
2
3 1 2 1 3 2 3
341.91081 0.143124 0.0103172 7.792715 0.0000454 0.0002
0.048 0.000127 0.0011636 0.00097
Now, we got new models ((6) and (7)) that will be used for the next analysis.
5.2 Response Quality Characteristic and Its Specification
Primary and secondary responses are expected to have a value as small as possible (STB). In practical, both responses have upper and lower bounds (specification). These bounds are useful to determine the membership function’s range of fuzzy set. Rochim (1993) stated that the upper bound of drill type HSSis 0.3–0.8 mm. In this paper we used 0.3 mm and 0 mm as our upper bound and lower bound respectively. The data were collected from drilling process using drill with diameter 12 mm. The diameter of a drill determines the upper and lower bound of hole’s roundness deviation (Sato and Sugiarto, 1999). The upper and lower bounds of y2 are 18 micron and 0 micron.
5.3 Membership Function Assessment
0.5
Figure 3. Membership Function Exponential
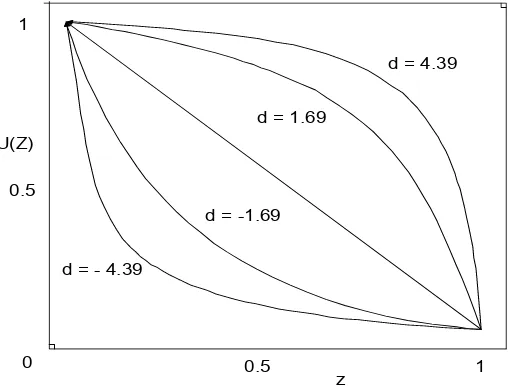
In fact, the growth of drill wear is not constant, so we employed the nonlinear MF. The exponential function is suitable to explain the characteristic of drill wear’s growth. The z value in the exponential function interprets the standardized distance of response to its target. In this work, we used the target value as small as possible (zero). For the target to be equal to zero, we got the following values:
At an arbitrary point z0 , (0 < z0 < 1), the decision maker assesses the degree of satisfaction, denoted as s, and then solves the equation
µ
(z0)=s for d. There is no closed form solution to2 ln degree of satisfaction of y2 was 0.7, by the same way we got d = 1.69. The expected degree of satisfaction for each response is based on the degree of importance of response.
A dual response problem requires an overall optimization, that is, a simultaneous satisfaction with respect to both primary and secondary responses. A ‘minimum’ operator of fuzzy set is employed for aggregating the two objectives, where µ(y ))1 and µ(y ))2 are function of x (i.e. fitted response surface) and Ω defines the feasible region of x. The above formulation aims to identify x which would maximize the minimum degree of satisfaction, with respect to both responses within the feasible region, that is, max imize [ min imum ( (y ), (y )) ]µ )2 µ )2 with respect tox∈ Ω. The complete formulation of drilling process problem is formulated as follow:
Objective function = max min
{
(
µ(z ), (z )1 µ 2)
}
(13)Formulation (13) and (14) represent a constrained nonlinear optimization with a single objective. In principle, any general algorithm for nonlinear problem can be used, including General Reduced Gradient (GRG) method (Del Castillo and Montgomery (1993) and Rardin (1998)). It should be noted that GRG algorithm may fail to reach an optimal point if the membership function in constraint function (14) has non-differentiable points. Moreover, the nonlinear optimization may result in local optimum because the found solution can depend on the starting point supplied by the user.
Factor X1requires 19 bits. By the same way we get the length of required bits for X2 and X3, they are 16 bits and 14 bits. We got the total length of a binary string, called chromosome, was 49 (=19+16+14) bits. A chromosome represents a solution point. A set of solution point is called population.
The initial population (75 chromosomes) was selected based on roulette wheel approach (Gen and Chen, 1997). We used one-cut-point crossover method with mutation rate 0.01. If mutation rate is high, above 0.1, GA performance will approach that of a primitive random search (Jang, Sun, and Mizutani, 1997). Now we have just completed an iteration of GA, called one generation. The test runs were terminated after 100, 250, and 500 generations. We changed the probability of crossover from 0.25, 0.50, and 0.75.
From those experiments, we got the optimum condition on y1=0.228 mm and y2=9.8 micron. This condition was resulted from X1=624.284 rpm, X2=52.885 mm/min, and X3=74.1440 (Table 1.). The result of fuzzy approach was the smallest drill’s wear with degree of overall satisfaction 65.8% (Table 2). This value is better than classical DRS (Isnaini, 2000) which having degree of overall satisfaction 64.9% and Lin & Tu approach (Akbar and Setiawan, 2005) with degree of satisfaction 27.1%.
Table 1. Optimal Points from Several Optimization Methods
Optimal
Predictors Responses Methods
X1 X2 X3 Y1 Y2
Lagrange multiplier (Isnani, 2000) 619,7 59,3 73,7 0,230 9,674 Lin & Tu (Akbar and Setiawan, 2005) 798,5 90 70,6 0,279 7,599
Fuzzy approach 624,284 52,885 74,144 0,228 9,800
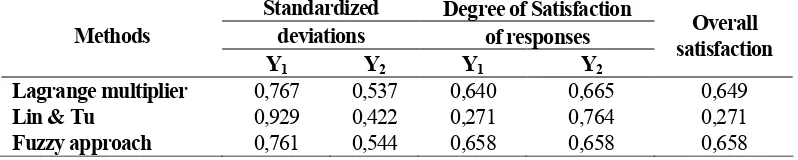
Table 2. Standardized Deviation, Individual and Overall Satisfaction of Responses.
Standardized Degree of Satisfaction deviations of responses Methods
Y1 Y2 Y1 Y2
Overall satisfaction
Lagrange multiplier 0,767 0,537 0,640 0,665 0,649
Lin & Tu 0,929 0,422 0,271 0,764 0,271
Fuzzy approach 0,761 0,544 0,658 0,658 0,658
On individual optimization of y2, fuzzy modeling approach results the larger response which contradict to characteristics quality (STB). However, this value falls in the specification area. So we focused on simultaneous optimization which optimizes two responses simultaneously. Because of it, we should use overall satisfaction as measurement of goodness. In this study, fuzzy modeling approach gave the highest degree of satisfaction. Moreoverl, fuzzy modeling approach could accommodate the quality characteristic of responses. This aspect is more reasonable to be applied.
6. CONCLUSION
satisfaction with respect to both responses. A fuzzy modeling approach concern with some criteria. First, it concerns about the quality characteristic of responses. The second, fuzzy approach concerns about the upper and lower bounds (specification) based on practical problem. Another possible advantage of fuzzy approach is that it can optimize the robust regression model. Moreover, a nonlinear membership function can model the object’s quality characteristic very flexibly.
7. FUTURE WORKS
More suitable membership function is the concern of the future work. We should find the detail condition of the control factors when the drill wear behaves as in Figure 1. The MF should be built based on this detail condition. A constrained optimization problem in GA should be studied more intensive, especially in handling constraints.
REFERENCES
Akbar, M.S. and Setiawan, Y. (2005), ‘Pemodelan Data yang Mengandung Pencilan pada Rancangan Komposit Terpusat (Studi Kasus Data Penyimpangan Kebulatan Lubang pada Penggurdian Komposit Karbon)’, Prosiding Seminar Nasional Statistika VII, Jurusan Statistika-FMIPA ITS, 26 Nopember 2005.
Copeland, K. and Nelson, P. (1996), ‘Dual Response Optimization via Direct Function Minimization’, Journal of Quality Technology, Vol.28, pp. 331-336.
Del Castillo, E. (1996), ‘Multi responses Process Optimization via Constrained Confidences Regions’, Journal of Quality Technology, Vol. 28, pp. 61-70
Del Castillo, E. and Montgomery, D. (1993), ‘A Nonlinear Programming Solution to the Dual Response Problem’, Journal of Quality Technology, Vol. 25, pp.199-204
Gen, M. and Chen, R. (1997), Genetic Algorithms and Engineering Design, John Willey & Sons, Inc, New York.
Isnaini, I. (2000), ‘Metode Permukaan Respon untuk Analisa Pengaruh Modifikasi Sudut Pahat Gurdi terhadap Keausan Pahat dan Kebulatan Lubang pada Material Komposit Karbon/Epoxy’, Tugas Akhir Jurusan Statistika, FMIPA, ITS.
Jang, J.-S.R; Sun, C.-T; and Mizutani, E. (1997), Neuro Fuzzy and Soft Computing: A Computational Approach to Learning and Machine Intelligence, Prentice Hall, Inc. USA.
Khuri, A.I. and Cornell, J.A. (1996), Response Surface Designs and Analyses, 2nd Edition, Marcell Dekker Inc, New York.
Kim, K-J and Lin, DK. J. (1998),‘Dual Response Optimization: A Fuzzy Modeling Approach’, Journal of Quality Technology, Vol. 30, pp. 1-10
Lin, DK. J. and Tu, W. (1995), ‘Dual Response Surface Optimization’, Journal of Quality Technology, Vol. 27, pp.33-39.
Rardin, L.R. (1998), Optimization in Operation Research, Prentice Hall. Inc. New Jersey.
Rochim, T. (1993), Teori dan Teknologi Proses Permesinan, HEDS Projects, Bandung.
Rousseeuw, R.J. (1984), ‘Least Median of Squares Regression’, Journal of the American Statistical Assosiation, Vol. 79, pp. 871-880.
Rousseeuw. R.J and Leroy, A.M. (1987), Robust Regression and Outlier Detection, New York, John Willey.
Sato, G.T. and Sugiarto, H.N. (1999), Menggambar Mesin Menurut Standard ISO, P.T. Pradnya Paramita, Jakarta.