Please refer to page 51 for important disclosures and analyst certification, or on our website
www.macquarie.com/research/disclosures.
INDONESIA
SILO IJ
Neutral
Price (at 06:56, 06 Oct 2014 GMT)
Rp15,200
Valuation Rp 15,000
- DDM
12-month target Rp 15,000
Upside/Downside % -1.3
12-month TSR % -1.3
Volatility Index Low/Medium GICS sector
Health Care Equipment & Services
Market cap Rpbn 17,571
Revenue bn 2,503.6 3,335.9 4,256.0 5,676.7
EBIT bn 74.2 169.6 206.5 239.8
Source: FactSet, Macquarie Research, October 2014 (all figures in IDR unless noted)
Analyst(s)
Lyall Taylor
+62 21 2598 8489 [email protected] 7 October 2014
PT Macquarie Capital Securities Indonesia
Siloam Hospitals
Bridging the credibility gap
Initiating with a Neutral recommendation; prefer LPKR
We initiate coverage of SILO with a Neutral recommendation and Rp15.0k valuation and PT. We believe SILO is well placed to become Indonesia’s preeminent private hospital operator, and be at the forefront of the long term
development of Indonesia’s underserviced healthcare sector.
However, the company’s valuation metrics are already very high, and appear to anticipate the seamless delivery of the company’s aggressive growth targets,
whereas we believe medium term execution risks are much higher than the market currently perceives, and that SILO’s guidance on the timeframes for the ramp-up of its immature/new hospitals’ profitability is too aggressive. The stock has also already rallied 60% this year despite relatively-weak 1Q–2Q14A results. We therefore believe now may not be the optimal entry-point. In the meantime,
we believe a vastly superior way to play the story is through SILO’s listed parent
LPKR, given that at-market, LPKR’s 78.9% stake represents 66.0% ofLPKR’s
market cap, despite SILO’s minimal contribution to LPKR’s earnings at present.
A wide open opportunity
–
long term
Indonesia’s healthcare sector remains significantly underdeveloped, with
healthcare spending currently sitting at just 3% of GDP, vs. 4–5% for regional peers, and DM averages of c10%. A contributing factor has been a significant deficit in the quality of available domestic healthcare services, which has caused affluent Indonesians to seek medical care abroad. Any successful elevation of domestic healthcare standards towards international norms therefore represents a major opportunity. Furthermore, SILO stands a good chance of being a leading player in driving this upgrading, given its scale, access to funding, brand,
preferential access to sites/rental terms, and other first-mover advantages.
Valuation expensive, but not as high as it looks
SILO’s FY14E PER is an exceptionally high c200x. However, we discuss how
this is overstated by the presence of a number of immature hospitals in SILO’s
portfolio, which generally book losses in early years. Considering the profitability of its 4 mature hospitals alone, the stock is trading on a PER of about 110x, and this multiple would drop to only 37x if SILO’s 13 immature hospitals were eventually able to achieve the similar per-hospital profitability as SILO’s mature hospitals. In addition, the company has another 23–29 hospitals in the pipeline.
However, execution and overexpansion risks are high
However, while the opportunity is considerable longer term, the risk with long term thematics is often not the long term but the short term. Healthcare spending as a percentage of GDP has actually been relatively flat in recent years, and the major industry bottleneck at present is not the availability of facilities, but the limited availability of quality doctors, where standards remain far below international norms. This human capital upgrading will likely be a very slow process, and in the meantime, Indonesia will likely remain uncompetitive with regional peers, and suffer a growing deficit in the medical tourism trade.
Inside
Bridging the credibility gap: The bull case 3
The bear case: So why the Neutral? 9
Valuation 19
Risk analysis 23
Company profile and operations 26
Summary of our earnings forecasts 33
Analysis by hospital category 39
Appendix: SILO’s targets 47
SILO IJ rel JSX performance
Source: FactSet, Macquarie Research, October 2014
Company profile
Hospital footprint
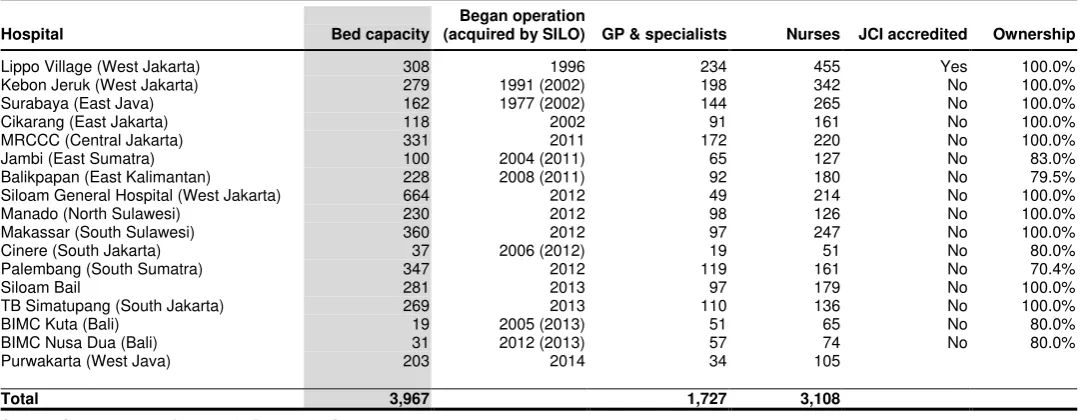
SILO is currently Indonesia’s largest private hospital operator, with a portfolio of 17 hospitals with 3,967 beds (capacity) spread across 13 of Indonesia’s
major cities. SILO’s hospitals are multi-specialty and provide a full range of primary through quaternary care across a broad range of medical specialties. The company is also in the early stages of an aggressive nationwide rollout of hospitals that targets an expansion in the company’s hospital footprint to 40 hospitals with 10,000 beds by FY17E, spread across 25 Indonesian cities.
The company currently operates four “mature” hospitals; Lippo Village (SILO’s
flagship, established in 1996); Kebun Jeruk and Surabaya (acquired in 2002, but first established in 1991 and 1977); and Lippo Cikarang (established in
2002). The balance of SILO’s hospitals are considered immature/developing,
although the majority were established or acquired in 2011–12 (with the acquired hospitals first established in 2004–08), and are therefore mid- rather than early-stage in their maturation. SILO’s Lippo Village facility achieved JCI
accreditation in 2007, but to date SILO’s other hospitals have not yet done so. The company’s next largest competitors are Mitra Keluarga – owned by the
Kalbe Farma family (10 hospitals); Awal Bros (7 hospitals); and Sari Asih Group (6 hospitals). Other notable competitors are Ramsay Sime Darby (3 hospitals), as well as regional hospitals in Singapore, Malaysia, and Thailand, which are currently major beneficiaries of Indonesia-sourced medical tourism.
Customer composition
Unlike in developed markets, where patients frequently visit their local (often publicly funded) GP before seeking specialised care, in Indonesia, private hospital customers typically proceed directly to hospitals to seek specialist
consultations. SILO’s business model is therefore actually a de facto hybrid clinical and hospital model at present (although this is now slowly changing).
Approximately two-thirds of SILO’s patients are out-of-pocket patients, but private insurance and government funded patients will likely grow in
significance over time, which will boost volumes but lower margins. About half
of SILO’s inpatient volumes are sourced from its outpatient department, and the other half from its emergency department, which is a major focus for the company (through the development of its private, nationwide 500-911 emergency number). Referral business remains negligibly small at present.
SILO’s current target market is primarily middle-upper income Indonesians, as the high-end market typically travels abroad for medical care, while the lower-end market relies on public healthcare services (about 75% of Indonesians are covered by government healthcare insurance, and this will be expanded
to 100% by 2019). In addition, SILO’s target market also includes high-income Indonesians in need of emergency services. Longer term, SILO aspires to service the full income range, however (as well as selective medical tourism).
Company history and background
SILO was established in 1996 as a JV between Gleneagles and a
predecessor entity to what later became LPKR. This JV established SILO’s flagship Lippo Village facility. Following the onset of the Asian Financial Crisis, the JV was dissolved. In 2002, Siloam acquired/established three additional hospitals, and from 2011, commenced and aggressive expansion programme.
Bridging the credibility gap: The bull case
Long term thematic supportive
On virtually any metric, Indonesia’s healthcare market appears considerably underserviced.
Healthcare spending is currently only about 3% of GDP, which is low not only by developed world/OECD standards of c10% (the US should be excluded from analysis, as healthcare spending is inflated by over-servicing due to litigation risk), but also relative to regional and other lower-middle-income peers, which average closer to 4–5%. Furthermore, the number of beds and doctors per capita is only circa 1/3rd and 1/10th, respectively, of DM averages, while
Indonesia’s life expectancy at birth – arguably the most all-encompassing measure of the adequacy of domestic healthcare services, although rising, remains sub-optimal, at 71yrs.
Fig 1 Healthcare spending as a % of GDP Fig 2 Beds and doctors per 1,000 people
Source: WHO and IMF, Macquarie Research, October 2014 Source: Frost & Sullivan, Macquarie Research, October 2014
Internationally, growth in healthcare spending as a percentage of GDP has a well-established relationship with growing levels of economic development (although demographics are also vitally important). In addition, growth in Indonesian healthcare spending is likely to be given a boost by the 2014–19 roll-out of universal public healthcare insurance (although 75% of the
population is already covered by various public healthcare schemes), as well Jokowi’s recent
election as Indonesia’s next president, given his stated intention to extend the public health
card policy he implemented as Jakarta governor to a nationwide policy.
In addition, while human capital constraints are a very real issue for the industry’s
development (see overleaf; we note that the under-penetration of physicians is much higher than the number of hospital beds, indicating that this is the real market constraint), in the long run (10–20 years), this is very likely a surmountable issue. It is difficult to find examples of countries that have successfully developed and which have not, in the process, successfully raised the level of domestic healthcare services, and Indonesia is unlikely to be an exception.
Siloam also has several important first-mover advantages
Moreover, SILO appears well placed to be at the forefront of the industry’s development. For
a start, the company is already the largest private hospital operator in Indonesia, and that
lead is likely to widen in coming years, given the company’s aggressive hospital roll-out programme and its superior access to financing, due to its publicly-listed status and circa US$1.5bn market cap. And investor demand for EM healthcare assets, coupled with a limited
range of domestic alternatives, and SILO’s existing highly-rated scrip, are likely to allow the company to easily tap the equity market for additional financing as and when required.
In addition, we can identify multiple additional competitive/first-mover advantages:
Employer of choice: SILO’s state-of-the-art equipment, brand prominence, and scale, will likely make it easier than average for SILO to attract the best domestic doctors. And being an employer of choice could quickly become a major self-perpetuating advantage if it enabled SILO to attract industry-leading medical specialist by offering them the opportunity to work with other industry-leading people. SILO also has a partnership scheme in place
with UPH (Lippo’s education operations) to develop a pipeline of new doctors.
3.0% 3.2% 4.0% 4.2%
License procurement: It requires 36 separate licenses in Indonesia to open a hospital – a bureaucratic barrier to entry that is likely to advantage well-connected domestic business groups (such as Lippo). In addition, there are some regulatory restrictions on foreign participation (such as a 67% foreign ownership cap). This is likely to make it easier for SILO to expand its hospital network in Indonesia than regional/international competitors.
Partnership with LPKR:SILO’s affiliation with the Lippo Group also confers on it further
advantages in the form of access to new sites; an ability to operate an “asset light” strategy
(with land and building development costs borne by LPKR); and LPKR’s willingness to provide SILO’s upstart hospitals with rental subsidies for the first 3–4 years (as well as bear some of the risk of low occupancy rates through variable rental arrangements).
An established brand: Unlike in more developed healthcare markets, it remains standard practice in Indonesia for people seeking healthcare services to bypass a clinical GP consultation and proceed directly to a specialist located at a hospital (which is generally thought to be due to the low level of faith placed in the quality of GP advice).
Consequently, SILO’s referral business remains minimal, and SILO relies heavily on “walk
-in” traffic. This renders brand prominence of much greater importance than in many developed hospital markets. While this operating model persists (and it is already slowly changing), having an established brand is likely to be significant asset in attracting increased patient volume.
Nationwide emergency number:Indonesia currently has no nationwide public “911”
emergency number. Consequently, SILO is promoting its private 500-911 number, and is the only healthcare provider to be rolling this out such a number on a national scale (although several competing operators have regional numbers). If consumer mindshare of this number is achieved, this could become an important asset over time – particularly
given that c50% of SILO’s inpatient volumes driven are by its emergency department.
Fig 3 Trend in Indonesian hospital numbers Fig 4 List of major private hospital operators (est.)
Source: MoH, Macquarie Research, October 2014, Source: Various sources, Macquarie Research, October 2014
Acquisitions/industry consolidation a major opportunity
In addition, Indonesia’s private hospital industry remains highly fragmented. Consequently,
there are likely to be significant acquisition opportunities for the larger players over time –
particularly those with superior access to capital and an ability to leverage “network”
advantages, such as including acquired hospitals within the company’s brand network, and leveraging superior bargaining power with equipment and pharmaceutical suppliers.
Amongst SILO’s existing hospitals, 7 were acquired by acquisition, and only 10 established organically, and 2 of these 7 acquisitions also occurred as recently as December 2013 (two BIMC branded Bali-based hospitals) – albeit that the size was small (a combined 50 beds, acquired for US$26m). Opportunistic bolt-on acquisitions could complement SILO’s rapid organic expansion programme, and will be aided meaningfully by its ability to fund
acquisitions through its highly-rated scrip (which likely offers the company the lowest cost of
free balance sheet post the company’s IPO.
667 704 738 793 810
535 591
634
815 915
1,202 1,295
1,372
1,608
1,725
0 250 500 750 1,000 1,250 1,500 1,750 2,000
2009 2010 2011 2012 2013
Public Private
599 for profit; 724 not-for-profit
Player Hospitals % of total
Siloam 17 2.8%
Mitra Keluarga 10 1.7%
Aw al Bros 8 1.3%
Ramsay Sime Darby 3 0.5%
Omni Hospital 2 0.3%
Mayapada 2 0.3%
KPJ Healthcare 2 0.3%
Ciputra Hospitals 1 0.2%
Private hospital assets are highly rated
–
especially market leaders,
and especially in emerging/ASEAN markets
Market-leading private hospital operators generally have robust businesses characterised by (1) defensive cash flows; (2) high levels of free cash flow generation; (3) GDP+ growth profiles, aided by aging populations in many markets, and above-average growth in care-intensive non-communicable diseases; and (4) the ability to expand margins over time through improving occupancy; brownfield expansions; and pricing (particularly in emerging markets where out-of-pocket patients are a larger share of a hospital’s payer mix).
In addition, incremental greenfield and acquisitive-based expansion typically augments overall growth rates, resulting solid, consistent growth, coupled with high returns on capital. Consequently, well-run private hospital assets are generally highly rated, and in the developed world generally trade at above-market multiples of 20–25x earnings.
Furthermore, in EMs (and especially emerging Asia at present), multiples are higher still – generally 30–50x. This latter multiple premium reflects not only the superior growth prospects these markets are seen to offer, but also the fact that margins are generally higher, owing to more limited competition, and a greater percentage of customers being out-of-pocket payers with limited bargaining power (as compared to private insurance or government patients).
In addition, we cannot help but notice that the long term share price charts for regional private hospital operators – almost without exception – seem to go from the bottom left to the top right (Fig 5), albeit aided by multiple expansion in recent years. Prima facie, shorting a stock like SILO therefore appears to be a risky proposition.
Fig 5 Share price performance of regional hospitals Fig 6 Current PER multiples – regional comps (T+1)
Source: Bloomberg, Macquarie Research, October 2014 Source: Bloomberg (6 Oct 2014), Macquarie Research, October 2014
Exceptions exist, however. Margins and returns on capital for hospital operators in developed markets who rely heavily on government-funded patients – particularly in markets where the
relevant government’s finances are under pressure and reimbursement rates to healthcare providers are being cut (such as in some European economies at present) – are much lower (and are falling). In addition, economic returns earned by sub-scale operators, as opposed to the best-in-class operators which are typically listed, are also frequently substandard.
However, Indonesia’s healthcare market is unlikely to demonstrate these characteristics for a
long time, and SILO is likely to be amongst the market leaders rather than a sub-scale player.
Significant upside if its expansion plans can be delivered: A
plausible valuation case still exists for SILO at current levels
Lastly, despite SILO’s very high multiples of current earnings, a plausible valuation-driven bull
case still exists. The immediate “elephant in the room” to address is SILO’s extremely high
PER of current earnings. It is important to emphasise that the nature of hospital assets is that newly-established hospitals typically have long gestation periods and book losses in early years, but if successfully run, generally become highly profitable and cash generative in later years. A PER-based approach will therefore tend to undervalue hospital operators with a significant number of immature hospitals, and SILO is just such an operator at present.
At present, only 4 of SILO’s 17 hospitals are categorized as “mature” by the company, and Fig 7 highlights that the combined revenues of these facilities was running at an annualised rate of about Rp1.6tr in 1H14A (US$133m), or an average of about US$33.2m per hospital (although only US$24.2m excluding the large revenues booked by SILO’s flagship Lippo Village facility). Meanwhile, operating margins averaged 13.4% in 1H14A (EBITDA margins 16.6%). Valued at a 30x unlevered PER (SILO has no net debt at present), these facilities alone would be worth US$400m, or slightly more than Rp4,000 per share (we discuss the appropriateness of a 30x multiple in our valuation section).
Meanwhile, the company’s 13 immature/developing hospitals are generating combined
revenues of only about the same amount (and only about US$9.9m per hospital, or about
70% less than SILO’s mature hospitals on average), and delivering negative operating
margins of –4.1% (although positive 9.1% margin at the EBITDA level). Depreciation is much higher for these facilities relative to sales (13.2%) due to their relatively low revenue bases (absolute depreciation is US$1.3m per facility vs. US$1.1m for mature facilities – higher due to the more recent acquisition of equipment at less favourable exchange rates).
Fig 7 Summary of SILO’s mature vs. immature hospital portfolio
Rp bn Mature Immature/devel. Combined
No. of hospitals 4 13 17
No. of beds (capacity) 867 3,100 3,967
Average hospital size (beds) 217 238 233
Annualised revenues (1H14A) 1,594 1,541 3,136
EBITDA margins (1H14A) 16.6% 9.1% 12.9%
EBITDA 265 141 406
Depreciation to sales (1H14A) 3.2% 13.2% 8.2%
Operating margins (1H14A) 13.4% -4.1% 4.8%
Operating profit (1H14A annualised) 213 -63 150
NOPAT (25% pro forma) 160 -47 113
Average revenue per hospital (US$m) $33.2 $9.9 $15.4
Average revenue per bed (US$ '000) $153.2 $41.4 $65.9
Average depreciation per facility (US$m) $1.1 $1.3 $1.3
Assumed mature state for immature
Revenue per hospital $24.2
EBITDA margins 16.6%
Depreciation to sales ($1.3m/$24.2m) 5.4%
Operating margins 11.2%
NOPAT (Rp bn) 317
Mature earnings (Rp bn) 160 317 477
EPS (Rp) 138 274 413
PER multiple 30.0x 30.0x 30.0x
Valuation (Rp bn) 4,800 9,508 14,308
Valuation (US$m) $400.0 $792.3 $1,192.3
Value per share (Rp) 4,152 8,224 12,376
PER at current price 109.8x 55.4x 36.8x
If these facilities were to eventually achieve US$24.2m in revenues per facility (the same as
the amount being booked by SILO’s mature hospitals excluding Lippo Village); enjoy 16.6% EBITDA margins (on par with SILO’s current mature hospitals); and operating margins of
11.2% (based on US$1.3m pa in depreciation per facility), valued at 30x, they would add an
additional Rp8,200 to SILO’s valuation, and lower SILO’s combined PER at Rp15,200 to only 36.8x – a level that is more broadly on par with regional comps at present.
This also excludes the upside from new hospitals
In addition to the above, SILO has 23–29 new organic hospital in the pipeline, 23 of which are targeted for opening by FY17E (although delays are quite possible). As discussed in our valuation section, a swift profitability ramp up in these facilities could add as much as US$35m in NPV per new hospital, suggesting scope for the addition value accretion of US$700–800m from this hospital pipeline. This would bring SILO’s combined value to closer to Rp20k per share. In addition, further hospital openings post FY17–20E are likely.
However, this new-hospital-NPV is highly sensitive to the pace of occupancy ramp-up, and as we discuss in the following section, we believe the ramp-up will be slower than targeted. In addition, it is important to emphasise that in the case of SILO’s new hospitals, it has not yet incurred the necessarily establishment capex (which is expected to average about US$15m per facility). This capex, which in the aggregate will likely exceed US$300m, will also be 20–
30% higher in rupiah terms vs. the time of SILO’s IPO due the intervening depreciation of the
rupiah (something the market appears to have overlooked). The value accretion of these hospitals will therefore be significantly less the current value of SILO’s existing hospitals.
Nevertheless, SILO’s hospital roll-out pipeline also offers additional blue sky and potentially very attractive long term growth options, if attractive ROICs can be achieved. Our base case
SOTH (“sum of the hospitals”) valuation, which we discuss later in the report, includes an
average NPV accretion of US$20m per hospital across SILO’s 23-hospital pipeline (Fig 8).
Fig 8 Our SOTH (“sum of the hospitals”) valuation*
Hospital category Method US$m Rp bn Per share (Rp)
Mature hospitals 30x PER FY14E earnings $430 5,163 4,466
Immature hospitals 30x FY20E discounted to PV @ 10% $593 7,111 6,151
Future hospitals US$20m per hospital x 23; PVed at 10% $388 4,656 4,027
Net cash/(debt) 2Q14A BV $1 13 11
Total $1,412 16,943 14,656
SILO’s market cap is small relative to its regional peers
Further supporting the valuation case for SILO is the fact that –despite the company’s elevated multiples at present –the company’s market capitalisation of cUS$1.5bn remains significantly below several regional peers – notably its Thai peers. This would seem to imply
the capacity for significant further long term upside. In addition, the company’s multiples on
an EV/bed or EV/hospital basis also comparatively low (at least in relative terms; it is possible that hospital assets in the aggregate are overvalued in Asia at the moment).
We note, however, that (1) SILO’s average bed utilisation is much lower than its peers; (2)
that SILO has a significantly less-developed business, with service standards well below its peer group; and (3) that these comps have a significantly higher quantity of capital deployed (which often took decades to accumulate), and in many cases own rather than lease the relevant hospital premises (which should support a significantly higher EV/bed valuation multiple vs. leased facilities). These comparative metrics may therefore overstate the upside. Nevertheless, they do point to the existence of significant room for future value creation.
Fig 9 Market capitalisations of regional peers Fig 10 Comparative EVs per hospital bed
The bear case: So why the Neutral?
So given the foregoing, why only the Neutral recommendation? The short answer is that we
believe it is likely that SILO’s new hospital profitability ramp-up will be much slower than targeted (SILO is targeting US$25m in revenue, and 18–20% EBITDA margins, within four years – see our appendix), and that investors are also likely underestimating the medium
term execution and earnings risks associated with SILO’s aggressive hospital roll-out. The various risks we discuss in more detail below, which we believe the market may be insufficiently acquainted with, include the following:
Overexpansion risk: New hospitals have long gestations periods, and investing in expensive and rapidly-depreciating medical equipment too far ahead of future demand can result in poor return on capital outcomes, even if occupancy does eventually rise. We
discuss also how SILO’s occupancy rate is already low and declining, and so the
company’s aggressive expansion plans depend on healthcare spending inflecting upwards.
Healthcare spending rising more slowly than expected: We believe this risk is real, due to demographic; affordability; and quality constraints, and note that most of the
inflection in healthcare spending as a percentage of GDP appears to occur at high levels of
income that are far above Indonesia’s present level of GDP per capita. Competition from
regional medical tourism hubs is also likely continue to pressure the domestic healthcare
industry, while Indonesia’s economy slowing economy also poses additional challenges. Finally, the accretion to market demand from Indonesia’s roll-out of universal healthcare could be less than expected, due to c75% of the population already being covered.
Doctors the key bottleneck; not facilities: The primary constraint on the upgrading of domestic healthcare services is not the availability of hospital facilities, but the availability of skilled personnel – a bottleneck that could require decades to redress – and the associated risk that that Indonesia’s pace of hospital build outpaces human capital upgrading, driving inflation in doctor compensation and pressuring hospital margins.
Inappropriate use of comps: Finally, we believe SILO’s business model and margin
prospects are not comparable to the elite group of listed regional hospital companies SILO is frequently compared with, who offer genuinely world class services; service the high-end market; and who benefit from significant inflows of medical tourism. In addition, we
highlight how SILO’s EBITDA margins are also not directly comparable to regional peers, due to its capital light rental model, and inclusion of doctor service fees in its top line.
In the very long term, we are bullish on SILO’s prospects, and believe these challenges can
be overcome. However, the issue with long-term thematic stories is often not the long run but rather the short run – particularly when starting valuations are high. Indeed, we find it
something of a delicious irony that bull cases for the stock are premised on 20-yr supportive thematics when the holding periods of most investors continues to shorten and is generally less than 24–36mths. We believe a better entry point is likely to present itself along the way.
New hospitals have long gestation, introducing overexpansion risks
In contrast to the typical incremental, measured approach to expansion adopted by hospital
operators, SILO is adopting a “foot to the floor” approach, and aiming to essentially triple its
hospital network in five years, from 13 hospitals in April 2013 to 40 by FY17E. This is one of the most aggressive hospital roll-out stories we can identify globally.
Mayapada’s experience highlights the risk of overinvestment
One of the clearest examples of the impact of over-expansion is SILO’s IDX-listed hospital peer SRAJ (Not Rated), which operates two Mayapada-branded hospitals. Mayapada acquired its first hospital in 2008 (which was originally opened in 1995, and therefore already mature and well established), and until late 2013, the company was quite profitable. However, in late 2013, the company opened a new upscale facility in South Jakarta, and since that time, the company has suffered huge losses, as rates of utilisation have disappointed.
Fig 11 Trend in Mayapada margins Fig 12 Trend in Mayapada revenues
Source: SRAJ Company data, Macquarie Research, October 2014 Source: SRAJ Company data, Macquarie Research, October 2014
We have visited the facility, and to the naked eye, it seems very impressive, and sports all the latest state-of-the-art equipment. However, looks can be deceptive, and Mayapada’s P&L
highlights that the “build it and they will come” approach to expansion will not necessarily work, despite the apparent vast under-servicing of the domestic market.
Mayapada’s experience appears to partly reflect company-specific execution issues, and the company having made the mistake of targeting its hospitals too much to the high end (as this market travels overseas), and its losses are far above those typically being booked by SILO
on its upstart hospitals. Nevertheless, Mayapada’s experience does serve to highlight (1) the
risks/costs of investing too far ahead of future demand; and (2) that the major constraint on the development of world class healthcare services in Indonesia is not a scarcity of facilities or equipment, but rather the inability to staff them with sufficiently well-trained doctors.
Furthermore, because the bulk of upfront capex is committed to the acquisition of advanced medical equipment, which owing to the rapid pace of innovation in medical device technology tends to age/depreciate rapidly, the economic cost of overexpansion can be high, and result in extended periods of losses/poor returns on capital. As we discuss in our valuation section, the sensitivity of the NPV of new hospital openings to the pace of ramp-up is significant, and extended lead-times on the ramp-up of new facilities can quickly reduce their NPV to zero.
SILO’s occupancy rates are already low and falling
Notable is that since the commencement of SILO’s rapid hospital roll-out programme in 2011,
SILO’s occupancy rates (and hence profitability) has been falling, from 44.8% in FY11A, to an estimated 28.8% in FY13A. This improved slightly to an estimated 32.9% in 1H14A, due to
the delayed opening of new hospitals, and the contribution from SILO’s two BIMC Bali
hospital acquisitions in late 2013, but we expect occupancy rates to come under renewed
pressure as new hospital additions ramp up from late 2014. SILO’s aggressive hospital roll -out plan is therefore coming at a time when occupancy rates are already low and falling.
We note that SILO calculated its occupancy rates in its IPO prospectus on the basis of
operational beds, whereas we are using total hospital bed capacity (i.e. the number of beds
SILO’s hospital are designed to accommodate). At the time of SILO’s IPO, its operational
beds were only 49.6% of capacity. However, we believe SILO’s approach acts to significantly overstate capacity utilisation, as the incremental capex and addition to overall hospital fixed 23.4%
FY10a FY11a FY12a FY13a 1H14a
EBITDA margins
FY10a FY11a FY12a FY13a 1H13a 2H13a 1H14a
Furthermore, while the company’s EBITDA margins have remained relatively stable in recent years at about 11% (although they increased to 14.7% in 1Q14A, before declining to 12.0% in 2Q14A),1 its
operating (i.e. EBIT) margins have been falling, due to escalating depreciation charges alongside the rapid capacity additions SILO has instituted. And it is in this line item
that the cost of SILO’s declining occupancy levels can be clearly observed.
Fig 13 Trend in occupancy rate (vs. bed capacity) Fig 14 Trend in SILO’s EBITDA/operating margins
Source: Company data, Macquarie Research, October 2014 Source: Company data, Macquarie Research, October 2014
The company encourages the market to focus on EBITDA, where SILO’s margin and
earnings trend appears more encouraging. However, in SILO’s case, we believe depreciation
is a fundamentally important and very real expense category, as maintaining state-of-the-art
equipment is core to SILO’s operating model, and such equipment needs to be upgraded
from time-to-time to stay abreast of the latest technological trends. Poor utilisation rates during equipment lifecycles therefore represent a real loss to SILO.
SILO also downplays the extent of ongoing maintenance capex demands, but it is notable
that SILO’s mature hospitals have seen maintenance capex routinely exceed depreciation costs in recent years (Fig 15) – something that will likely continue to be the case over time
due to Indonesia’s high inflation rate.2
Consequently, not only is depreciation a real expense, but it actually understates ongoing cash demands (on a long term basis).
Fig 15 Capex vs. depreciation on mature facilities Fig 16 SILO EBIT, depreciation, and EBITDA trend
Source: Company data, Macquarie Research, October 2014 Source: Company data, Macquarie Research, October 2014
1We note that SILO’s
FY10–13A EBITDA margins shown in Fig 13 is below what was outlined in SILO’s prospectus and its presentation materials. This is because SILO’s definition of EBITDA previously excluded several cost items, such as provisions for post-employment employee entitlements, which we consider to be a genuine expense categories which have no justification for being excluded from EBITDA. However, we note that SILO’s treatment in 1H14A has since normalised to reflect the methodology we are using.
2
Excludes Lippo Cikarang in FY11A and FY12A due to a lack of disclosure by SILO. 44.8%
FY10a FY11a FY12a FY13a 1H14a
EBITDA margins Depreciation-to-sales EBIT margins
62.8
FY10a FY11a FY12a FY13a 1H14a
Rp bn
FY10a FY11a FY12a FY13a 1H13a 1H14a
Rp bn
Operating profits Depreciation
Also notable is the fact that in the pre-IPO period, SILO’s funding costs were being carried by LPKR via the provision of interest-free inter-company loans. No such luxury will be available with respect to future capex, which is likely to exceed US$300m over the next 3–4yrs (although this may be partly equity funded). Funding costs in Indonesia are high at the moment (typically double-digit), and SILO’s ROE is already only c5%. Rapidly rising depreciation and funding costs, coupled with at best break even EBITDA outcomes on new hospital openings, could quickly push SILO into loss-making territory.
Cannibalisation risk exists
In addition, it is noteworthy that SILO’s mature hospitals experienced a sharp slowdown in
revenue growth during 1H14A, to 5.6% YoY in 1Q14A, and to 7.4% YoY in 2Q14A – rates of
growth that are only, at best, marginally above Indonesia’s CPI. The aggregate number of OPD and IPD visits to SILO’s mature hospitals was also roughly flat YoY in 1H14A. This likely
contributed to the decline in mature hospital EBITDA margins to 16.6% in 1H14A, from 19.0% in the pcp, as hospital level cost inflation is likely running above the pace of CPI.3
While a slowing economy has likely contributed, it is also possible that this slowdown partly
reflects growing cannibalisation from SILO’s newer hospitals, and this cannibalisation impact
might increase in coming years. Notable is that SILO expects to add an additional 23
hospitals between now and FY17E, but only intends to increase the number of cities in which it is present from 13 to 25. By implication, that means that approximately half of these new openings will be in cities that already have a SILO hospital facility (see Fig 17).
Fig 17 SILO’s hospital footprint and expansion plans by geography
Source: SILO 2Q14A investor presentation, Macquarie Research, October 2014
Healthcare spending may ramp up more slowly than expected
SILO’s rapid capacity addition plan, despite its existing low and declining occupancy rates,appears to represent an implicit bet that Indonesian private healthcare demand is set for a very sharp upward inflection in coming years. And given the under-serviced nature of
Indonesia’s healthcare industry, many might quite reasonably argue that the risk of
overexpansion is limited. And the bulls might well be proven right. Nevertheless, we believe the risk needs to be explored, because SILO’s share price appears to be pricing in the said inflection, and we believe the risks are higher than the market (and SILO) believes.
While analysts frequently highlight the fact that healthcare spending in Indonesia remains low by international standards, the reasons why this is the case are seldom explored, and we believe the market is actually underserviced for good reason:
Demographics: Healthcare spending is highly correlated with the size of the elderly population – a fact that is demonstrated amply by Fig 19 – and Indonesia’s population is young, with a median age of just 29yrs. Furthermore, in general, high income countries have much older average populations (Fig 18). The difference in spending as a percentage of GDP may therefore have as much to do with demographics as income levels.
Fig 18 Demographic profile Fig 19 US annual hospital spend per capita (2004)
Source: WHO Health Statistics, Macquarie Research, October 2014 Source: US hospital industry report, Macquarie Research, October 2014
Affordability: The vast bulk of the Indonesian population cannot afford the type of private hospital services SILO provides, and are forced to rely on public healthcare services, and
while public spending has been rising, it has remained constrained by Indonesia’s low
GDP per capita; low tax-to-GDP ratio; and wasteful use of fiscal resources. Economic growth will drive rising affordability over time, but the process is inherently slow, and for the time being, the outlook for Indonesia’s economic growth is rapidly deteriorating.
Quality deficiencies, driven by the low quality of domestic doctors: This constraint
has the effect of limiting the perceived “value for money” of expensive domestic private healthcare services (vs. public services), and driving large and growing outflows of medical tourists to competing regional markets such as Singapore, Malaysia, and Thailand.
None of these factors – perhaps barring the outlook for government spending on healthcare (see below) – looks set to change rapidly. Furthermore, also seldom pointed out is the fact that Indonesia’s healthcare spending as a percentage of GDP has actually been flat for almost a decade (Fig 20), in spite of a booming economy and the putative vast level of market under-servicing (which is to some extent inconsistent with SILO’s low occupancy rates).
Fig 20 Indonesian healthcare spending to GDP Fig 21 Change in spending by group: 2000–11
Source: WHO, Macquarie Research, October 2014 Source: WHO Health Statistics, Macquarie Research, October 2014 6%
% of population >60yo Median age (RHS)
0-18 19-44 45-54 55-64 65-74 75-84 85+
0.8% 1.0% 1.0% 0.9% 1.0% 1.2% 1.1% 1.1% 1.1% 0.9% 1.2%
2002 2003 2004 2005 2006 2007 2008 2009 2010 2011 2012
Indonesia’s experience does not seem unique in this regard, as according to the WHO lower-middle and upper-lower-middle income countries in the aggregate only experienced a 30–40bp increase healthcare spending as a percentage of GDP in the 11 years to FY11A (which was a decade that was an economic boon for emerging countries). Furthermore, the gap in
healthcare spending between lower-middle and upper-middle income countries (Indonesia is
part of the “lower-middle income” group in WHO’s statistics) is not particularly large (Fig 21). Furthermore, life expectancies – arguably the most all-encompassing measure of the
adequacy of healthcare services – have been rising rapidly in most markets, with the average life expectancy in low, lower-middle, and upper-middle income countries increased from 53 to 62yrs; 59 to 66yrs; and 68 to 74yrs, respectively, during 2000-11 – a trend which is
inconsistent with the putative vast level of market under-servicing in these regions. Furthermore, in Indonesia, it rose from 62yrs to 71yrs – outperforming its peer group.
In addition, Fig 21 highlights that where the most rapid increases in healthcare spending occur is in the high echelons of incomes, and it is notable that the vast majority of the OECD countries that comprise this group have (1) very different demographic profiles to Indonesia (i.e. rapidly aging populations); and (2) extremely well-developed and funded public healthcare systems, reflecting the wealthy status of these nations.
Lastly, Indonesia’s economy is in the midst of a rapid economic slowdown at present, as it
comes out of a commodity- and liquidity-fuelled economic boom, the supporting conditions of which are now rapidly receding. Slowing economic growth is also likely to significantly dampen the pace of increased demand for private hospital services.
Boost to demand from UHC may be less than expected
We believe it is likely that the roll-out of universal healthcare (UHC) will accelerate healthcare spending growth in Indonesia, and will likely benefit private hospital operators via the
“crowding out” effect of overburdening public healthcare resources, thereby driving a forced upgrading to private services (which appears to have occurred in Thailand post the 2002 implementation of UHC). In addition, an increase in government-funded referral business is likely. However, the demand accretion may be less than is presently expected, as:
As at 2011–12, an estimated 151.5m Indonesians were already covered by some form of health insurance (Fig 22), representing approximately 60–65% of Indonesian’s population, and MoH data indicates that this coverage had increased further to 181.3m people as of 2013, or 76.2% of the population (based on the 238m population base used by the MoH, which is likely slightly understated). This rate of penetration has likely increased further during 2014, and the full roll-out to 100% is expected to occur only gradually, by 2019. The boost to demand will therefore be incremental in nature, rather than a step change.
Owing to very low quality standards in existing public healthcare services, those that can afford private healthcare have likely already upgraded where possible.
The roll-out in universal healthcare is expected to be accompanied by a significant lift in public sector healthcare service provision over time (e.g. 150 public hospitals are currently
under construction), and Jokowi’s presidency will likely result in improved execution on this
front. This may act to partly counteract the forced-upgrading demand noted above.
Fig 22 Health insurance coverage in Indonesia (as at 2012)
Type of health insurance M people
Health Insurance for civil servants (Askes PNS) 17.3
Military and police (TNI/Polri) 2.2
Health insurance for the poor (Jamkesmas) 76.4
Workers' social security (JPK Jamsostek) 5.6
Regional governments' health insurance (Jamkesda) 31.9
Corporate insurance (self insured) 15.4
Commercial health insurance participants 2.9
Total 151.5
UHC is also a double-edged sword that could impact margins
In addition, while private hospital operators are likely to benefit from a volume standpoint from UHC (and increased public spending on healthcare generally), this benefit is likely to be at least partly counter-balanced by significantly lower pricing on growing levels of referral business from government clinics. Indeed, SILO’s reimbursement rates for government-funded patients are currently about 30–40% below what it charges out-of-pocked customers.
UHC participants are required to directly consult public health clinics (Puskesmas) in order to receive government-funded care, and complex procedures are then sometimes referred on to private hospitals. This is designed to try and change the typical practice of people consulting hospitals directly, which is rife with conflicts of interest, given the incentives hospital groups have to over-prescribe surgical remedies when much more basic care would suffice. In preparation, SILO is in the process of securing accreditation for its hospitals to enable the acceptance of government-referred business, and has constructed a large (664 bed) RSUS (Siloam General Hospital) facility to service low-end, primarily government-funded patients.
This likely represents the beginning of a long term mix shift in the composition of SILO’s payer groups away from predominantly out-of-pocket customers, who have limited bargaining power and are therefore the most profitable payer group, to business funded predominantly by government or private insurance, who on account of their scale enjoy vastly superior bargaining power and can negotiate lower prices. The difference in pricing is already clearly evident in RSUS’s average IPD revenues per patient being only Rp7.3m, vs. Rp20.5m for
SILO’s mature hospitals (in 1H14A). The impact of lower margins may or may not be offset by higher occupancy rates, but it is unlikely SILO will enjoy both high prices and rising volumes.
Fig 23 SILO’s payer mix (as at May 2013) Fig 24 SILO average IPD revenue per patient (1H14A)
Source: SILO IPO prospectus, Macquarie Research, October 2014 Source: Company data, Macquarie Research, October 2014
Interesting to note in this regard is the fact that Thailand’s Bangkok Chain Hospital elected to
pull out of servicing government-sourced patients in 2010, and accepted a 40% decline in its volumes, due to the said volumes being insufficiently profitable to justify continued servicing.
Long term margin targets in line with regional peers are unlikely to
be achieved
Due to the different composition of payer groups (primarily), DM private hospital companies typically deliver lower margins than EM operators, with best in class operators generally making no more than about a 15–18% EBITDA margins, with second-tier operators earnings much less. Returns are also much lower in stressed markets where government funding is being cut, such as in certain European countries (e.g. France). However, in regional Asia, hospital operations frequently earn margins as high as 20–30%. Consequently, analysts have been quick to conclude that SILO ought to be able to achieve 20–30% margins as well.
Out-of-However, there are very important nuances that have been overlooked with this simplistic approach. The reason these regional hospitals are so profitable is that they cater to the very high end market, where both affordability and willingness to pay are high, and price sensitivity low, and they able to service this market because they have developed service levels that are of a truly world class standard. Furthermore, due to their very high levels of international competitiveness (high service levels coupled with relatively low prices), they have been able to attract medical tourists from international markets as well (especially from Indonesia).
Fig 25 DM private hospital EBITDA margins Fig 26 Regional Asian hospital EBITDA margins
Source: Bloomberg, Macquarie Research, October 2014 Source: Bloomberg, Macquarie Research, October 2014
It is important to emphasise that SILO is not servicing this market (excluding emergency services, which are localised by necessity). This market flies to Singapore, Malaysia, and
Thailand for their medical treatment. As a result, unless and until SILO succeeds in “bridging the credibility gap” and raising domestic healthcare standards to the point where some of this lost demand begins to be repatriated (which is an opportunity longer term), the margins delivered by this peer group are likely an inappropriate benchmark for SILO – particularly as the mass market moves towards more government-funded patients, as discussed above.
In addition, two further crucially important nuances have generally been lost the discussion, and mean that SILO’s 18–20% EBITDA margin target is far higher than it first appears:
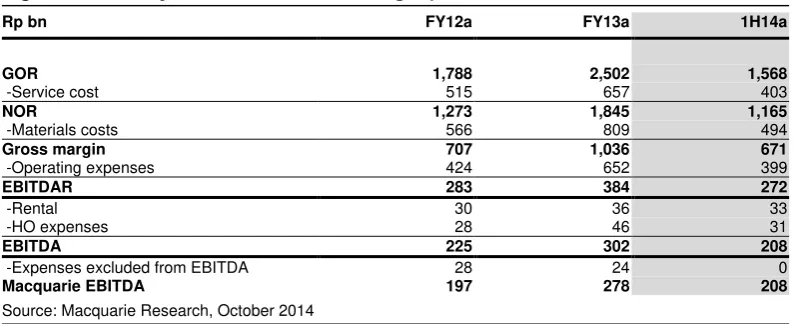
Top line is gross rather than net operating revenues: SILO includes 100% of gross operating revenues (GOR) in its top line, which include pass-through service charges paid to doctors, whereas the general industry practice globally is to include only net revenues (NOR) in top line, which excludes these pass-through fees. SILO’s NOR-to-GOR margin is currently in the low 70%s (see Fig 27 below), and consequently, a 20% EBITDA margin on GOR is actually equivalent to an approximate 30% EBITDA margin vs. NOR.
Fig 27 SILO’s EBITDA margins on gross operating revenues vs. net operating revenues
FY12a FY13a 1H14a FY12a FY13a 1H14a
Source: Macquarie Research, October 2014, *These differ from our EBITDA estimates for FY12–13A, as SILO presented its FY12–13A EBITDA margins in this format with EBITDA defined as to exclude certain costs, such as post employment benefits.
SILO rents rather than owns its hospital premises: In addition, the standard practice in most markets is for hospitals operators to own rather than lease their premises, whereas with relatively few exceptions, SILO is leasing its premises off its LPKR parent (which LPKR generally sub-leases, in turn, from its SGX-listed REIT FIRT). As a result, SILO’s operating margins ought to be about 3% below peers who own properties on a gross-revenue basis, and closer to 4% below on a net-gross-revenue basis, all else held constant.
A shortage of skilled doctors is the major market bottleneck
There is a major long-term opportunity for SILO if it is able to “bridge the credibility gap”; raise domestic healthcare standards to international levels; and begin to repatriate lost international tourism demand back to Indonesia. However, it is important to appreciate that the biggest constraint on the upgrading of domestic healthcare services in Indonesia is not the lack of available hospital beds or equipment (more are still required, but they can be – and are being
– installed relatively easily) but rather an acute shortage of doctors/healthcare personnel of a sufficiently high standard, and a substantial quantity of anecdotal evidence indicates that the gap in quality standards between local and DM doctors is vast.
Unfortunately, the lead times on the upgrading of human capital are much longer than on constructing new hospitals. It takes 6–8 years for doctors to become qualified GPs, and a further 3–7 years of training to become qualified specialists. Furthermore, the quality of training processes themselves are in need of upgrading, and the problem is further exacerbated by the onerous restrictions Indonesia places on foreign doctors practicing in Indonesia. This crucial bottleneck is therefore unlikely to be resolved any time soon.
Medical tourism necessitates competition with regional players
If healthcare services were a pure non-tradable service, one could respond to the above by noting that the standards SILO provides need not meet international standards – they merely need to be the best that is available in Indonesia. However, one challenge here is that the forces of globalisation and rising international travel have begun to change healthcare’s hitherto non-tradeable status via. a rise in medical tourism/travel – particularly for more expensive and complex procedures, where hospitals make most of their money.
In addition, and quite unfortunately for SILO, Indonesia is located in close geographic proximity to several of the most internationally competitive healthcare providers in the world – namely Malaysia, Thailand, and Singapore (on the dual basis of cost and service quality) – and many of these players are opening and expanding local marketing branch outlets in Indonesia to attract increased medical tourism traffic into these markets.
Domestic competition for doctors could pressure margins, if
hospital build exceeds the pace of doctor upgrading
A related issue is that a shortage of high quality doctors implies that competition for competent medical personnel is likely to increase. In capitalism, rents accrue to where the scarcity value lies, and if, as seems likely, the quantity of world class facilities increases faster than the quantity of world class doctors, it is reasonable to expect doctor wage inflation to accelerate and to a point that pressures the profitability of private hospital operators.
Fig 28 Major hospital players and growth plans
Player Hospitals Growth plans
Siloam 17 40 hospitals by 2017
Mitra Keluarga 10 2 new hospitals pa
Awal Bros 8 Selective new additions
Ramsay Sime Darby 3 Nothing announced but future openings likely
Omni Hospital 2 Two more hospitals planned
Mayapada 2 Two more planned by 2016
KPJ Healthcare 2 Looking for additional acquisitions Ciputra Hospital 1 15 hospital openings planned
As noted, the putative shortage of beds in Indonesia exists despite the fact that operators such as SILO and Mayapada currently have low occupancy rates. Furthermore, a significant number of new hospitals appear to be in the pipeline, with most major players planning ongoing expansions of their networks, while other property groups such as Ciputra and Pakuwon Jati are also planning aggressive moves into the hospital sector (particularly Ciptura), and appear to be following Lippo Karawaci’s lead in this respect.
In addition, several high calibre regional players will likely consider moving into Indonesia, some of which may be able to bring across significant existing brand equity. KPJ is already present in Indonesia, with two hospitals; IHH is currently considering an entrance into Indonesia; while Ramsay, who was previously independently operating three hospitals in Indonesia, recently partnered with Sime Darby, and ongoing expansions are likely.
Premature to in
clude SILO in this “elite” hospital group
Since SILO’s listing, it has quickly become popular – perhaps understandably – to compare the company to listed regional peers. However, it is important to recognise that there are vast differences between these companies and SILO:
First and foremost, all of these players have highly internationally competitive private hospital businesses, which marry service excellence of a truly international standard with pricing that is well below global averages (for the latter, particularly in Malaysia and Thailand). These companies therefore not only dominate their domestic high-end medical industries, but also benefit from significant inflows of medical tourism as well. Meanwhile, Indonesian service standards are significantly below the quality of care availability in these markets, while SILO’s hospital pricing is typically as or more expensive.
Secondly, these businesses were not established overnight, but rather took decades to build to their present level of service standards, and in the process to develop their well-deserved reputation for clinical excellence. By comparison, as recently as 2011, SILO operated only four hospitals, only one of which it independently established organically (Cikarang in 2002, which is still relatively unprofitable; Lippo Village was established in
partnership with Gleneagles; while SILO’s Kebun Jeruk and Surabaya facilities were acquired). In addition, only one of SILO’s 17 facilities has achieved JCI accreditation.
Conclusion
In short, we believe the market may have jumped the gun somewhat, and priced SILO as if it had already established itself as one of the only providers of world-class and internationally competitive healthcare services in Indonesia, whereas in reality it has not done so as yet – it merely has the opportunity to do so in the future. The market also appears to be overlooking the reality that it is after hospitals become well established and profitable that they become highly valuable assets – not before, when successful execution is still not assured, and where many years of intervening losses/poor returns on capital may still stand in between.
Nevertheless, with that said, we believe SILO still stands the best chance of being the first
hospital group to successfully “bridge the credibility gap” – albeit likely over a multi-decade horizon – and we believe it will probably succeed. And the eventual prize if it does so is large.
In addition, SILO’s aggressive expansion plans position it well to remain the market leader in the long term. We simply believe there may be better entry points along the way – if only because the stock experiences an extended period of stagnation rather than majorly de-rates.
Valuation
Combined DDM valuation
We summarise our base case DDM valuation in Fig 29 below, which utilises the earnings forecasts discussed later in the note, and a FY20E terminal year. Although we do not expect SILO to pay material dividends during this period (SILO’s targeted payout is 10% up until earnings of Rp150bn, and 15% thereafter), we view our model as a “discounted future share
price model, adjusted for dividends”, with the most important variable – the terminal value – linked to more intuitive target multiples rather than abstract terminal growth rates.
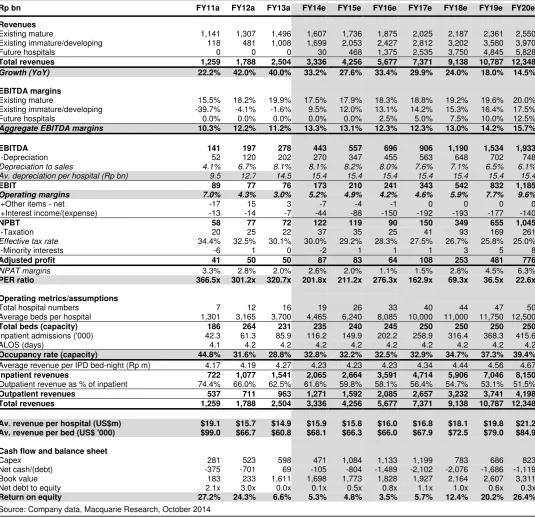
Our forecasts anticipate a 25.6% revenue CAGR out to FY20E; an expansion in EBITDA margins to 15.7% by FY20E (FY13A 11.1%); and an expansion in operating margins to 9.6% (FY13A 3.0%), supported by a decline in SILO’s average depreciation-to-sales ratio to 6.1% by FY20E, from 8.1% in FY13A. FY20E ROE is targeted at 26.4%, with SILO’s average gearing having declined to 0.33x debt/equity, after having peaked at 1.0x in FY17E. We have utilised a terminal-year PER of 40.0x, and a 10.0% nominal discount rate.
We emphasise again that although our forecasts are below SILO’s targets, they still factor in a reasonably successful ramp-up in SILO’s new hospitals and margins over our forecast window, whereas we execution risks vs. these base case estimates are substantial.
Fig 29 DDM valuation summary
Rp bn FY13a FY20e CAGR
Key financials
Revenue 2,504 12,348 25.6%
EBITDA margin 11.1% 15.7% 5.0%
Depreciation to sales 8.1% 6.1% -4.0%
EBIT margin 3.0% 9.6% 17.9%
Operating EBITA 76 1,185 48.1%
NPAT (adjusted) 50 776 48.0%
Parent book value 1,611 3,311 10.8%
Return on equity 6.6% 26.4% 21.9%
Debt-to-equity -0.04x 0.33x
Other key assumptions
Equity cost of capital 10.0%
Terminal PER 40.0x
Terminal P/BV 9.2x
Average dividend payout 10.6%
Valuation per share 14,887
Source: Company data, Macquarie Research, October 2014
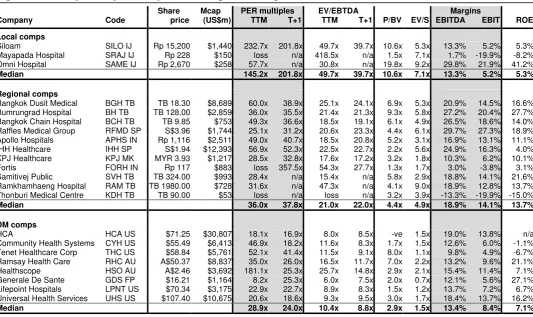
We believe a 40x terminal PER is realistic. As is shown in Fig 30 overleaf, hospital assets in Asia are highly-rated assets, with multiples generally in the 30–40x range (with a median of 36x TTM, and 38x T+1 earnings, for the sample group shown below), and by FY20E, SILO’s profit margins will be continuing to ramp up, so we anticipate that by this point, SILO will reporting strong earnings growth; robust cash flow; and strong returns on capital. We also
note that SILO’s high terminal-year P/BV of 9.2x vs. comps reflects the company’s “asset
light” approach of leasing its hospital buildings, and so is achievable in our view.
Multiples of developed-world hospital companies are somewhat lower, averaging closer to 20–25x (which is still a significant multiple premium to the market averages), reflecting (1) the perceived weaker growth outlook in developed markets; and (2) in some instances, the outlook for ongoing cuts to government reimbursement rates as governments look to pare spiralling healthcare costs (albeit that the share prices of many US-based hospital companies have rallied sharply in recent times as the impact has proven more benign than expected).
Fig 30 Summary of hospital comps – local, regional, and global/DM
Share Mcap PER multiples EV/EBTDA Margins
Company Code price (US$m) TTM T+1 TTM T+1 P/BV EV/S EBITDA EBIT ROE
Local comps
Siloam SILO IJ Rp 15,200 $1,440 232.7x 201.8x 49.7x 39.7x 10.6x 5.3x 13.3% 5.2% 5.3% Mayapada Hospital SRAJ IJ Rp 228 $150 loss n/a 418.5x n/a 1.5x 7.1x 1.7% -19.9% -8.2% Omni Hospital SAME IJ Rp 2,670 $258 57.7x n/a 30.8x n/a 19.8x 9.2x 29.8% 21.9% 41.2%
Median 145.2x 201.8x 49.7x 39.7x 10.6x 7.1x 13.3% 5.2% 5.3%
Regional comps
Bangkok Dusit Medical BGH TB TB 18.30 $8,689 60.0x 38.9x 25.1x 24.1x 6.9x 5.3x 20.9% 14.5% 16.6% Bumrungrad Hospital BH TB TB 128.00 $2,859 36.0x 35.5x 21.4x 21.3x 9.3x 5.8x 27.2% 20.4% 27.7% Bangkok Chain Hospital BCH TB TB 9.85 $753 49.3x 36.6x 18.5x 19.1x 6.1x 4.9x 26.5% 18.6% 14.0% Raffles Medical Group RFMD SP S$3.96 $1,744 25.1x 31.2x 20.6x 23.3x 4.4x 6.1x 29.7% 27.3% 18.9% Apollo Hospitals APHS IN Rp 1,116 $2,511 49.0x 40.7x 18.5x 20.8x 5.2x 3.1x 16.9% 13.1% 11.1% IHH Healthcare IHH SP S$1.94 $12,393 56.9x 52.3x 22.5x 22.7x 2.2x 5.6x 24.9% 16.3% 4.0% KPJ Healthcare KPJ MK MYR 3.93 $1,217 28.5x 32.8x 17.6x 17.2x 3.2x 1.8x 10.3% 6.2% 10.1%
Fortis FORH IN Rp 117 $883 loss 357.5x 54.3x 27.7x 1.3x 1.7x 3.0% -3.8% 3.1%
Samitivej Public SVH TB TB 324.00 $993 28.4x n/a 15.4x n/a 5.8x 2.9x 18.8% 14.1% 21.6% Ramkhamhaeng Hospital RAM TB TB 1980.00 $728 31.6x n/a 47.3x n/a 4.1x 9.0x 18.9% 12.8% 13.7% Thonburi Medical Centre KDH TB TB 90.00 $53 loss n/a loss n/a 3.2x 3.9x -13.3% -19.9% -15.0%
Median 36.0x 37.8x 21.0x 22.0x 4.4x 4.9x 18.9% 14.1% 13.7%
DM comps
HCA HCA US $71.25 $30,807 18.1x 16.9x 8.0x 8.5x -ve 1.5x 19.0% 13.8% n/a
Community Health Systems CYH US $55.49 $6,413 46.9x 18.2x 11.6x 8.3x 1.7x 1.5x 12.6% 6.0% -1.1% Tenet Healthcare Corp THC US $58.84 $5,761 52.1x 41.4x 11.5x 9.1x 8.0x 1.1x 9.8% 4.9% -6.7% Ramsay Health Care RHC AU A$50.37 $8,837 35.0x 26.0x 16.5x 11.7x 7.0x 2.2x 13.2% 9.6% 21.1% Healthscope HSO AU A$2.46 $3,692 181.1x 25.3x 25.7x 14.8x 2.9x 2.1x 15.4% 11.4% 7.1% Generale De Sante GDS FP $16.21 $1,164 8.2x 25.3x 6.0x 7.5x 2.0x 0.7x 12.1% 5.6% 27.1% Lifepoint Hospitals LPNT US $70.34 $3,175 22.9x 22.7x 8.9x 8.3x 1.5x 1.2x 13.7% 7.2% 6.7% Universal Health Services UHS US $107.40 $10,675 20.6x 18.6x 9.3x 9.5x 3.0x 1.7x 18.4% 13.7% 16.2%
Median 28.9x 24.0x 10.4x 8.8x 2.9x 1.5x 13.4% 8.4% 7.1%
Source: Bloomberg (priced on 6 October 2014), Macquarie Research, October 2014
SOTH approach (“Sum of the hospital”)
Another valuation approach to value SILO as a composite of three separate components: (1) its mature hospitals; (2) its portfolio of existing immature/developing hospitals; and (3) the
company’s new hospital pipeline. Fig 31 highlights a scenario which utilises this approach, which yields results broadly consistent with our DDM valuation.
Under this approach, we have valued SILO’s existing mature hospitals at 30x FY14E earnings. This multiple is generally below the level at which regional comps trade at, but it is important to recognise that the multiples regional comps trade at includes the optionality of future hospital openings, whereas we are valuing these growth options separately. On the other hand, it is difficult find any hospital assets in emerging Asia that trade below 30x, and these hospitals do have long term growth options in the form of brownfield expansions. The multiple we have used is also an unlevered multiple, whereas many regional comps carry some debt. Overall, we therefore view 30x as a full but not unreasonable assumption.
Fig 31 SOTH valuation approach
Hospital category Method US$m Rp bn Per share (Rp)
Mature hospitals 30x PER FY14E earnings $430 5,163 4,466
Immature hospitals 30x FY20E discounted to PV @ 10% $593 7,111 6,151
Future hospitals US$20m per hospital x 23; PVed at 10% $388 4,656 4,027
Net cash/(debt) 2Q14A BV $1 13 11
Total $1,412 16,943 14,656
Source: Macquarie Research, October 2014
For SILO’s immature hospitals, we have valued them on 30x FY20E earnings, with the
The final component of SILO’s valuation, and the most sensitive and difficult to quantify, is the
value of SILO’s pipeline of future hospital openings. This valuation is highly sensitive to the expected pace and extent of the future profitability ramp up of these hospitals. Based on
SILO’s targeted ramp-up (see the appendix to this report), we estimate that every new hospital will have an NPV of about US$36m when established (with a 10% discount rate). However, we expect the realistic pace of new hospital ramp-ups to be below SILO’s targets.
We run a base case scenario in Fig 32 below for an individual new hospital ramp-up, utilising assumptions we believe to be more achievable (but still aggressive). Our model envisages a ramp-up in revenues to US$24.4m per hospital delivering 17.5% EBITDA margins over an eight year horizon, utilising a terminal-year valuation of 30x. Under these assumptions,
SILO’s new hospital openings would be worth about US$20m per opening on an NPV basis.
The US$388m valuation shown in Fig 31 for 23 hospital openings (US$460m gross amount), discounts for the time delay associated with these 23 hospitals being opened in a phased manner during 2H14–FY17E. We have ignored future hospital openings beyond SILO’s target of opening 23 hospitals by FY17E, so our approach slightly undervalues SILO’s pipeline.
Fig 32 Valuation scenario for new hospital openings
Year 0 1 2 3 4 5 6 7 8
P&L
Beds 250 250 250 250 250 250 250 250 250
Average occupancy 15.0% 20.0% 24.2% 28.3% 32.5% 36.7% 40.8% 45.0% Total number of bed-nights ('000) 13.7 18.3 22.1 25.9 29.7 33.5 37.3 41.1
Av. revenue per bed-night (Rp m; 5% growth) 3.5 3.7 3.9 4.1 4.3 4.5 4.7 4.9
Inpatient to outpatient revenue multiple 1.60x 1.57x 1.55x 1.53x 1.51x 1.49x 1.47x 1.45x
Revenues (Rp bn) 77 105 132 160 191 223 257 293
USD/IDR 12,000 12,000 12,000 12,000 12,000 12,000 12,000 12,000
Average revenues (US$m) 6.4 8.8 11.0 13.4 15.9 18.6 21.4 24.4
EBITDA margin 0.0% 0.0% 3.5% 6.3% 9.1% 11.9% 14.7% 17.5%
EBITDA (US$m) 0.0 0.0 0.4 0.8 1.4 2.2 3.1 4.3
-Depreciation (8yr dep term) 1.6 1.6 1.6 1.6 1.6 1.6 1.6 1.6
Depreciation to sales 24.5% 17.8% 14.2% 11.7% 9.8% 8.4% 7.3% 6.4%
EBIT -1.6 -1.6 -1.2 -0.7 -0.1 0.6 1.6 2.7
Taxation (25%) -0.4 -0.4 -0.3 -0.2 0.0 0.2 0.4 0.7
NPAT -1.2 -1.2 -0.9 -0.5 -0.1 0.5 1.2 2.0
Cash flows
NPAT -1.2 -1.2 -0.9 -0.5 -0.1 0.5 1.2 2.0
Depreciation 1.6 1.6 1.6 1.6 1.6 1.6 1.6 1.6
Capex (ex maintenance) -12.5 0.0 0.0 0.0 0.0 -1.6 -1.6 -1.6 -1.6
Working capital -2.5 0.0 0.0 0.0 0.0 0.0 0.0 0.0 0.0
Total FCF -15.0 0.4 0.4 0.7 1.0 -0.1 0.5 1.2 2.0
Balance sheet
Fixed assets 12.5 10.9 9.4 7.8 6.3 6.3 6.3 6.3 6.3
Working capital 2.5 2.5 2.5 2.5 2.5 2.5 2.5 2.5 2.5
Average CCC (days) 143 104 83 68 57 49 43 37
Valuation
Terminal PER 30.0x
Terminal value 61.1
Discounted terminal value 28.5
DCFs -15.0 0.4 0.4 0.7 1.0 -0.1 0.5 1.2 2.0
Discount rate 10%
Total value (US$m) $19.6
Source: Company data, Macquarie Research, October 2014
We emphasise, however, that the NPV accretion per new hospital is highly sensitive to the pace of ramp-up; the extent of ramp up; and the terminal EBITDA margins achieved. For example, if terminal year EBITDA margins were only 15%, this NPV accretion would fall to only US$12.1m; and if terminal-year revenues were also only US$20m, then the NPV accretion would fall to only US$4m (not far above break-even). This highlights that any material overinvestment that results in significant delays in the ramp-up of SILO’s new hospital revenues and profitability could result in a significant erosion in the value embedded