2015 International Conference on Information Technology Systems and Innovation (ICITSI) Bandung – Bali, November 16 – 19, 2015
ISBN: 978-1-4673-6664-9
WSN Infrastructure for Green Campus Development
Eko D. Widianto, Adian F. Rochim, Oky D. Nurhayati Department of Computer Engineering
Diponegoro University Semarang, Indonesia
[email protected], [email protected]
Sumardi
Department of Electrical Engineering Diponegoro University
Semarang, Indonesia [email protected]
Abstract— A system providing accurate environmental data for campus stakeholders to formulate and evaluate policies of the sustainable campus development is needed. This paper presents the design of WSN infrastructure capable of providing accurate, real-time and reliable environment data, namely PM2.5, SO2, CO, O3, NO2, temperature, humidity, soil moisture and light intensity to be analyzed and presented by servers. This infrastructure is composed of fixed sensor nodes, mobile sensor nodes, display nodes and server nodes. The sensor node provides environment raw data to the server using an RF transceiver. The server processes, stores and presents environment information to public users through Internet and mobile network. This infrastructure can be used as a platform to provide environmental data to decision support system for campus stakeholders, so that a recommendation can be made.
Keywords—WSN; green campus development; decision support system; remote sensing system; environment information system
I. INTRODUCTION
Recently, the major environmental issues faced by campus stakeholders is climate change mitigation and durability/ sustainability of the campus. Universities around the world, including in Indonesia, have had efforts to reduce carbon emissions, manage and improve the development of their sustainable campus[1][2][3][4].
The development scheme of sustainable campus involves three indicator aspects, namely the environment, the economy (research), and education (society)[5]. These aspects has been the pillar, that are interconnected and multidimensional, to realize environmentally sustainable campus. It includes the use and management of energy-efficient and environmentally research activity, and the caring of campus community on their output and outcome through education[6][7].
Metrics used to evaluate the development of environmental campus are Environmental and Social Responsibility (ESR), UI Green Metric and Princeton Review [1][8][9]. ESR index has five criteria, which are campus strategy, integration of the
environmental issues, environment management, environment performance and impact, and the accurate data measurement used to determine the index. UI Green Metric has five criteria, which are environment regulation, climate change mitigation and energy conservation, waste management, water conservation and environment-friendly transportation [10]. Princeton Review has 10 criteria, one of which is the mitigation planning of greenhouse gas emissions.
The metrics evaluate campus strategies, policies and their efforts to realize the green campus. The indicators show the performance results of campus environment and infrastructure planning associated with the use of electricity, the number of cars or motorcycles and the number of bicycles, use of energy-saving devices, use of renewable energy policies, policies to reduce emissions and transport policy to limit the number of vehicles within the campus. Currently, evaluation scoring of those above metrics is done using descriptive and qualitative method with a specific weighting.
The data used to determine the index or score for each indicator must be accurate. The impact of these policies also need to be measured accurately. Gas emission level at points within the campus location and other environmental quantities need to be measured in real-time. The energy (electricity) usage and the use of renewable energy and its efficiency level also need to be measured. These measurements can provide accurate environmental data for campus decision/policies makers to formulate and evaluate their policies in order to develop the sustainable green campus.
In this paper, we present the design of WSN (wireless sensor network) infrastructure capable of providing accurate, real-time and reliable environmental data, such as CO, NO2, density of dust particles, temperature, humidity, light intensity and electric energy consumption and its sources, from many location points in campus area. This infrastructure can be used as a platform to supply environmental data for decision support system of campus development and to present environmental
information to campus and green research community. Using these accurate data, campus stakeholders can evaluate and redefine their strategies, policies and efforts to realize the green campus.
II. REPRESENTATIVE WORKS
There are several studies on environmental information system to describe the impact of the environment on public health and its prevention efforts. One of targeted issues is threat countermeasures to air quality as a result of human activity and nature, such as industry, transport, fires, volcanic eruptions and others, through the development of environmental information system[11]. Some policies need to be taken, one of which is to build the air quality monitoring system with remote sensing[12].
The development of air quality monitoring system from a distance has been supported by recent technology, especially the existence of cheaper and portable sensors, that can provide data in real time with high resolution and higher ability of computing microprocessor / microcontroller, and the growing of wireless communications infrastructure[13]. These technologies accelerate development of WSN. Data from a variety of heterogeneous sensors can be acquired and processed by a microprocessor / microcontroller through a variety of wireless networks, including ZigBee (IEEE 802.15.4), GSM (Global System for Mobile Communications) and Wi-Fi (IEEE IEEE 802.11) [14].
Wireless communication protocols, especially at MAC (Medium Access Control) layer, that coordinates sensor nodes sharing the wireless media, have been also developed. Development objectives are energy efficiency, performance of data delivery and protocol overhead. These protocols are divided into four categories, namely asynchronous, synchronous, frame-slot and multi-channel[15]. In terms of the channel accesses, MAC protocols can be divided into four types, namely cross-layered, TDMA (Time Division Multiple Access), contention-based and hybrid[16].
Those above enabler technologies and protocols provide opportunities to the development of air quality monitoring system and its impact analysis on health and learning outcome, especially for school or campus[6]. The integration of monitoring system to geospatial data infrastructure can also be performed, for example by using the framework OGC (Open Geospatial Consortium). This integration includes the provision of access to the data from the sensor, transferring, processing and presenting the degree of air quality in real-time[17].
Air pollutant parameters that need to be considered in such system are its nature, sources and distribution, its possible impacts on health/learning and how to control them[18]. Type of air pollutants include sulfur dioxide (SO2), carbon monoxide (CO), nitrogen dioxide (NO2), oxidants (O3), hydrocarbons (HC), PM 10, PM 2.5, TSP (dust), Pb (Lead Black) and dust fall[12].
III. WSN INFRASTRUCTURE FOR ENVIRONMENT MONITORING
WSN infrastructure can provide environmental sensor data from many points of campus area accurately and in real-time. A WSN is composed of a large number of networked sensor nodes, which are spatially distributed and work cooperatively to communicate information from the monitored field through wireless links[19].
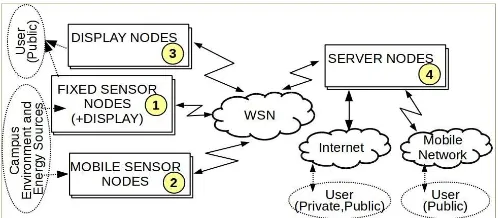
WSN infrastructure for campus environment monitoring can be composed of four subsystems as depicted at Fig. 1, those are (1) fixed sensor nodes, (2) mobile sensor nodes, (3) display nodes and (4) server nodes. Fixed and mobile sensor nodes provide raw data of environment and energy consumption quantities for server nodes. Display nodes present informative environment data to public users solely at a strategic place, such as in front of campus area. Display module can be included in a fixed sensor node. Server nodes collect raw data from sensor nodes, process and store them as informative ones. Server and sensor nodes communicates each others in WSN network. Server nodes provide informative and meaningful data to public users and/or campus stakeholders through Internet or mobile networks. They can access the data using HTTP browser or dedicated application, such as an Android application.
Fixed sensor nodes measure environment quantities and/or energy consumption at fixed location. They provide the raw environment and energy data from that a determined place. A fixed sensor node can have a display module to present environment information for public user. This information is provided by server node.
Mobile sensor nodes also measure environment quantities as the fixed ones. They may be small enough to be attached on moving objects, such as a campus bus or a dedicated car, that have predefined (regular) routes. It can also be participatory air quality sensing system by campus community using a mobile sensor system, such as EveryAware SensorBox, or an sensing mobile application, such as AirProbe[20][21]. A mobile sensor node can provide the raw data from many places so that environment data mapping from campus area can be measured with small granularity.
moving humans from a moderate range (approximately 5 meters). DMD (Dot Matrix Display) devices can be implemented for this display subsystem.
Server nodes collect, store and process raw data from all sensor nodes. It can be a single server or multiple one. Multiple server configuration allows redundancy and/or load balancing system between servers. Raw data from sensor are processed and analyzed by server to become an informative data for user. Several algorithm and technique for server processing can be developed, such as using fuzzy logic, expert system and decision support system. User access to this informative data is served by web and mobile server.
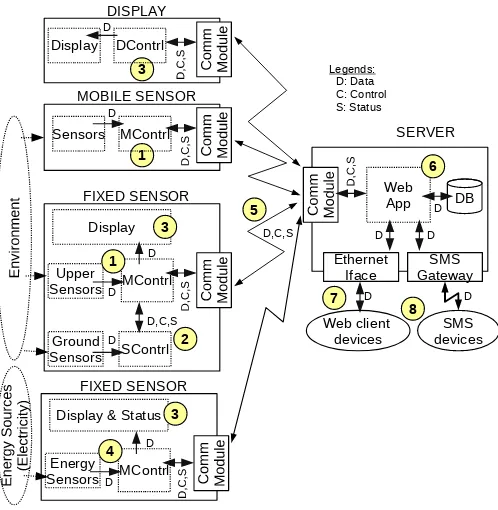
Fig. 2 shows development view of WSN infrastructure for environment and energy monitoring. It explains the components that necessarily used by each node. These are (1) upper/air sensors and its master controller MContrl, (2) ground sensors and its slave controller SContrl, (3) display and its controller, (4) energy sensors, (5) communication module, (6) environmental web service, (7) web-based application and (8) SMS (Short Message Service) delivery system.
Each country has a standard to calculate air pollution index from environment parameter, such as Indonesia that has regulation namely Keputusan Kepala Bapedal No. 107 Year 1997 about calculation, reporting and ISPU (Indeks Standar Pencemaran Udara, air pollution index standard) information. Concentration of PM10, SO2, CO, O3 and NO2 are measured daily to calculate daily index. The calculated ISPU is then compared with data in the ISPU limit table at Table 1 to indicate pollution impact to human.
Table 1: List of Number and Category of ISPU
Index Limit Category
Beside of those air parameter, humidity, temperature, light intensity and soil moisture can also be measured to provide weather information. Air and ground sensors that can be used to measure these parameter listed at Table 2.
Table 2: Sensors used for environment monitoring
No Environment Sensors Pollutant Sources
1 CO TGS2600, MQ-7 Gasoline vehicles 2 HC, NO2 TGS2201, MQ-131 Diesel vehicles
3 PM2.5 GP2Y1010AU0F Dust fall, fire 4 O3 MiCS-2610 Gasoline vapors
5 SO2 MQ-136 Fuel combustion
6 Air humidity and temperature
SHT-11 7 Light intensity BH1750 8 Soil moisture YL-69
Sensor nodes (fixed and mobile) can be implemented by using a microcontroller board that has adequate interfaces for required sensors. They are composed of several functional blocks as depicted at Fig. 3. GP2Y1010, TGS2600 and TGS2201 sensors use one ADC interface for each, while SHT-11, BH-1750 and YL-69 need TWI, I2C and SPI interface consecutively. GPS receiver Neo GM is mainly used by mobile sensor node to provide its longitude and latitude coordinate position. RTC DS1307 device provide time information (real-time clock) for data acquisition. nRF905 transceiver provides a wireless link for data transmission between sensor and server using ISM band frequency (433/868/915 MHz) with typical data rate 50 kbps.
Fig. 2. Development view of WSN Infrastructure for green campus
FIXED SENSOR
Fig. 3. The block diagram of a sensor system
GP2Y1010
At server node, an information system can be developed. This information system collects and records environment data from sensor nodes. Data is then processed and presented using HTTP to users. Sample of campus environment interface depicted at Fig. 4. Sensor nodes status can also be monitored from this system as depicted at Fig. 5.
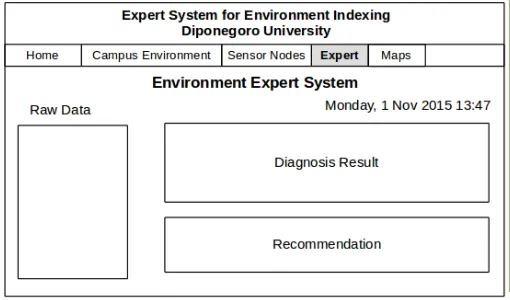
An expert system is developed to present environment data as a diagnose result as depicted at Fig. 6. This expert system provides recommendations for campus stakeholders in realizing their strategies, policies and efforts toward the sustainable green campus.
IV. CONCLUSIONSAND FUTURE WORKS
An WSN architecture for environment and energy monitoring in campus area has been presented. It consists of fixed and mobile sensor nodes that can measure concentration of air, soil quality and other environment parameters, namely PM2.5, SO2, CO, O3, NO2, temperature, humidity, soil moisture and light intensity. These sensor nodes provides data to the server using an RF transceiver. Server collects, processes and presents environment information to public user via Internet and mobile network. The information can be presented as an output from an expert or a fuzzy system.
This infrastructure will be used as a platform to provide environmental data accurately and to analyze them using decision support system so that a recommendation can be
made. Using this recommendation, campus stakeholders can evaluate and redefine their strategies, policies and efforts to realize the green campus.
ACKNOWLEDGMENT
The work is funded by Direktur Penelitian dan Pengabdian kepada Masyarakat (Ditlitabmas) Direktorat Jenderal Pendidikan Tinggi (Ditjen Dikti) Kementerian Pendidikan dan Kebudayaan Republic of Indonesia, DIPA Number 023.04.1.6735453/2015.
REFERENCES
[1] T.S. Grindsted, "Sustainable universities – from declarations on sustainability in higher education to national law", Journal of Environmental Economics, Vol. 2, Num. 2, pages 29-36, 2011.
[2] Grindsted and Hol, "Thematic development of declarations on sustainability in higher education", Journal of Environmental Economics, Vol. 3, Num. 1, pages 32-40, 2012.
[3] Saadatian et al., "Adaptation of Sustainability Community Indicators for Malaysian Campuses as Small Cities", Sustainable Cities and Society, Vol. 6, February 2013, pages 40-50, 2013. Url: http://dx.doi.org/10.1016/j.scs.2012.08.002
[4] Gemma Cassells, et al, "Academic and Research Capacity Development in Earth Observation for Environmental Management", Environmental Research Letters, Vol. 6, 2011. Url: http://dx.doi.org/10.1088/1748-9326/6/4/044002
[5] R. Lukman, D. Kranjc, P. Glavic, "University ranking using research, educational and environmental indicators", Journal of Cleaner Production, Vol. 18, May 2010, Pages 619-628, 2010. Url: http://dx.doi.org/10.1016/j.jclepro.2009.09.015
[6] Woolner, P., Hall, E., Higgins, S., McCaughey, C.,& Wall, K., "A sound foundation? What we know about the impact of environments on learning and the implications for Building Schools for the Future", Oxford Review of Education, Vol. 33, Num.1, pages 47-70, 2007.
[7] Maria Azucena Vicente-Molina, Ana Fernandez-Sainz, Julen Izagirre-Olaizola, "Environmental knowledge and other variables affecting pro-environmental behaviour: comparison of university students from emerging and advanced countries", Journal of Cleaner Production, Vol. 61, 15 December 2013, Pages 130–138, 2013. Url: http://dx.doi.org/10.1016/j.jclepro.2013.05.015
[8] R.F. Sari, "Methodology and evaluation of green and sustainable campus indicators for world university ranking", Proceeding of the International Ranking Expert Group-6 (IREG-6), Taipei, 2012
[9] Princeton Review, Guide to 332 Green Colleges, 2014 Edition
[10] E. Hazelkom, "World-class Universities or World-class Systems? Rankings and Higher Education Policy Choices", UNESCO Forum on Rankings and Accountability in Higher Education, Paris, 2011
[11] UNEP Report, "Early Warning Systems: A State of the Art Analysis and Future Directions", Division of Early Warning and Assessment (DEWA). United Nations Environment Programme (UNEP), Nairobi, 2012
[12] Kelly F.J., et al, "Monitoring Air Pollution: Use of Early Warning Systems for Public Health", Respilogy, Vol. 17, Num. 1, January 2012, Pages 7-19, 2012. Url: http://dx.doi.org/10.1111/j.1440-1843.2011.02065.x
[13] Emily G. Snyder, et al, "The Changing Paradigm of Air Pollution Monitoring", Environmental Science & Technology, Vol. 47, Num. 20, Pages 11369-11377 , 2013. DOI: 10.1021/es4022602
[14] Xufeng Ding, et al, "Environment monitoring and early warning system of facility agriculture based on heterogeneous wireless networks ", IEEE International Conference on Service Operations and Logistics, and Informatics (SOLI 2013), 2013. DOI: 10.1109/SOLI.2013.6611431
[15] Pei Huang, et al, "The Evolution of MAC Protocols in Wireless Sensor Networks: A Survey ", IEEE Communications Surveys & Tutorials, Vol. 15, Num. 1, 2013, Pages 101-120, 2013. DOI: 10.1109/SURV.2012.040412.00105
[16] Shweta Agarwal, Varsha Jain, Kuldeep Goswami, "Energy Efficient MAC Protocols for Wireless Sensor Network", International Journal on Computational Sciences & Applications (IJCSA), Vol. 4, Num. 1, February 2014, 2014. Url: http://airccse.org/journal/ijcsa/papers/4114ijcsa15.pdf
[17] Samadzadegan, F., Zahmatkesh, H., Saber, M., and Ghazi khanlou, H. J., "An Interoperable Architecture for Air Pollution Early Warning System Based on Sensor Web", Int. Arch. Photogramm. Remote Sens. Spatial Inf. Sci., XL-1/W3,
459-462, 2013. Url: http://dx.doi.org/10.5194/isprsarchives-XL-1-W3-459-2013
[18] Feretti D, Ceretti E,De Donno A, et al., "Monitoring air pollution effects on children for supporting public health policy: the protocol of the prospective cohort MAPEC study", BMJOpen 2014;4:e006096, 2014
[19] Priyanka Rawat,et.al, "Wireless Sensor Networks: a Survey on Recent Developments and Potential Synergies", The Journal of Supercomputing, Vol. 61, Issue 1, pp 1-48, 2014. Url: http://dx.doi.org/10.1007/s11227-013-1021-9
[20] Hasenfratz D, Saukh O, Sturzenegger S, Thiele L, "Participatory air pollution monitoring using smartphones", Mob Sens, 2012