DAFTAR
RIWAYAT
HIDUP
Nama
: Suyata Adelina Tanjung
Tempat/Tanggal Lahir
: Balige, 22 Oktober 1995
Jenis Kelamin
: Perempuan
Agama
: Kristen Protestan
Alamat
: Jl. Universitas No. 34 Medan
Nomor HP
: 085372422720
: suyatat638@gmail.com
Riwayat Pendidikan
Tahun 2001-2007
: SDK San Francesco Balige
Tahun 2007-2010
: SMP Swasta Budhi Dharma Balige
Tahun 2010-2013
: SMA Negeri 2 Balige, Asrama Yayasan
Soposurung, Balige
Tahun 2013 s.d sekarang
: Kuliah Pendidikan Dokter Fakultas
Kedokteran Universitas Sumatera Utara
Riwayat Organisasi
Tahun 2012-2013
: Bendahara I Senat Siswa/i Asrama
Yayasan Soposurung Balige
Tahun 2013-sekarang
: Anggota PARYASOP MEDAN
Tahun 2014-sekarang
: Anggota KMK USU UP FK
TABEL PENGOLAHAN DATA
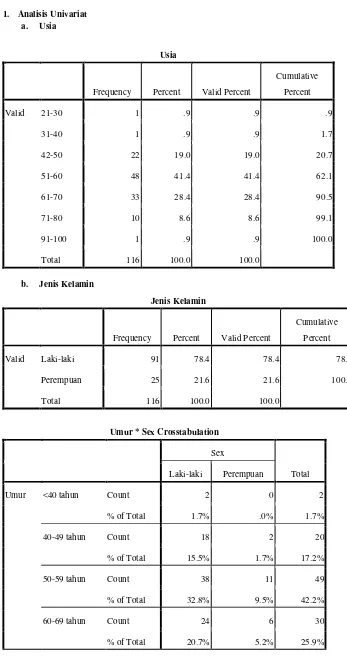
1. Analisis Univariat a. Usia
Usia
Frequency Percent Valid Percent
Cumulative
Percent
Valid 21-30 1 .9 .9 .9
31-40 1 .9 .9 1.7
42-50 22 19.0 19.0 20.7
51-60 48 41.4 41.4 62.1
61-70 33 28.4 28.4 90.5
71-80 10 8.6 8.6 99.1
91-100 1 .9 .9 100.0
Total 116 100.0 100.0
b. Jenis Kelamin
Jenis Kelamin
Frequency Percent Valid Percent
Cumulative
Percent
Valid Laki-laki 91 78.4 78.4 78.4
Perempuan 25 21.6 21.6 100.0
Total 116 100.0 100.0
Umur * Sex Crosstabulation
Sex
Total Laki-laki Perempuan
Umur <40 tahun Count 2 0 2
% of Total 1.7% .0% 1.7%
40-49 tahun Count 18 2 20
% of Total 15.5% 1.7% 17.2%
50-59 tahun Count 38 11 49
% of Total 32.8% 9.5% 42.2%
60-69 tahun Count 24 6 30
>=70 tahun Count 9 6 15
% of Total 7.8% 5.2% 12.9%
Total Count 91 25 116
% of Total 78.4% 21.6% 100.0%
c. Jenis KKM
CHF
Frequency Percent Valid Percent
Cumulative
Percent
Valid CHF 43 37.1 37.1 37.1
Tidak 73 62.9 62.9 100.0
Total 116 100.0 100.0
Aritmia
Frequency Percent Valid Percent
Cumulative
Percent
Valid Aritmia 16 13.8 13.8 13.8
Tidak 100 86.2 86.2 100.0
Total 116 100.0 100.0
Syok Kardiogenik
Frequency Percent Valid Percent
Cumulative
Percent
Valid SK 15 12.9 12.9 12.9
Tidak 101 87.1 87.1 100.0
Total 116 100.0 100.0
Kematian
Frequency Percent Valid Percent
Cumulative
Percent
Valid 2 101 87.1 87.1 87.1
1 15 12.9 12.9 100.0
JenisKKM
Frequency Percent Valid Percent
Cumulative
Percent
Valid 1.00 33 28.4 56.9 56.9
2.00 5 4.3 8.6 65.5
2,3,4 3 2.6 5.2 70.7
3,4 5 4.3 8.6 79.3
1,3,4 2 1.7 3.4 82.8
1,4 1 .9 1.7 84.5
1,3 1 .9 1.7 86.2
1,2,3,4 3 2.6 5.2 91.4
2,4 1 .9 1.7 93.1
2,3 1 .9 1.7 94.8
1,2 3 2.6 5.2 100.0
Total 58 50.0 100.0
Missing System 58 50.0
Total 116 100.0
2. Analisis Bivariat a. Usia*KKM
USIA * KKM Crosstabulation
KKM
Total KKM Tidak
USIA >65 tahun Count 15 10 25
% of Total 12.9% 8.6% 21.6%
<=65 tahun Count 43 48 91
% of Total 37.1% 41.4% 78.4%
Total Count 58 58 116
Chi-Square Tests
Value df
Asymp. Sig.
(2-sided)
Exact Sig.
(2-sided)
Exact Sig.
(1-sided)
Pearson Chi-Square 1.275a 1 .259
Continuity Correctionb .816 1 .366
Likelihood Ratio 1.282 1 .258
Fisher's Exact Test .367 .183
N of Valid Cases 116
a. 0 cells (.0%) have expected count less than 5. The minimum expected count is 12.50.
b. Computed only for a 2x2 table
Mantel-Haenszel Common Odds Ratio Estimate
Estimate 1.674
ln(Estimate) .515
Std. Error of ln(Estimate) .459
Asymp. Sig. (2-sided) .262
Asymp. 95% Confidence
Interval
Common Odds Ratio Lower Bound .681
Upper Bound 4.118
ln(Common Odds Ratio) Lower Bound -.384
Upper Bound 1.415
The Mantel-Haenszel common odds ratio estimate is asymptotically normally distributed under the common
odds ratio of 1.000 assumption. So is the natural log of the estimate.
b. Jenis Kelamin*KKM
Jenis Kelamin * KKM Crosstabulation
KKM
Total KKM Tidak
Jenis Kelamin Laki-laki Count 45 46 91
% of Total 38.8% 39.7% 78.4%
Perempuan Count 13 12 25
% of Total 11.2% 10.3% 21.6%
Total Count 58 58 116
Chi-Square Tests
Value df
Asymp. Sig.
(2-sided)
Exact Sig.
(2-sided)
Exact Sig.
(1-sided)
Pearson Chi-Square .051a 1 .821
Continuity Correctionb .000 1 1.000
Likelihood Ratio .051 1 .821
Fisher's Exact Test 1.000 .500
N of Valid Cases 116
a. 0 cells (.0%) have expected count less than 5. The minimum expected count is 12.50.
b. Computed only for a 2x2 table
Mantel-Haenszel Common Odds Ratio Estimate
Estimate .903
ln(Estimate) -.102
Std. Error of ln(Estimate) .452
Asymp. Sig. (2-sided) .821
Asymp. 95% Confidence
Interval
Common Odds Ratio Lower Bound .372
Upper Bound 2.190
ln(Common Odds Ratio) Lower Bound -.988
Upper Bound .784
The Mantel-Haenszel common odds ratio estimate is asymptotically normally distributed under the common
odds ratio of 1.000 assumption. So is the natural log of the estimate.
c. Heart Rate*KKM
Heart Rate * KKM Crosstabulation
KKM
Total KKM Tidak
Heart Rate >100 Count 15 3 18
% of Total 12.9% 2.6% 15.5%
<=100 Count 43 55 98
% of Total 37.1% 47.4% 84.5%
Total Count 58 58 116
Mantel-Haenszel Common Odds Ratio Estimate
Estimate 6.395
ln(Estimate) 1.856
Std. Error of ln(Estimate) .664
Asymp. Sig. (2-sided) .005
Asymp. 95% Confidence
Interval
Common Odds Ratio Lower Bound 1.739
Upper Bound 23.518
ln(Common Odds Ratio) Lower Bound .553
Upper Bound 3.158
The Mantel-Haenszel common odds ratio estimate is asymptotically normally distributed under the common
odds ratio of 1.000 assumption. So is the natural log of the estimate.
d. TDs*KKM
Tekanan Darah Sistolik * KKM Crosstabulation
KKM
Total KKM Tidak
Tekanan Darah Sistolik <100 mmHg Count 12 4 16
% of Total 10.3% 3.4% 13.8%
>=100 mmHg Count 46 54 100
% of Total 39.7% 46.6% 86.2%
Total Count 58 58 116
% of Total 50.0% 50.0% 100.0%
Chi-Square Tests
Value df
Asymp. Sig.
(2-sided)
Exact Sig.
(2-sided)
Exact Sig.
(1-sided)
Pearson Chi-Square 4.640a 1 .031
Continuity Correctionb 3.553 1 .059
Likelihood Ratio 4.827 1 .028
Fisher's Exact Test .057 .028
N of Valid Cases 116
a. 0 cells (.0%) have expected count less than 5. The minimum expected count is 8.00.
Mantel-Haenszel Common Odds Ratio Estimate
Estimate 3.522
ln(Estimate) 1.259
Std. Error of ln(Estimate) .611
Asymp. Sig. (2-sided) .039
Asymp. 95% Confidence
Interval
Common Odds Ratio Lower Bound 1.063
Upper Bound 11.669
ln(Common Odds Ratio) Lower Bound .061
Upper Bound 2.457
The Mantel-Haenszel common odds ratio estimate is asymptotically normally distributed under the common
odds ratio of 1.000 assumption. So is the natural log of the estimate.
e. Hemoglobin*KKM
Hemoglobin * KKM Crosstabulation
KKM
Total KKM Tidak
Hemoglobin 1.00 Count 25 8 33
% of Total 21.6% 6.9% 28.4%
2.00 Count 33 50 83
% of Total 28.4% 43.1% 71.6%
Total Count 58 58 116
% of Total 50.0% 50.0% 100.0%
Chi-Square Tests
Value df
Asymp. Sig.
(2-sided)
Exact Sig.
(2-sided)
Exact Sig.
(1-sided)
Pearson Chi-Square 12.240a 1 .000
Continuity Correctionb 10.842 1 .001
Likelihood Ratio 12.700 1 .000
Fisher's Exact Test .001 .000
N of Valid Cases 116
a. 0 cells (.0%) have expected count less than 5. The minimum expected count is 16.50.
Mantel-Haenszel Common Odds Ratio Estimate
Estimate 4.735
ln(Estimate) 1.555
Std. Error of ln(Estimate) .464
Asymp. Sig. (2-sided) .001
Asymp. 95% Confidence
Interval
Common Odds Ratio Lower Bound 1.907
Upper Bound 11.756
ln(Common Odds Ratio) Lower Bound .646
Upper Bound 2.464
The Mantel-Haenszel common odds ratio estimate is asymptotically normally distributed under the common
odds ratio of 1.000 assumption. So is the natural log of the estimate.
f. Leukosit*KKM
Leukosit * KKM Crosstabulation
KKM
Total KKM Tidak
Leukosit >10000/mm3 Count 49 39 88
% of Total 42.2% 33.6% 75.9%
<=10000/mm3 Count 9 19 28
% of Total 7.8% 16.4% 24.1%
Total Count 58 58 116
% of Total 50.0% 50.0% 100.0%
Chi-Square Tests
Value df
Asymp. Sig.
(2-sided)
Exact Sig.
(2-sided)
Exact Sig.
(1-sided)
Pearson Chi-Square 4.708a 1 .030
Continuity Correctionb 3.813 1 .051
Likelihood Ratio 4.790 1 .029
Fisher's Exact Test .050 .025
N of Valid Cases 116
a. 0 cells (.0%) have expected count less than 5. The minimum expected count is 14.00.
Mantel-Haenszel Common Odds Ratio Estimate
Estimate 2.652
ln(Estimate) .975
Std. Error of ln(Estimate) .458
Asymp. Sig. (2-sided) .033
Asymp. 95% Confidence
Interval
Common Odds Ratio Lower Bound 1.081
Upper Bound 6.509
ln(Common Odds Ratio) Lower Bound .078
Upper Bound 1.873
The Mantel-Haenszel common odds ratio estimate is asymptotically normally distributed under the common
odds ratio of 1.000 assumption. So is the natural log of the estimate.
g. Natrium*KKM
Natrium Darah * KKM Crosstabulation
KKM
Total KKM Tidak
Natrium Darah 1.00 Count 33 19 52
% of Total 28.4% 16.4% 44.8%
2.00 Count 25 39 64
% of Total 21.6% 33.6% 55.2%
Total Count 58 58 116
% of Total 50.0% 50.0% 100.0%
Chi-Square Tests
Value df
Asymp. Sig.
(2-sided)
Exact Sig.
(2-sided)
Exact Sig.
(1-sided)
Pearson Chi-Square 6.832a 1 .009
Continuity Correctionb 5.891 1 .015
Likelihood Ratio 6.904 1 .009
Fisher's Exact Test .015 .007
N of Valid Cases 116
a. 0 cells (.0%) have expected count less than 5. The minimum expected count is 26.00.
Mantel-Haenszel Common Odds Ratio Estimate
Estimate 2.709
ln(Estimate) .997
Std. Error of ln(Estimate) .385
Asymp. Sig. (2-sided) .010
Asymp. 95% Confidence
Interval
Common Odds Ratio Lower Bound 1.273
Upper Bound 5.767
ln(Common Odds Ratio) Lower Bound .241
Upper Bound 1.752
The Mantel-Haenszel common odds ratio estimate is asymptotically normally distributed under the common
odds ratio of 1.000 assumption. So is the natural log of the estimate.
h. LDL*KKM
LDLdarah * KKM Crosstabulation
KKM
Total KKM Tidak
LDLdarah >=160 mg/dl Count 14 8 22
% of Total 12.1% 6.9% 19.0%
<160 mg/dl Count 44 50 94
% of Total 37.9% 43.1% 81.0%
Total Count 58 58 116
% of Total 50.0% 50.0% 100.0%
Chi-Square Tests
Value df
Asymp. Sig.
(2-sided)
Exact Sig.
(2-sided)
Exact Sig.
(1-sided)
Pearson Chi-Square 2.019a 1 .155
Continuity Correctionb 1.402 1 .236
Likelihood Ratio 2.041 1 .153
Fisher's Exact Test .236 .118
N of Valid Cases 116
a. 0 cells (.0%) have expected count less than 5. The minimum expected count is 11.00.
Mantel-Haenszel Common Odds Ratio Estimate
Estimate 1.989
ln(Estimate) .687
Std. Error of ln(Estimate) .489
Asymp. Sig. (2-sided) .160
Asymp. 95% Confidence
Interval
Common Odds Ratio Lower Bound .763
Upper Bound 5.186
ln(Common Odds Ratio) Lower Bound -.271
Upper Bound 1.646
The Mantel-Haenszel common odds ratio estimate is asymptotically normally distributed under the common
odds ratio of 1.000 assumption. So is the natural log of the estimate.
i. Riwayat DM*KKM
Riwayat DM * KKM Crosstabulation
KKM
Total KKM Tidak
Riwayat DM Diabetes Melitus Count 21 14 35
% of Total 18.1% 12.1% 30.2%
Tidak Diabetes Melitus Count 37 44 81
% of Total 31.9% 37.9% 69.8%
Total Count 58 58 116
% of Total 50.0% 50.0% 100.0%
Chi-Square Tests
Value df
Asymp. Sig.
(2-sided)
Exact Sig.
(2-sided)
Exact Sig.
(1-sided)
Pearson Chi-Square 2.005a 1 .157
Continuity Correctionb 1.473 1 .225
Likelihood Ratio 2.015 1 .156
Fisher's Exact Test .225 .112
N of Valid Cases 116
a. 0 cells (.0%) have expected count less than 5. The minimum expected count is 17.50.
Mantel-Haenszel Common Odds Ratio Estimate
Estimate 1.784
ln(Estimate) .579
Std. Error of ln(Estimate) .411
Asymp. Sig. (2-sided) .159
Asymp. 95% Confidence
Interval
Common Odds Ratio Lower Bound .797
Upper Bound 3.991
ln(Common Odds Ratio) Lower Bound -.227
Upper Bound 1.384
The Mantel-Haenszel common odds ratio estimate is asymptotically normally distributed under the common
odds ratio of 1.000 assumption. So is the natural log of the estimate.
j. Riw. Merokok*KKM
Riwayat Merokok * KKM Crosstabulation
KKM
Total KKM Tidak
Riwayat Merokok Merokok Count 39 39 78
% of Total 33.6% 33.6% 67.2%
Tidak Merokok Count 19 19 38
% of Total 16.4% 16.4% 32.8%
Total Count 58 58 116
% of Total 50.0% 50.0% 100.0%
Chi-Square Tests
Value df
Asymp. Sig.
(2-sided)
Exact Sig.
(2-sided)
Exact Sig.
(1-sided)
Pearson Chi-Square .000a 1 1.000
Continuity Correctionb .000 1 1.000
Likelihood Ratio .000 1 1.000
Fisher's Exact Test 1.000 .578
N of Valid Cases 116
a. 0 cells (.0%) have expected count less than 5. The minimum expected count is 19.00.
Mantel-Haenszel Common Odds Ratio Estimate
Estimate 1.000
ln(Estimate) .000
Std. Error of ln(Estimate) .396
Asymp. Sig. (2-sided) 1.000
Asymp. 95% Confidence
Interval
Common Odds Ratio Lower Bound .460
Upper Bound 2.172
ln(Common Odds Ratio) Lower Bound -.775
Upper Bound .775
The Mantel-Haenszel common odds ratio estimate is asymptotically normally distributed under the common
odds ratio of 1.000 assumption. So is the natural log of the estimate.
3. Analisi Multivariat
Case Processing Summary
Unweighted Casesa N Percent
Selected Cases Included in Analysis 116 100.0
Missing Cases 0 .0
Total 116 100.0
Unselected Cases 0 .0
Total 116 100.0
a. If weight is in effect, see classification table for the total number of cases.
Dependent Variable Encoding
Original Value Internal Value
Tidak KKM 0
KKM 1
Categorical Variables Codings
Frequency
Parameter coding
(1)
HR <=100 x/menit 98 .000
Block 0: Beginning Block
Iteration Historya,b,c
Iteration -2 Log likelihood
Coefficients
Constant
Step 0 1 160.810 .000
a. Constant is included in the model.
b. Initial -2 Log Likelihood: 160.810
c. Estimation terminated at iteration number 1 because
parameter estimates changed by less than .001.
Classification Tablea,b
Observed
Predicted
KKM
Percentage Correct Tidak KKM KKM
Step 0 KKM Tidak KKM 0 58 .0
KKM 0 58 100.0
Overall Percentage 50.0
a. Constant is included in the model.
b. The cut value is .500
Variables in the Equation
B S.E. Wald df Sig. Exp(B)
Step 0 Constant .000 .186 .000 1 1.000 1.000
Block 1: Method = Backward Stepwise (Wald)
Iteration Historya,b,c,d
Iteration
-2 Log
likelihood
Coefficients
Constant
HeartRate(
1) TDs Leukosit Hb Na LDL RDM
Step 1 1 129.331 -1.504 1.196 .806 .802 1.221 .643 -.067 -.080
2 127.585 -1.880 1.569 1.080 1.026 1.573 .737 .108 -.089
3 127.543 -1.942 1.640 1.128 1.063 1.635 .752 .149 -.091
5 127.543 -1.943 1.642 1.129 1.064 1.637 .752 .150 -.091
Step 2 1 129.363 -1.511 1.181 .803 .797 1.214 .632 -.084
2 127.618 -1.890 1.551 1.078 1.021 1.564 .728 .087
3 127.576 -1.952 1.621 1.126 1.058 1.627 .742 .127
4 127.576 -1.954 1.623 1.127 1.059 1.628 .743 .128
5 127.576 -1.954 1.623 1.127 1.059 1.628 .743 .128
Step 3 1 129.336 -1.515 1.160 .775 .791 1.217 .628
2 127.653 -1.885 1.568 1.103 1.026 1.559 .732
3 127.621 -1.939 1.637 1.157 1.062 1.614 .747
4 127.621 -1.940 1.639 1.158 1.063 1.615 .747
5 127.621 -1.940 1.639 1.158 1.063 1.615 .747
a. Method: Backward Stepwise (Wald)
b. Constant is included in the model.
c. Initial -2 Log Likelihood: 160.810
d. Estimation terminated at iteration number 5 because parameter estimates changed by less than .001.
Omnibus Tests of Model Coefficients
Chi-square Df Sig.
Step 1 Step 33.268 7 .000
Block 33.268 7 .000
Model 33.268 7 .000
Step 2a Step -.034 1 .854
Block 33.234 6 .000
Model 33.234 6 .000
Step 3a Step -.045 1 .833
Block 33.189 5 .000
Model 33.189 5 .000
a. A negative Chi-squares value indicates that the Chi-squares
value has decreased from the previous step.
Model Summary
Step -2 Log likelihood
Cox & Snell R
Square
Nagelkerke R
Square
1 127.543a .249 .332
3 127.621a .249 .332
a. Estimation terminated at iteration number 5 because parameter
estimates changed by less than .001.
Hosmer and Lemeshow Test
Step Chi-square df Sig.
1 4.361 7 .737
2 5.871 7 .555
3 4.699 7 .697
Contingency Table for Hosmer and Lemeshow Test
KKM = Tidak KKM KKM = KKM
Total Observed Expected Observed Expected
Step 1 1 11 11.187 2 1.813 13
2 4 5.215 3 1.785 7
3 14 14.839 7 6.161 21
4 8 7.016 3 3.984 11
5 11 8.088 4 6.912 15
6 4 4.332 6 5.668 10
7 3 3.521 9 8.479 12
8 2 2.239 10 9.761 12
9 1 1.560 14 13.440 15
Step 2 1 9 9.634 2 1.366 11
2 3 4.599 3 1.401 6
3 17 17.036 7 6.964 24
4 8 6.985 3 4.015 11
5 11 8.068 4 6.932 15
6 4 4.303 6 5.697 10
7 3 3.566 9 8.434 12
8 2 2.793 13 12.207 15
9 1 1.015 11 10.985 12
Step 3 1 9 9.618 2 1.382 11
2 3 4.603 3 1.397 6
4 4 3.589 2 2.411 6
5 12 9.582 6 8.418 18
6 4 4.058 7 6.942 11
7 2 2.255 6 5.745 8
8 1 1.846 9 8.154 10
9 2 1.969 15 15.031 17
Classification Tablea
Observed
Predicted
KKM
Percentage Correct Tidak KKM KKM
Step 1 KKM Tidak KKM 48 10 82.8
KKM 20 38 65.5
Overall Percentage 74.1
Step 2 KKM Tidak KKM 49 9 84.5
KKM 21 37 63.8
Overall Percentage 74.1
Step 3 KKM Tidak KKM 49 9 84.5
KKM 21 37 63.8
Overall Percentage 74.1
a. The cut value is .500
Variables in the Equation
B S.E. Wald df Sig. Exp(B)
95% C.I.for EXP(B)
Lower Upper
Step
1a
HeartRate(1) 1.642 .710 5.351 1 .021 5.166 1.285 20.772
TDs 1.129 .697 2.622 1 .105 3.094 .789 12.139
Leukosit 1.064 .543 3.834 1 .050 2.898 .999 8.409
Haemoglobin 1.637 .528 9.598 1 .002 5.140 1.825 14.479
KadarNatrium .752 .443 2.888 1 .089 2.122 .891 5.052
LDLdarah .150 .619 .059 1 .809 1.162 .345 3.907
RDM -.091 .498 .034 1 .855 .913 .344 2.421
Step
2a
HeartRate(1) 1.623 .702 5.344 1 .021 5.070 1.280 20.080
TDs 1.127 .697 2.616 1 .106 3.087 .788 12.099
Leukosit 1.059 .543 3.808 1 .051 2.884 .995 8.354
Haemoglobin 1.628 .525 9.603 1 .002 5.095 1.819 14.270
KadarNatrium .743 .439 2.859 1 .091 2.102 .889 4.972
LDLdarah .128 .607 .045 1 .832 1.137 .346 3.738
Constant -1.954 .553 12.488 1 .000 .142
Step
3a
HeartRate(1) 1.639 .698 5.508 1 .019 5.148 1.310 20.225
TDs 1.158 .683 2.878 1 .090 3.183 .835 12.128
Leukosit 1.063 .542 3.844 1 .050 2.895 1.000 8.380
Haemoglobin 1.615 .521 9.610 1 .002 5.027 1.811 13.953
KadarNatrium .747 .439 2.902 1 .088 2.111 .894 4.989
Constant -1.940 .548 12.533 1 .000 .144
a. Variable(s) entered on step 1: HeartRate, TDs, Leukosit, Haemoglobin, KadarNatrium,
LDLdarah, RDM.
Variables not in the Equation
Score df Sig.
Step 2a Variables RDM .034 1 .855
Overall Statistics .034 1 .855
Step 3b Variables LDLdarah .045 1 .832
RDM .020 1 .888
Overall Statistics .078 2 .962
a. Variable(s) removed on step 2: RDM.