National Directorate of Macroeconomics, DGPAR, Tel. +670‑333‑13‑37 Page 1 The year‑on‑year inflation rate at the end of the third quarter (Q3) 2012 was 11.4% for Dili and 11% for Timor‑Leste. These rates are in line with those recorded in the previous quarter and thus suggest a reduction in volatility compared to 2011 and beginning of 2012. However, a persistent double‑digit rate is still high by international standards. External factors were important drivers of Q3 inflation as international prices of oil and food increased, while the USD weakened vis‑à‑vis our trading partners. Domestic factors also played a role, however, with a surge in house‑building costs indicating that demand is outpacing supply of building materials.
Inflation Trend
After declining to 10.1% in March 2012, year‑on‑ year inflation in Dili gradually increased to 11.4% at the end of Q3 2012 (Figure 1). The most substantial
increase came from the Transport and
Communication category, due to a 19% surge in transport prices. Clothing and Footwear, and Alcohol and Tobacco also continued their upward trend; increasing by 14% and 13%, respectively. Moreover, the Food category, which contributes almost 60% to the overall basket, continued to increase at double‑digit rates (12%) mainly as a result of rising prices of cereals, roots and their products, nuts, fruits and non‑alcoholic drinks.
Figure 1. Inflation in Dili by Category (Year‑on‑year, in percent)
Source: DNE & DNME
Similarly, year‑on‑year inflation in Timor‑Leste increased slightly, reaching 11.0% at the end of Q3. The main increases came from the housing category,
with house‑building costs (e.g. plywood, cement, concrete bricks, iron rods, etc.) increasing by 20% compared to Q3 2011.
Figure 2 illustrates the difference between domestic and imported inflation. The latter moderately increased whilst the former decreased compared to the last quarter. Such a divergence between imported and domestic inflation had not been observed since 2008 when the world food crisis led to a spike in imported foods and thus in imported inflation. Although the gap between domestic and imported inflation is now narrowing, domestic inflation remains higher compared to imported inflation.
Figure 2. Timor‑Leste Imported and Domestic inflation (Year‑on‑
Year, in percent)
Source: DNE & DNME
!"!!# $"!!# %"!!# &"!!# '"!!# (!"!!# ($"!!# (%"!!# (&"!!# ('"!!# $!"!!#
)*+,((#-./,((# -.0,((# 1.2,((#345,((# 678,((#9:;,((#<47,((#-*/,($# =4>,($#)*?,($#15?,($#)*+,($#-./,($# -.0,($# 1.2,($#345,($#
@AB
#
=::C# 107:D:0#E#F:>*77:# G0:8DH/2#*/C#=::8I4*?# J:.KH/2# J:.K4D:0C#=.?/HKDH/2KL#3.550H4K#*/C#34?;H74K# J4*08D#
M47?4*N:/#*/C#OC.7*N:/# F?*/K5:?8#*/C#G:PP./H7*N:/# Q/R*N:/#
!"!#$ %"!#$ &"!#$ '"!#$ ("!#$ )!"!#$ )%"!#$ )&"!#$ )'"!#$ )("!#$ %!"!#$
*+,-)!$ .+/-)!$ 012-))$ 345-))$ *+,-))$ .+/-))$ 012-)%$ 345-)%$ *+,-)%$
.67+89/$:66;8$ <7,62=+;$:66;8$
QUARTERLY INFLATION REVIEW
July – September 2012
National Directorate of Macroeconomics, DGPAR, Tel. +670‑333‑13‑37 Page 2
Underlying Causes
After a strong round of appreciation, the USD
declined during the last three months with respect
to the currencies of Timor‑Leste’s main trading partners making, ceteris paribus, imports more expensive (cf. NEER in Figure 3). While it is difficult to measure the lag of this currency effect on the domestic economy, it could be a contributing factor to the Q3 increase of imported inflation. A second development that has certainly contributed to imported inflation is the rise in
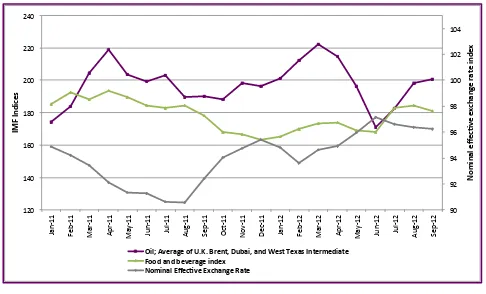
international oil prices. Unlike the effect of
changes in the NEER on inflation, oil prices affect pump prices almost immediately, and, as shown in Figure 3, oil prices increased significantly between June and September. The surge in transport prices mentioned in the first section of this review can thus be directly linked to this increase.
Finally, the dramatic increase in international
agricultural commodity prices in July, which had
caused international alarm regarding a potential new global food crisis, has been short‑lived (the IMF food and beverage index shows a slight decrease in September – Figure 3). Nevertheless, the rise of international prices is likely to have had an effect on imported inflation in Timor‑Leste.
The attenuation of domestic inflation in Q3 compared to previous quarters can be traced back to specific items for which prices seem to have increased less compared to previous quarters, such
as fresh fish, meat and meat products, vegetables. The impressive yields of domestically produced maize and rice recorded after the first (and main) harvest don’t seem to have factored in yet, as the cereals, roots and their products category of the CPI increased by more than 16% in Q3 compared to 11% and 12% for Q1 and Q2, respectively.
Figure 3. International Commodity Prices and Exchange Rates
Source: IMF & DNME
The final item mentioned in the previous section is the large increase in house building costs observed during Q3 2012. This increase cannot be solely explained by international factors, since international market prices have mostly been declining for these items, and the USD has strengthened in the past months against individual countries from which Timor‑Leste imports these specific items (e.g. Indonesia, China). Therefore, it seems that such an increase may be due to
demand‑side factors, with more and more
construction activity being undertaken.
Inflation Prospects
The strong yields in domestic agricultural production imply that food prices, and in particular prices of rice and maize, are likely to
increase less in future months. Given these high
yields and the expectations for the second harvest, Timor‑Leste could have a positive total balance between yearly production and consumption of the two main staple crops. Moreover, international